


The global default rate can only go one way from here
Data from Moody’s shows that the global high yield default rate fell to just 1.27% in September, the lowest rate since March 1995. The global default rate has now been below 2% for 25 consecutive months, the longest stretch since 1978 (when the high yield market didn’t really exist).
The steady decline in the default rate has been a bit of a surprise – indeed, Moody’s model has been predicting a rise in the default rate for about the last two years. The likely reason for the model’s error is that companies that would have gone bust in previous cycles have escaped this time. In this liquidity-fuelled cycle, investors have been perfectly happy to bend over backwards for companies. Covenants have been broken, which legally allows bond holders to bring in the receivers and sell the company’s assets to recover their money, but investors have instead been happy to waive these breaches. In a worryingly large number of cases, troubled companies have been able to borrow even more money from investors to help them out of a hole.
Events of the past few months have resulted in liquidity drying up, and this almost unlimited supply of funding looks to be a thing of the past. Banks have had severe trouble getting financing lately, let alone rickety junk issuers, and the default rate should tick up as bond investors start to rein in lending.
Another indicator that defaults should pick up is that US interest rates have peaked. This chart (click to enlarge) shows that the global default rate has traditionally risen (and sometimes significantly) following the last Fed rate hike of a cycle. The observation makes sense – when the Fed believes it’s time to start slashing rates, the economy is usually a mess and monetary policy is too tight. Tight monetary policy means that there is little liquidity, it is expensive for companies to raise new finance, interest payments are high, all of which causes companies to run into difficulty.
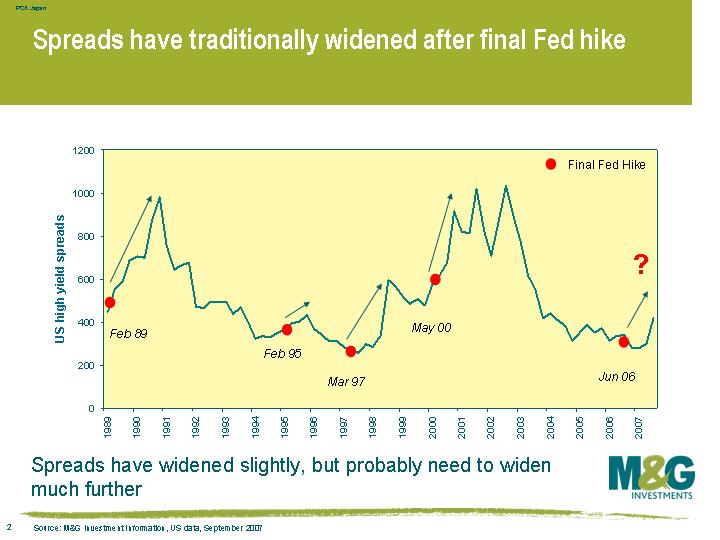
You get a similar story when you mark the high point of the US rate cycle on a graph of high yield spreads, which isn’t a shock seeing as spreads and defaults are closely correlated. As this chart shows, spreads normally start widening just before the final Fed hike in the cycle. This time around though, spreads initially tightened following the final rate hike in June 2006, and the long-awaited sell off only started in June this year. High yield spreads are still very tight on an historical basis, probably because the default rate is still so low. Spreads should widen in tandem with a rising default rate.
The value of investments will fluctuate, which will cause prices to fall as well as rise and you may not get back the original amount you invested. Past performance is not a guide to future performance.
19 years of comment
Discover historical blogs from our extensive archive with our Blast from the past feature. View the most popular blogs posted this month - 5, 10 or 15 years ago!


Bond Vigilantes
Get Bond Vigilantes updates straight to your inbox