oil
Not all oil-exporting countries are the cracking winners you think.
By Charles de Quinsonas
4 June 2026


Energy transition pathways — the move from fossil fuel-based to zero-carbon energy — involve long time-horizons and are highly uncertain, with divergent outcomes based on assumed scenarios. The Coronavirus pandemic dented oil demand and has potentially brought forward peak global demand, if it hasn’t happened already. Against that backdrop, European International Oil Companies (IOCs) have over the past year increasingly converged on Net Zero 2050 CO2 emission targets. It appears that, in today’s world, having a Net Zero by 2050 target provides a social licence to operate.
Not all Net Zero targets are born equal
It has also become clear that not all Net Zero by 2050 targets are the same. Firstly, the most robust targets include scope 3 emissions (the widest commonly-accepted scope, which includes not only direct but also all indirect emissions in a company’s value chain) for the entire business. It is in this scope that some 85-90% of all emissions in the sector fall. Robust targets will also have absolute as well as intensity-based targets, will include elements of short, medium and long term targets to catalogue the transition journey and will be linked to executive compensation. The most stringent will also have a transparent policy on lobbying that is aligned to those targets, backed up with Task Force for Climate-related Financial Disclosures (TCFD) aligned reporting and supported by Science Based Targets (SBT).
Companies like Total fall short in that they target Net Zero by 2050 in Europe alone, rather than across their global operations. BP excludes their stake in Rosneft from their target. Shell and Equinor do not have absolute targets, relying rather on intensity-based measures. OMV’s target covers Scope 1 (direct) and 2 (indirect via purchased energy) emissions only. The US IOCs Exxon and Chevron don’t even have Net Zero by 2050 targets. Perhaps a Biden presidency will wake the US IOCs from their climate slumber. National Oil Companies (NOCs) such as Saudi Aramco, Petrobras and Pemex also lag in the quality of their climate strategies. Taking these considerations into account, as well as others including disclosure and physical climate vulnerability, it is possible to rank the companies based on their energy transition credentials.
A farewell to oil
A common theme of energy transition strategies, notably highlighted by BP’s aim to become an integrated energy company, has been a move away from oil. BP sees oil production declining by 40% to 2030, whilst ENI is working towards a production plateau by 2025 and ‘flexible’ profile from 2025, implying a managed decline thereafter. Such strategies typically lean towards gas as a transition fuel, with a focus on lower production cost, low carbon composition remaining oil reserves and rising capex allocation for building portfolios of low carbon technologies including renewables (in particular offshore wind and solar) and bioenergy. Companies are also positioning themselves in the emerging Hydrogen and Carbon Capture, Utilisation and Storage (CCUS) value chains, whilst building gas/electricity customer portfolios and increasing digitalisation and electric vehicles charging infrastructure.
Preparing balance sheets for Net Zero
New business structures that separate traditional upstream operations from energy transition ones have already been announced and are being implemented. Short term, this does not imply that a full spin-off is the end game, not least as IOCs need their upstream cashflows to fund their energy transition investments in renewables and clean energy. Longer term, a split-up of the two entities is a possibility. The most likely scenario would be the spin-off of the low-carbon business through an IPO or minority stake sale. In that context, assuming the low-carbon business has reached a critical regulated asset base, its debt capacity may be higher than the upstream petroleum part. A debt transfer would not be automatic, and investor consent may not be that easy to obtain. Regardless, both entities would need solid investment grade ratings for business and financial reasons.
Delivering on energy transition involves companies preparing their asset bases for the economic reality of Net Zero. This has meant adjustments to internal oil price assumptions, triggering impairment charges against property, plant and equipment (PPE) on the balance sheet and asset write-offs of exploration intangibles. In accounting terms, this has increased gearing through the reduction in equity (E) in the gearing ratio net debt to net debt plus equity: (ND)/(ND + E).
Impairments are writing down the size of the asset base but the stranded asset debate continues: will companies end up holding oil reserve assets which become worthless as energy transition takes place? The answer depends on the type of oil reserve. These can broadly be split into two categories: proved reserves, and probable/possible reserves. The truth is that much of the balance sheet asset value reflects proved reserves from producing fields. Since proved reserve asset lives (typically 8-12 years) typically sit inside the energy transition timeframe, much of it will be produced before 2050. Not so for the probable and possible reserves, where more of the stranded asset risk resides. With a significant value of energy infrastructure still in place, and likely acceleration of transition in years ahead, it will not be a surprise to see further asset impairments. This puts increased focus on projects awaiting final investment decision today. The barrier for such a project making the grade from a return and emission perspective has never been higher.
Pressure on oil and gas companies’ cost of capital is likely to increase
An increasingly stringent regulatory backdrop, rising ESG scrutiny, climate/environmental litigation and increasing investor/bank exclusions will put pressure on oil and gas companies’ cost of capital. It seems unlikely that the recent credit rating downgrades in the sector will be reversed in haste by the agencies given pressures on cashflows from shareholders (despite the announced dividend cuts such as Shell and Equinor by two-thirds and ENI by circa 60%) and the need to reposition portfolios toward low carbon activities (where returns may be lower). And all whilst managing an orderly decline in the core carbon business from which the majority of cashflow still comes.
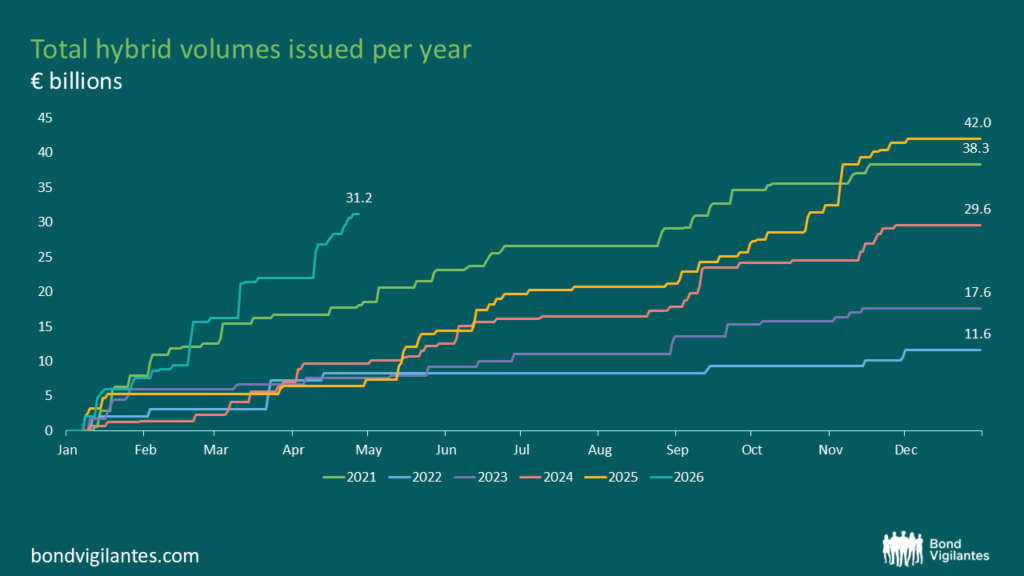
Like other corporates, IOCs issued significant debt during the Coronavirus disruption to improve liquidity, leaving large gross debt balances as a result. With gearing already elevated by the oil price collapse of 2020, and IFRS-16 impact on leverage calculation (the updated accounting regime requires firms to capitalize leases, leading to higher leverage ratios across the board), it was no major surprise this year that first BP, and soon after ENI, made their inaugural entry to the hybrid bond market to seek 100% equity accounting treatment and 50% rating agency equity treatment for hybrid debt raised. ENI claims the hybrid instrument will complement the financial framework over the longer term to allow ENI to pursue their transition strategy. Companies differ in their debt tenor profiles over the horizon of the transition, leaving bond investors with choice over how to position with respect to changing business profiles (see chart below).
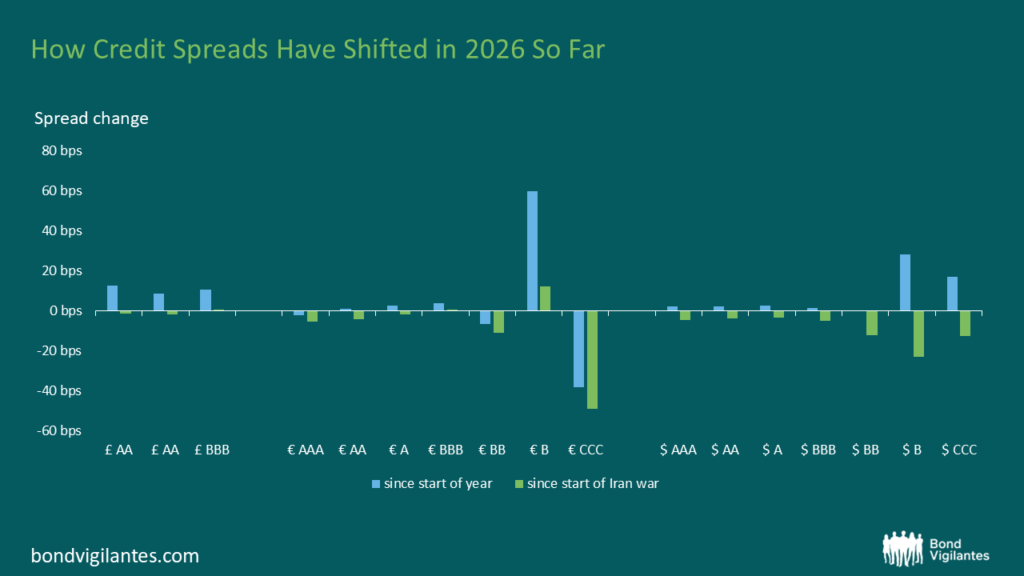
Calculating a transition risk premium will be essential for investors
Whilst the equity market punished the oil and gas sector, it is difficult yet to calculate a meaningful transition risk premium, independent of term and cyclical factors, in the bond market. The chart below shows that a 10-30s curve premium (how much more investors demand to lend for 30 years compared to 10 years) exists for oil and gas bonds, but it is modest compared to the index and could in part be attributed to the cyclicality of the sector. We would expect to see higher 10-30s risk premia for credits with deficient transition strategies. Despite this, investors are apparently happy to continue funding companies with arguably weaker transition strategies such as Pemex, which issued $3.8bn 6.95% 2060 bond in January 2020.
Green bonds
Green-labelled debt remains an area the IOCs are likely observing with increasing interest. Repsol stood out in 2017 when they issued their inaugural green bond. Few followed in their footsteps at the time as the market digested the implications of an oil company issuing green bonds. The green-labelled market has, however, continued to evolve at pace since then, accelerated by the Covid crisis along with the growth of sustainability-linked bonds and the emergence of transition-financing bonds. We expect the growth to continue, especially with the ECB’s recent announcement that from 1st January 2021, bonds with coupons linked to sustainability performance targets will be eligible as collateral and for QE purchases, as long as they comply with all other eligibility criteria. In pockets, it is possible to identify instances where green bonds trade inside the conventional bond curve of the same issuer, effectively commanding a ‘Greenium’. Investors will wrangle for green-labelled bond issuers to have a separate account for proceeds to prevent them being mixed with other cash or inadvertently spent on non-eligible (non-green) projects, amongst other structural features. Meanwhile, with some transition strategies now in place and increasing investment in low and no carbon activities, green-labelled bonds may seem an increasingly attractive source of capital, perhaps even alleviating some of the pressures on the cost of capital of companies in transition.
In its 2016 Annual Report entitled ‘making tomorrow a better place’, Carillion claimed they had ‘a good platform from which to develop the business in 2017’. Less than ten months after publication, Carillion went into compulsory liquidation, bypassing administration and the chance to continue trading. Assets will be realised and distributed to creditors, leaving little or no value remaining. But could this have been foreseen?
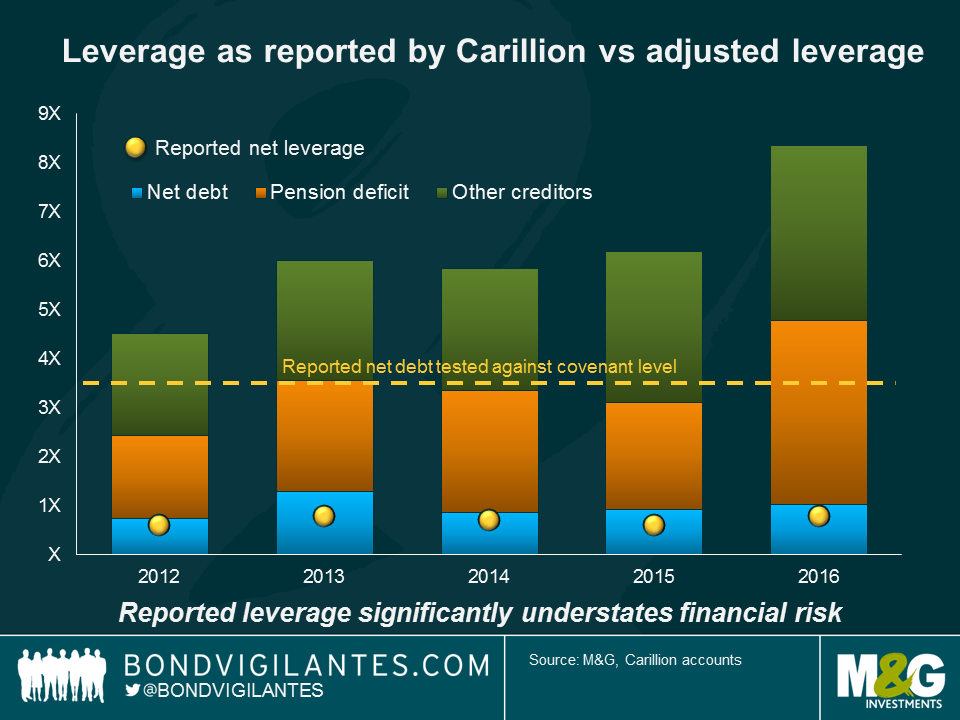
Carillion describe themselves as a leading integrated support service company with extensive portfolio of Public Private Partnership and construction contracts. At the time of the preliminary 2016 results release, Carillion reported cash conversion of 117% and net debt/ EBITDA (Earnings before interest tax depreciation and amortisation – a measure of cash flow) of 0.8x. These measures alone might have suggested an investment grade credit profile, with a relatively low probability of default, but delving deeper reveals a different story.
Carillion defined cash conversion as underlying cash inflow from operations divided by underlying profit from operations. The former includes movements in working capital, used to fund day-to-day operations. Whilst net movement in working capital did not flag anything unusual, it was clear that the deterioration in receivables during the year (£339m movement) was largely being funded by increasing payables (£342m movement), leading to stretched working capital.
Exacerbating the situation, Carillion introduced a reverse factoring Early Payment Facility (EPF – a form of supply chain finance) in 2013 allowing them to extend (almost doubling) payment terms to suppliers up to 120 days. As part of the facility, Carillion’s banks would pay suppliers first before recovering from Carillion thereafter, effectively creating a debt-like short term creditor in the balance sheet.
Whilst the use of reverse factoring facilities by contractors is not unusual, the EPF was optically improving reported cashflow without increasing debt, when in practice it was effectively doing the opposite. Furthermore, cash conversion as reported by Carillion was a poor indicator of the cash situation of the business. A better measure to analyse was absolute free cash flow; taking into account cash spent on capital expenditure, interest, tax, pension contributions, dividends and acquisitions. This would have revealed Carillion were burning through cash in two of the last four years 2013-2016.
The extent to which the EPF was a symptom of Carillion’s malaise or a cause can be debated, however, as the EPF would be invalid should supplier or Carillion become insolvent, it was certainly entwined in the ultimate collapse. Ironically, the two sole references to the EPF in the Annual Report mentioned only the ‘positive’ impact the facility had on suppliers.
At face value, net leverage appeared low in the 2016 report, comfortably inside banking covenants set at 3.5x. A truer picture of Carillion’s liabilities, however, should arguably have included the other creditors created by the EPF, and the pension deficit, which itself had more than doubled during the course of 2016. Viewed in this way, the deterioration of the balance sheet is more readily apparent.
The dust is still settling on the company failure, as stakeholders, including the government, grapple with what went wrong and how it could have been averted. A complex combination of factors played a role, beside the cash and leverage features mentioned, including contract accounting, thin profitability margins, generous dividend pay-outs to shareholders, and intangibles on balance sheet which dwarfed equity leaving them vulnerable to write-downs. The lesson for investors, meanwhile, is that reported numbers rarely reveal the whole picture. Investors need to get into the details of the financials to better understand the true economics of a business.
Green bonds are instruments in which proceeds are exclusively applied towards new and existing green projects – defined as activities that promote climate or other environmental sustainability purposes. They enable capital raising and investment in projects with environmental benefits. The International Capital Market Association (ICMA) set out some guidelines for issuing of green bonds in January 2014.
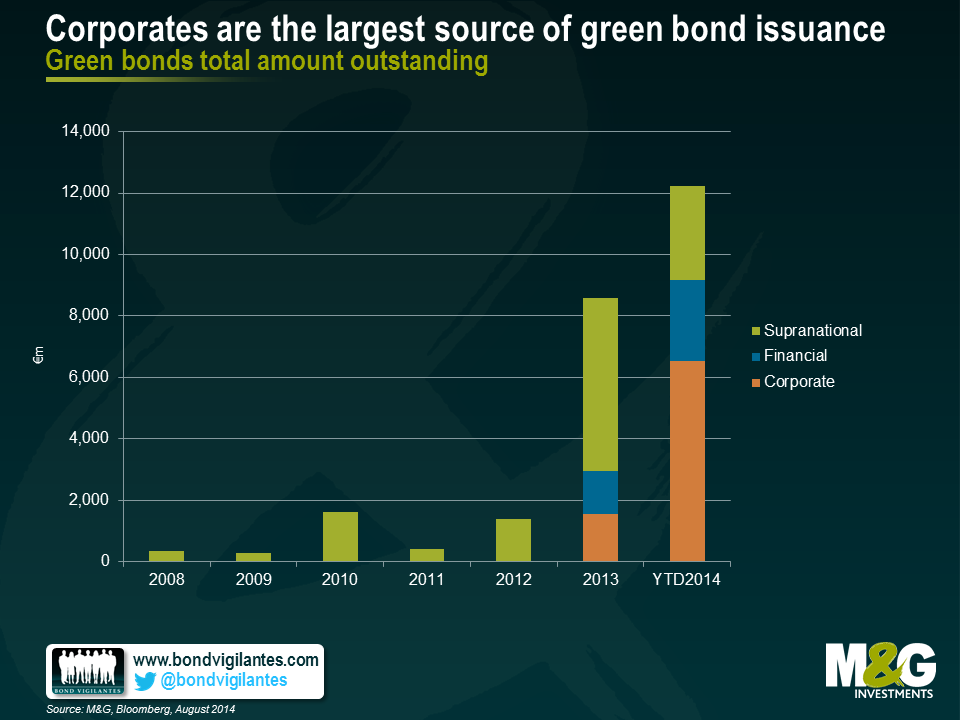
Originally dominated by supranational issuers (for example, European Investment Bank, World Bank and the European Bank for Construction and Redevelopment), financials and corporate issuers are increasingly tapping into this new source of funding.
Green corporate bonds, being a nascent asset class, are a place for many firsts. In October 2012, industrial gases company Air Liquide claimed they were the ‘first private company to issue bonds meeting the SRI investors’ criteria’. This bond predated the Green Bond Principles, and technically may not be a green bond, but is noteworthy in having been ‘mostly placed with Socially Responsible Investor (SRI) mandated issuers’. Since then, we’ve had French utility EDF in November 2013 announce ‘the issuance of the first corporate Green Bond’, although that title may just (by a couple of days) go to the Swedish property company Vasakronan. More recently we’ve had consumer goods company Unilever announce in March 2014 ‘Unilever’s green sustainability bond is the first green bond in the sterling market, and the first by a company in the FMCG sector’.
It is apparent that corporate issuers are keen to spur the development of the green bond market as an alternative funding source and, in doing so, raise awareness of the environmental issues they face. Looking at the chart below shows that corporates are now the single largest source of green bond issuance. Whilst it’s clear that issuers and investors both earn brownie (greenie?) points in terms of enhanced reputation for their involvement and support of sustainable projects, green bonds lack a binding internationally recognised definition, they merely adhere to a voluntary set of guidelines.
One of the structural features of green bonds is that they are often issued off existing Euro Medium Term Note (EMTN) programs and guaranteed by the parent company. Cash flows that service bonds come from the issuer, therefore benefiting from the overall cash flows of the corporate, not just the project that is being funded. It is not surprising, therefore, that the credit rating of these bonds is in line with other bonds issued by the same issuer. This dislocation does, however, mean that investors are not able to identify the cash flows from the underlying project.
Corporate bonds issuers often bracket their use of proceeds into ‘general corporate purposes’, which rarely tells investors much about how or where the proceeds are to be used. Is it, for example, for refinancing, M&A, capital expenditure or share buybacks? In contrast, one of the cornerstones of a green bond is that the use of proceeds is defined in the legal documentation of the security, which should bring a degree of transparency. I say degree because, in practice, once the proceeds are deployed the investor may have limited information on the progress of the project and the extent to which it is meeting environmental targets. For instance, are bond proceeds for the specified project leading to an identifiable reduction in greenhouse gases, water and waste?
There is a certain asymmetry in green credentials required between issuers and investors. For an entity to issue a green bond they have to abide by the principles as outlined by the ICMA. Alongside use of proceeds, these also include project evaluation and selection, reporting, as well as management of proceeds. The latter includes a suggestion to enhance the environmental integrity of the instrument through the use of an external auditor, an independent verifier or as some have called it, a Socially Responsible Investment (SRI) rating agency. Yet with so much stringency on the issuer side, there seems to be no limitation on which bonds funds are able to participate in owning such an issue. Whilst issuers are often citing a desire to diversify their funding sources and attract SRI and Environmental Social and Governance (ESG) conscious investors seeking sustainable (both from a cash flow and environmental perspective) fixed-income instruments, the investors themselves do not necessarily need to have such a green bill of health.
Indeed, even a bond issued in a ‘green wrapper’ may not satisfy certain SRI funds which may argue, rightly or wrongly, for example, that EDF is using cash flows generated through nuclear power activities to pay coupons on its green bond. Another angle on this would be to say that environmental projects are receiving credit enhancement through use of corporate cash flows to prop-up investment in green initiatives. Regardless, the burden remains with the investor to determine how green the bond is. The rating agencies have so far not waded into the argument by assigning a relative ranking of ‘greenness’.
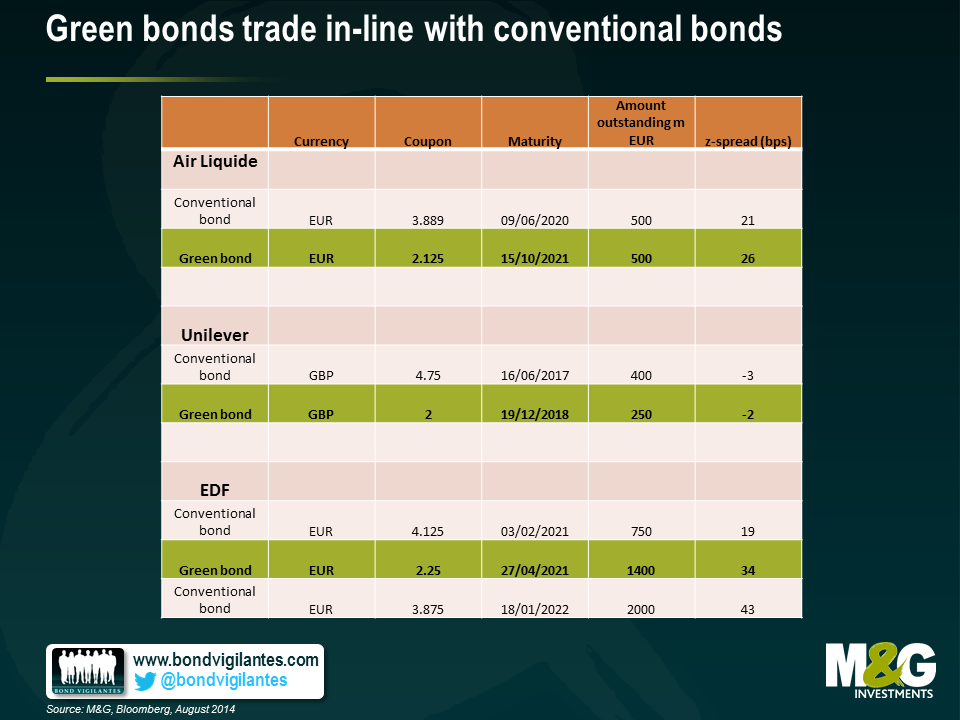
Finally, looking at a few examples of corporate green bond issuers in the table below, it appears that the pricing of green bonds on the secondary market is in line with other (‘non-green’) issues, which to us makes sense given the structural and cash flow arguments mentioned.
Guest contributor Vladimir Jovkovic, Credit Analyst
Issuance in the high yield bond market in Europe this year through October has already exceeded the total issuance for the full year in 2009. The novelty since the reopening of the market in 2009 has been the fact that high yield corporates have been looking to refinance senior secured bank loans into senior secured bonds, rather than the more common unsecured bonds. As such, the proportion of secured bonds issued by high yield companies after the financial crisis has been ~40% of total issuance compared with the more muted 10-15% level before the crisis (see chart).
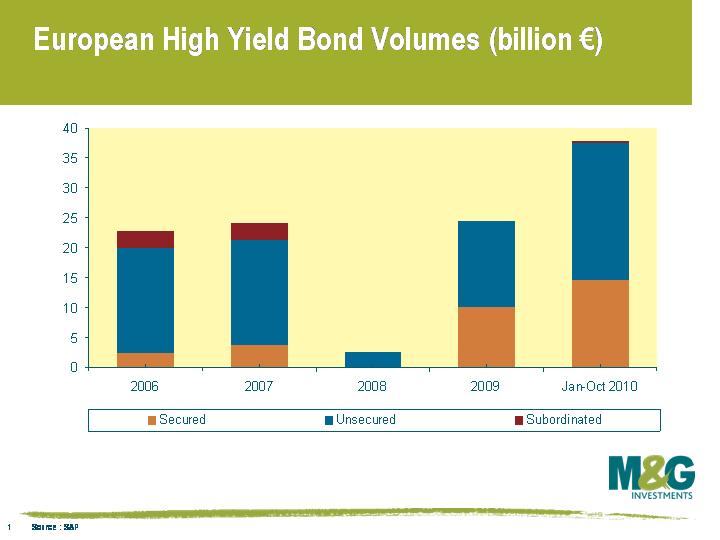
Part of the reason in the shift has been the recycling of loans associated with LBOs into the bond market as the primary loan market effectively shut down. As banks repair their balance sheets and restrict their lending, the public bond market is stepping in to fill the gap.
The question then arises, how will the relationship between senior secured bondholders and senior secured lenders develop? Will lenders continue to have disproportionate control on enforcement of security? Will senior secured bonds create more stability in the high yield market? The answers to these questions will no doubt emerge with time, but meanwhile and more fundamentally, how secure are secured bonds?
For a start, the ‘Senior Secured’ label is not a panacea for bullet proof security. Often the ‘Secured’ label is in fact misleading once you delve into the documentation. Secured bonds often involve pledging security on physical assets (for example plant and machinery), typically with a limit on the proportion of assets and cash flow derived from the assets covered. This in itself will partially define the security of the bond. However, some secured bonds have a security which consists of equity in subsidiaries of the issuer – for example Polish Television Holding which issued bonds secured by share pledges on its stake in TVN, a broadcaster. This is clearly not as secure as security against physical assets; and, therefore, the question then becomes whether these soft security ‘secured’ bonds are justified to have lower coupons compared with unsecured issues.
Then there is the more contentious issue of relative security in structures that contain secured bonds as well as loans. In the case where senior secured bonds partly refinance existing senior secured loans, whether the new senior secured bonds rank pari passu (equally) with the existing secured loans will depend on whether they share the same position in the capital structure and the extent to which the security package shared is the same. It appears that in recent transactions when existing bank debt is partially refinanced with senior secured bonds the loan holders retain control, whilst when both bonds and loans are refinanced together bondholders have an opportunity to share control.
It is also important to consider the inter-creditor deed, which may determine the loss sharing arrangement between creditors and their effective relative ranking on enforcement. The inter-creditor deed has not always been made available to bondholders, which has made it difficult to ascertain bondholders’ precise rights in an enforcement scenario. For example, the inter-creditor could specify that senior secured bond holders are not part of the instructing group for enforcement proceedings, leaving them in a passive position with respect to controlling negotiations, were a default to happen.
With the rise in issuance of senior secured bonds and their greater enforcement rights compared to the more traditional unsecured bonds, making the inter-creditor available to high yield bonds holders makes sense. It appears, at least for now, with recent high yield issuers such as Exova (testing and advisory services), R&R (ice cream) and Polypipe (pipes for construction) that the tide is shifting in favour of higher disclosure. Greater transparency in the market will carry the benefits of improved liquidity and depth of market as bond holders become better equipped to answer the question ‘How secure is secured?’.
Guest contributor – Vladimir Jovkovic (Credit Analyst, M&G Credit Analysis team)
By now we are all well aware of the economic problems that Greece faces. Certainly we have mentioned Greece a few times on this very blog. But let’s not forget that the Greeks have given the world many, many wonderful things. Democracy. The musings of Socrates (“I am not an Athenian or a Greek, but a citizen of the world”). Zorba’s dance. And centaurs!
In Greek mythology, the centaurs are a race of creatures composed of part human and part horse. Why is this relevant? Well, corporate hybrids are the centaurs of the bond world.
Corporate hybrids are bonds issued by companies that have features of both debt and equity capital, hence the term `hybrid’. Many readers would be familiar with the original hybrid security: preferred stock, representing ownership in a company (like equity) but having fixed payments (like bonds). Another example of a hybrid security is the convertible, however, here we are referring to non-dilutive corporate bonds which rating agencies assign equity credit to, and hence are different to both prefs and converts.
Like traditional bonds, these hybrid securities have fixed coupons and can be redeemed for fixed amounts. Like equity, they are subordinated to other types of debt and issuers can choose not pay coupons under certain circumstances without triggering an event of default. Issuers also have the ability to call the bonds before maturity, which itself is typically 60 years or more and often perpetual. In some ways they are similar to tier 1 bank bonds. Like tier 1 debt, hybrid securities are deeply subordinated instruments and the extent of subordination is usually captured within the terms governing the particular security.
That said, there are differences between tier 1 and hybrid debt. For example, tier 1 debt mandatory triggers are tied to regulatory requirements and therefore have elements of standardisation, whilst corporate hybrids are more variable according to how much equity credit they are assigned by rating agencies. In addition, whilst banks require constant access to the market to finance themselves, corporate hybrids are often issued as one offs linked to individual events such as acquisitions or pension funding.
Why do corporations issue corporate hybrids in the first place? Corporate hybrids give issuers increased financing flexibility, for example with respect to interest payments and repayment maturity, whilst controlling overall cost of capital. Hybrids are sufficiently debt-like that a company’s interest payments to note holders are tax deductible. Additionally, hybrids are sufficiently equity-like that the company’s financial ratios are improved.
There are other reasons why it may be in a company’s interest to issue hybrid debt. For example, a company with pressure on its credit rating may issue hybrid debt as it is a way to obtain equity credit without issuing equity. In an acquisition scenario, the acquirer can use hybrids as a means of financing whilst reducing the impact on credit ratings. The benefit in this scenario is that by issuing hybrids the company can potentially avoid diluting existing shareholders through executing a rights issue.
From an investor’s perspective, hybrids potentially have a higher implied rate of return compared to typical corporate bonds, and offer risk diversification benefits. So these instruments can be an attractive proposition for investors and issuers alike.
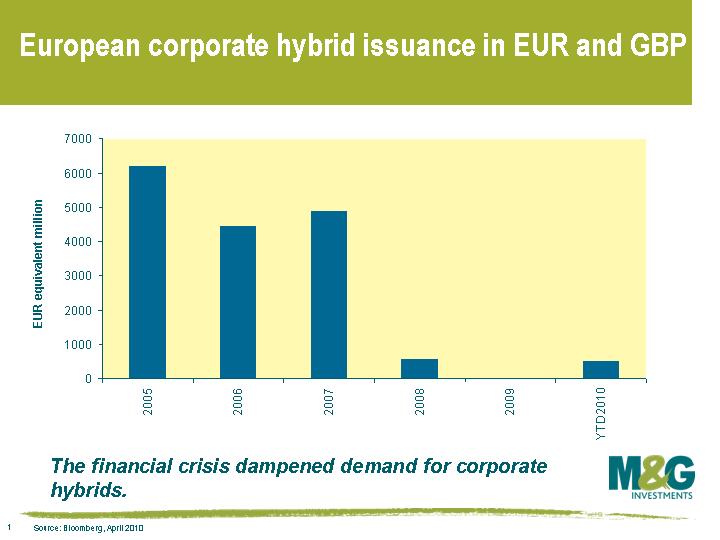 Despite their potential attractiveness, the hybrid market almost shut down as the financial crisis unfolded but is showing some signs of recovery. The current cohort of European hybrid issuers largely belongs to the 2005-7 vintages; these were all issued into a strong corporate bond market. 2008 and 2009 saw virtually no new hybrid issues as the financial crisis unfolded, but this did not spell an end to the instruments, as seen in this chart. Indeed the most recent issue was made by the Dutch grid operator TenneT in February 2010.
Given their complex nature it is important that investors understand the risks involved in investing in these types of securities by undertaking a thorough fundamental analysis of the company and the particular structural features of the hybrid security itself. For example, the replacement language, the call feature, the step-up rate, how the deferral trigger is defined and whether interest payments will be cumulative or not. Adding further difficulty to analysing these securities is the fact that the European market is very diverse; the rating agencies all use different methodologies, and the methodologies themselves are continuously evolving.
While the Greek god Perses (the god of destruction) is currently running amok in the Greek government bond market, we believe that the centaurs of the bond world, hybrid corporates, can potentially be a good source of alpha for bond investors providing they do their homework.


Sign up to the Bond Vigilantes mailing list to ensure you never miss a great article from our expert Bloggers. We will email all new articles to your inbox, meaning you can stay on top of the world of Bonds.
I confirm that I would like to receive information about Bond Vigilantes and products and services from M&G Securities Limited.
We will use the email address and personal data you have shared with us to send you this information. For existing customers, submitting your contact details and requesting to receive this information from us, will replace any earlier choices you have made in respect of marketing information.
You can unsubscribe from marketing at any time, at which point we will not send any further marketing information to you, by selecting the unsubscribe link in all communications.