Panopanic 2018
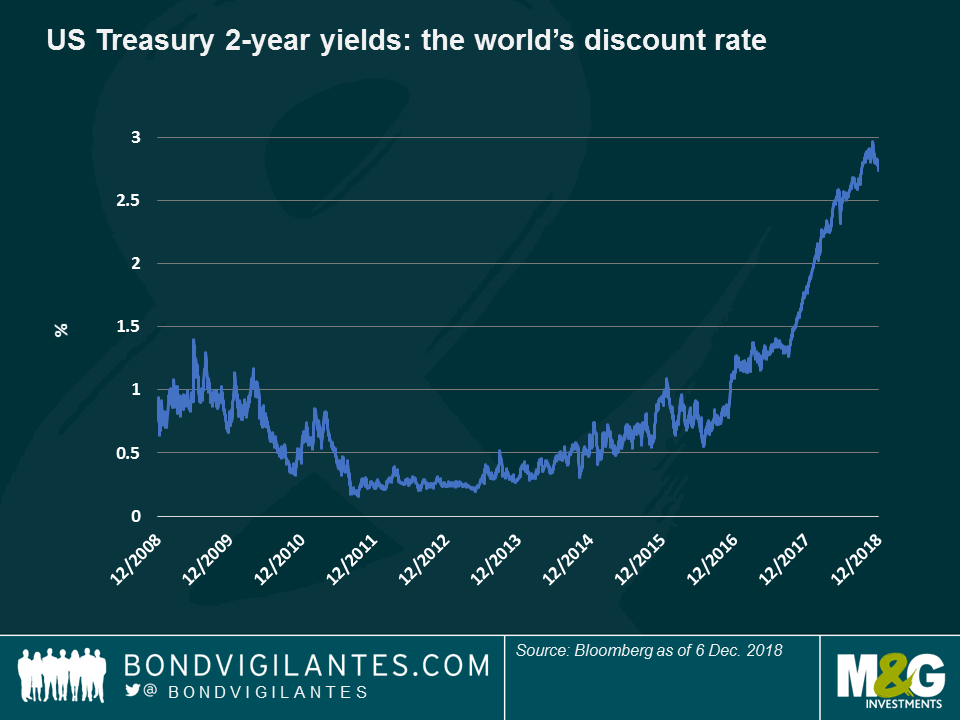
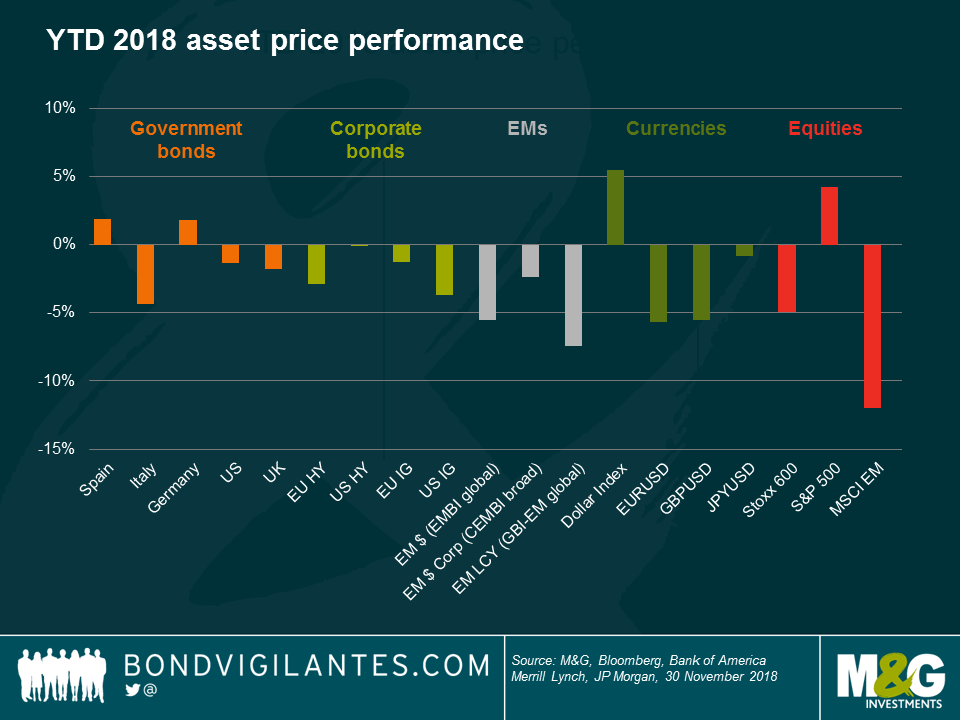
Whilst you can make some strong arguments for the negative returns from 90% of asset classes in 2018 based on the return of populist politics – think of Brexit, Italy’s political instability, AMLO’s election in Mexico and tariffs everywhere – the answer to those negative returns might be simpler: the de facto global discount rate, the 2-year US Treasury bond yield, has risen by almost 100 basis points (bps) over the year, and thus repriced global assets. Why did this happen?
Well, 2018 was the year in which the global Quantitative Easing (QE) experiment started to come to an end. In the wake of the Global Financial Crisis (GFC) in 2008 and the aftershock of the subsequent Eurozone Debt Crisis, central banks around the world started buying their own government bonds on a massive scale. The effectiveness of such programmes has been widely discussed, but most academic literature agrees that buying sovereign bonds brought down yields, creating a “portfolio rebalancing” effect that led investors to reach into riskier assets for income. In the UK, gilt investors sold their government bonds to the Bank of England and bought high quality corporate bonds instead; credit fund managers similarly added high yield bonds to their portfolios, while high yield investors moved down from BB to B rated debt. This led to a global inflation in asset prices, with the price of everything, from equities to art and fine wine, going up. The owners of such assets tended to be already wealthy, so inequality in society increased. Central banks regarded this as a known and necessary side effect, since inflation and economic growth also rose due to lower financing and debt servicing costs, benefiting everybody – but some argue that QE was a factor in the rise of political instability.
If you believe all this to be true, then you must also believe that when QE is reversed and becomes Quantitative Tightening (QT), then those portfolio effects should also turn. This year, we have already seen sovereign bond yields around the world starting to rise, helping risk-averse investors achieve their income targets without taking so much credit risk. This has led to the “yield tourists” in higher yielding asset classes starting to move back up the quality curve, pushing risk premia upwards, lifting borrowing costs and dragging down the price of risky assets.
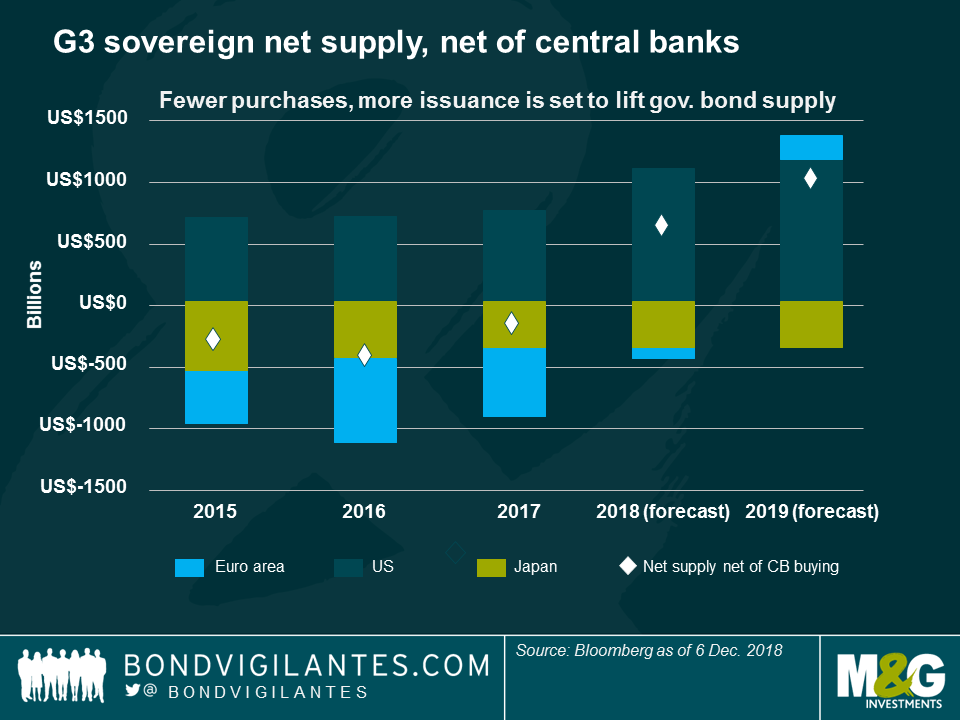
So far, QT has mainly been a feature of US monetary policy and the Federal Reserve’s balance sheet: the central bank’s holdings of US government bonds, mortgage-backed securities and other assets is expected to shrink to around $3 trillion in two years’ time, from a peak of over $4 trillion between 2015 and 2017. Whilst the Fed is not actively selling bonds, the absence of its market presence as an ongoing bond buyer is highly relevant, especially at a time when supply is only set to increase. US President Trump’s tax cuts and the ongoing increases in fiscal burdens caused by an ageing population mean that we will see budget deficits of well over $1 trillion per year for the foreseeable future. So, more bonds are coming to market, but the biggest buyer has gone.
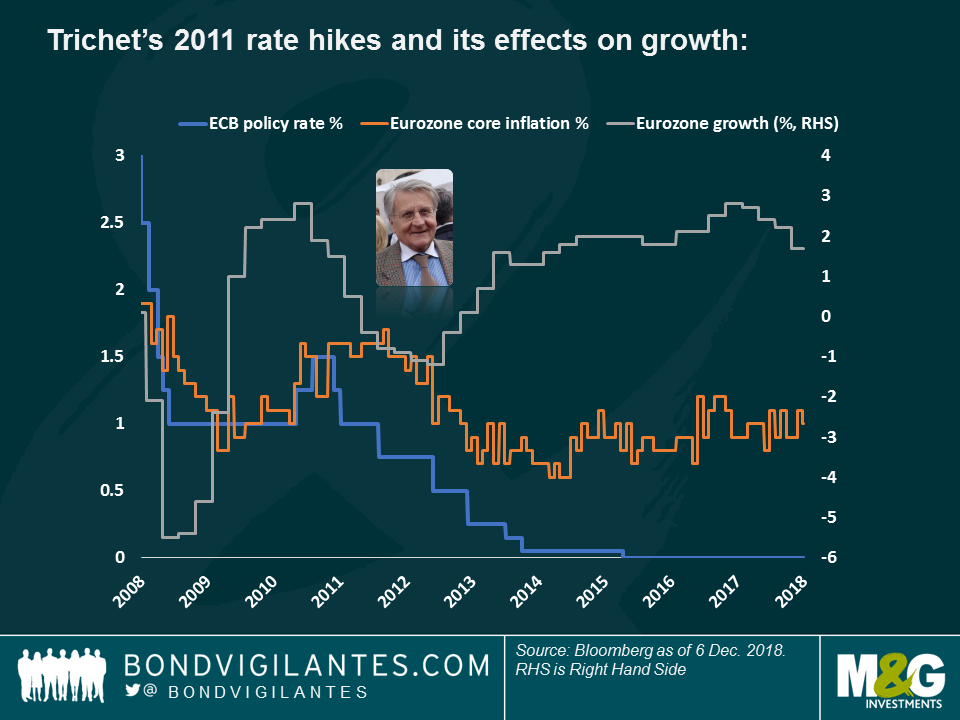
The European Central Bank (ECB) is also starting to exit QE, first by reducing its monthly bond purchases, and then by cutting them altogether by the end of this year. This is set to happen despite the turbulence in Italian bond markets (the BTP 10-year yield hit 3.68% in the final quarter of this year on fears over Italy’s future in the Eurozone and the country’s debt sustainability), and also despite a stubborn core inflation rate stuck at around 1%, well below the ECB’s 2% target. Could ECB President Mario Draghi be about to make the same mistake as his predecessor Jean-Claude Trichet in 2011, when he tightened monetary policy too early (blue line), putting brakes on a fragile economy (grey line) whose only inflationary pressures came from higher oil prices (orange)?
We fear Main Street may soon start feeling the QT pain, as Wall Street started doing so this year. But first, some good news: most corporate issuers took advantage of generationally low interest rates to borrow cheaply, and at long maturities. This means we don’t need to worry too much about an imminent “wall” of maturing corporate bonds, as companies have extended debt maturities, delaying the moment in which they seek capital to refinance their debt, typically at much higher interest costs. Also, according to Fed Chair Jerome Powell, rates may not be too far from their cycle highs.
“Interest rates are still low by historical standards, and they remain just below the broad range of estimates of the level that would be neutral for the economy,” – Jerome Powell, 28 Nov. 2018 (retracting from a month earlier assessment, in which he said that rates were “a long way from neutral.”)
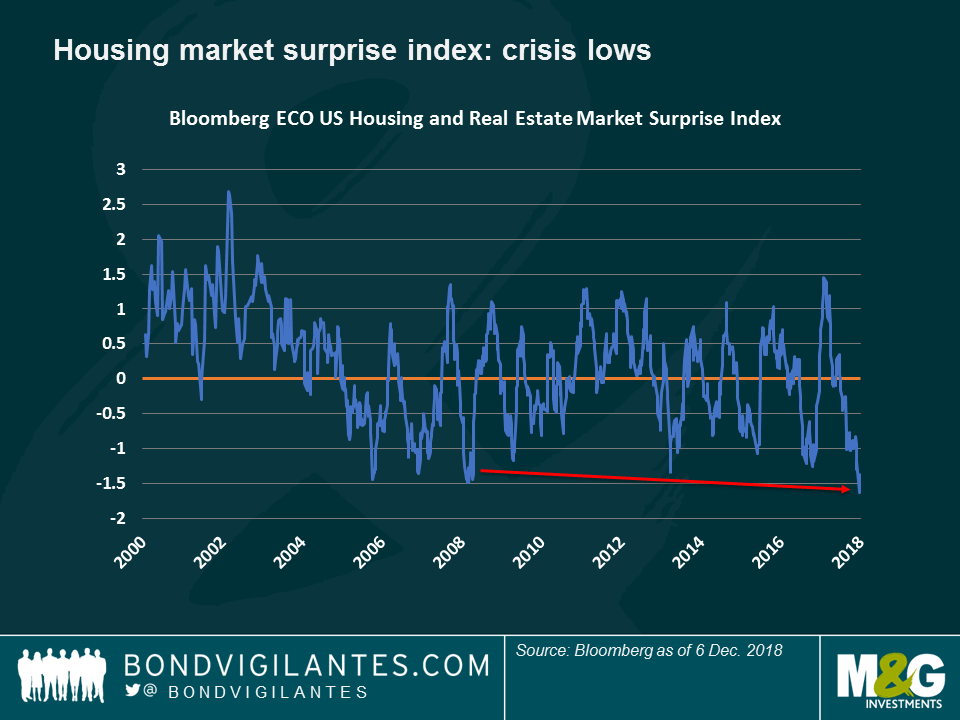
But higher rates do matter now (perhaps a factor in Powell’s rhetoric change): the US 30-year mortgage rate hit 4.8% recently, up from 3.3% in 2016. Whilst most existing homeowners, like corporates, will have locked in those cheap rates, new borrowers face costlier loans, and this is already having an impact: US housing and real estate data is surprising to the downside at a rate that exceeds that seen even in 2008 and 2009:
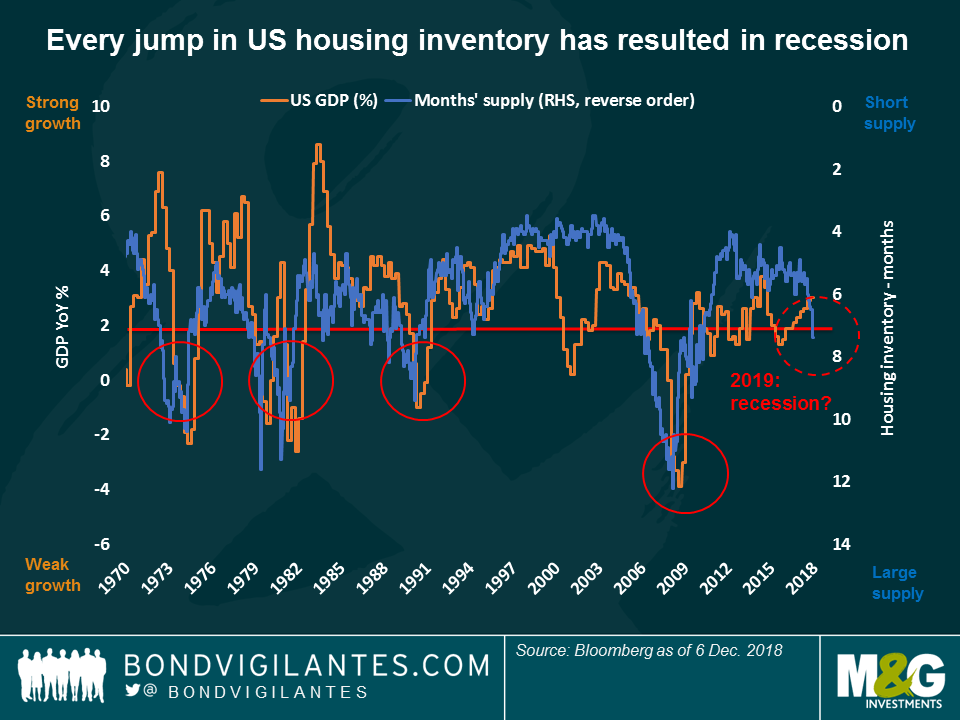
Housing is REALLY important to the economy. The “multiplier” effect of a house being built is significant as it is a labour-intensive industry; also, when you buy a house you also purchase white goods like fridges and freezers, TVs and furniture – and often a car (more on autos later). To assess the impact of the housing market on the economy, our favourite chart in 2007 showed the relationship between housing inventories (unsold new homes measured in months’ worth of supply) and US GDP growth. Whenever you saw the supply of unsold homes reach 7 months, a recession followed. It certainly did in 2008, despite the consensus of economic forecasters believing that economic growth would be 2.4% – it was actually negative. Why should we worry now? Well, the supply of unsold new homes is… 7.4 months (blue line).
As for autos, a bellwether of consumer confidence, the picture isn’t pretty, either. There are many reasons for global car sales to be falling: new emission standards, diesel scandals, tariffs, the rise of Uber/car sharing and the deferral of electric car purchases ahead of infrastructure upgrades. Still, the degree to which car sales is falling is shocking, at -10% per year. Reality is starting to bite: General Motors, for instance, recently announced US plant closures and nearly 15,000 job cuts.

Reflecting this gloomy scenario, we have the one indicator that is really getting people worried: the shape of the yield curve. Traditionally, healthy-looking yield curves are upward sloping, with yields on long-dated bonds higher than those with short maturities, reflecting a premium for uncertainty (future inflation shocks or a fiscally irresponsible government, for example). But when the yield curve flattens and even inverts (with long bonds yielding less than shorter-dated ones), this is usually a harbinger of an economic slowdown as it reflects lower confidence in the future. In fact, there are virtually no incidences of an inversion not being followed by a recession, which in part explains why equity markets fell by 3% on December 4th, just as 5-year Treasury yields slipped below those at 2 years. When long-dated bonds yield less than short-dated ones, the bond market is predicting that interest rates will need to be cut by the central bank because recession is coming.
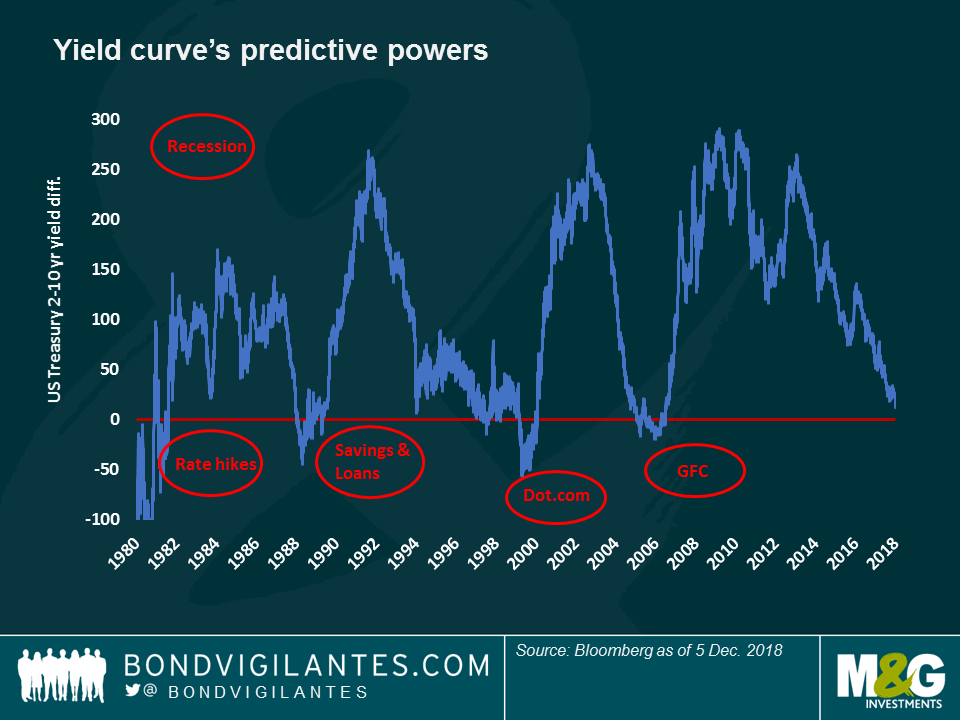
Are we therefore near the peak of the Fed hiking / tapering cycle? If so, you might think that 2018’s sell-off in almost all asset classes might be nearly over, and that there is value in both government bonds and credit. But for the latter there might be an economic slowdown to navigate first.
High yield (HY) has done particularly well since the aftermath of the 2007-08 financial crisis (except in 2015, given the plunge in oil prices). The asset class has benefited from the so-called Goldilocks scenario, in which growth is strong enough to fuel earnings, but not so much to force interest rates significantly higher. This has kept default rates low, at a time when the yield-tourists were happy to go down the capital structure in order to lock in good income.
This, however, started to turn this year as 2-year Treasuries yield 2.7%, with little risk, making Non-Investment Grade businesses less attractive on a risk-adjusted basis. Markets have been merciless: US HY spreads, for instance, have widened more than 100 bps in barely two months. Still, the asset class is one of the very few sectors in the black this year, largely supported by a sharp reduction in supply: as interest rates have gone up, companies have flocked to the leveraged loan market, a cheaper form of finance. The move has also been welcomed by investors, happy to receive a variable interest rate in a rate-rising environment – and also happy to seemingly ignore the deterioration in lending standards and the weak covenants attached to those loans.
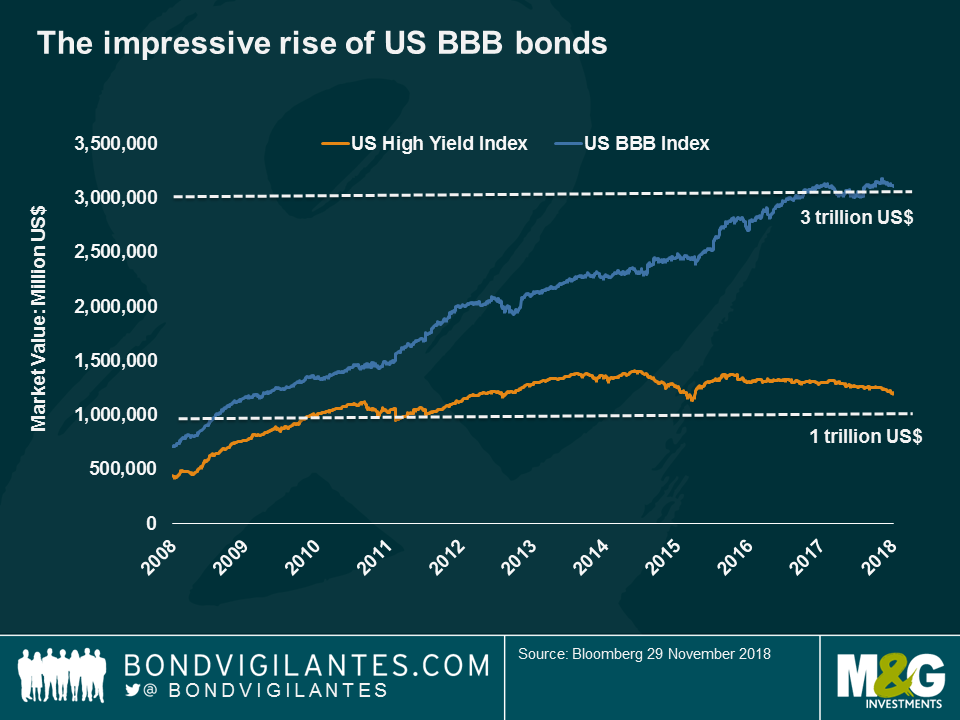
If short supply has helped HY, the opposite has dragged down US Investment Grade (IG) corporate bonds so far this year: a decade of cheap money has helped US IG companies issue billions of dollars worth of debt, often used to increase dividend payments or buy-back their own shares, enhancing equity prices. The market value of the IG rating bucket just above junk, or BBBs, has actually swollen to $3 trillion, more than twice its level a decade ago. It is now almost three times the size of the entire US HY market, raising concerns about the effect of potential downgrades in the HY universe.
One credit area, though, that has traditionally benefited from rising rates is banking, as financial institutions borrow short-term money in order to make long-term loans, so rising rates can boost their profit margins. Banks have also better capitalised balance sheets, following more and tougher regulation after the Financial Crisis – once compared to casinos, some banks look and trade now more like utilities. Banks could also benefit from what it is still a positively-growing global economy. Valuations might be more attractive in Europe, as the ECB’s QE programme has only bought traditional non-financial bonds, leaving bank debt with relative high yields per a given credit quality.
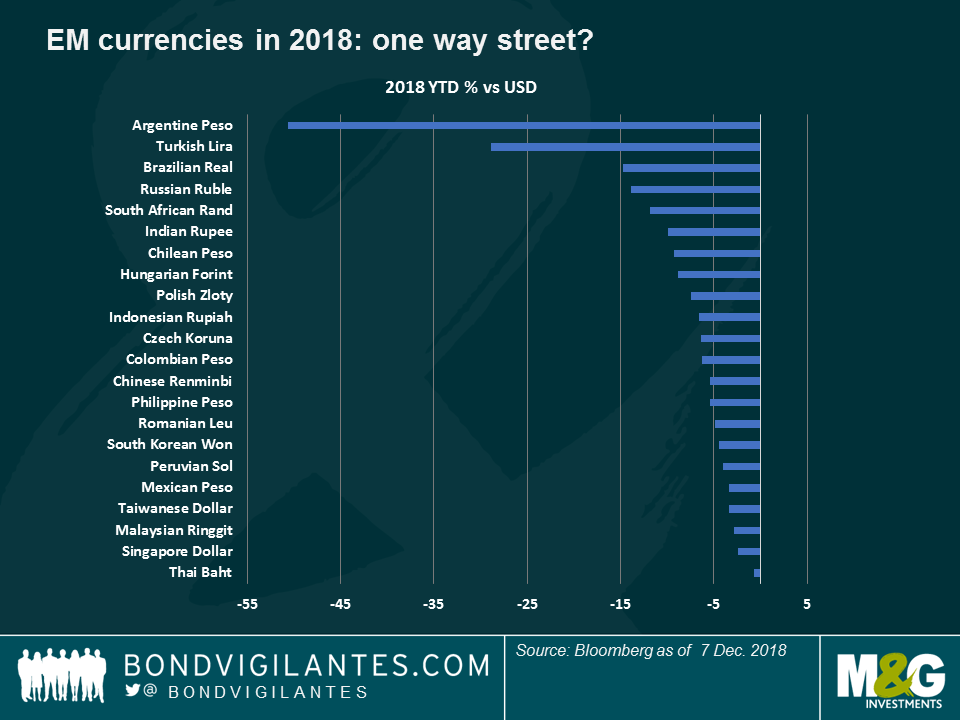
If we are looking for growth, Emerging Markets (EM) seem to be enjoying more of it than Developed Markets, and are forecast to continue doing so. EMs may also be more attractively valued going into 2019, following a poor 2018, when they have been hit by a rising dollar, the ongoing trade wars, a slowdown in China and idiosyncratic stories in Turkey and Argentina. Nobody knows what 2019 will bring, as some of the headwinds that shook the asset class in 2018 are still prevalent, including the trade tensions that could hinder global growth. However, and much to EM’s relief, dollar strength might be contained by an increasing US Budget deficit and a potential slowdown in US growth.
The one thing that seems certain is that volatility is here to stay – but that brings opportunity. We saw in 2018 how Brazil’s election substantially lifted the Real and reduced the country’s bond yields. Next year may bring us further opportunity, with scheduled general elections in India, Argentina, South Africa, Ukraine and Nigeria. Following this year’s sell-off, with some EM currencies down 20% or more, valuations are more attractive.
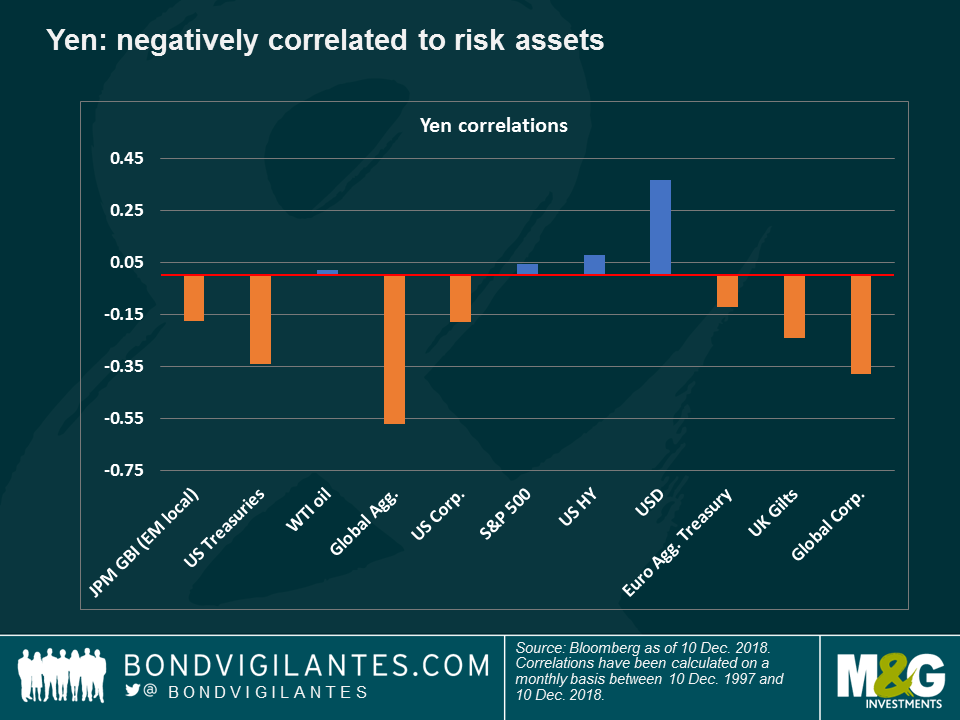
The one currency that has (just about) held its value against the dollar this year is the yen. Despite the country’s fragile economy and the central bank’s multi-billion yen stimulus, the currency has continued to offer certain protection to investors – either because of valuation, its safe-haven status, or because of the diversification that it offers to US and European investors. As seen in the chart, the currency has low correlation to not only risk assets, but also a negative correlation to the Bloomberg Barclays Global Aggregate Index, the bellwether of fixed income markets. This year, for instance, the yen strengthened against the US dollar from mid-July to mid-August, during the peak of the Argentinean and Turkish turmoil that hit EMs and credit markets.
All in all, there are few presents from Santa this Christmas after some major repricing across asset classes, which could turn into opportunities for value-seeking, long-term investors in 2019. Until then, our best wishes to our readers for this Christmas and the New Year – may it bring you positive surprises, of the kind not tracked by any index.
1: Home ownership and wage growth – a new vision
Historically, the relationship between wage inflation and unemployment has been strong and is famously revealed in the Philips curve. However, this relationship has broken down over the past decade, causing much head-scratching among economists and central bankers: in the US, wages have failed to significantly rise despite a five-decade low unemployment rate and strong economic growth; in Britain, the present 4.1% unemployment rate is at the lowest since Brian Clough became Nottingham Forest manager in 1975 – yet, annualised consumer inflation has dropped this year from 3% to the present 2.4%. To cast some light on this puzzling question, former Bank of England MPC member and Dartmouth College professor Danny Blanchflower and colleague David Bell have come out with a different view.

According to the two academics, it is not unemployment what really has been driving wage growth since the GFC, but underemployment – or the willingness of current workers to increase their working time without getting more money.
Why are people willing to work more for free? Some attribute this to the decline of unionism and globalisation, but these trends have been going on for some time. A more probable and recent reason, the academics argue, is home ownership rates, which started declining in 2004 at a rate that only accelerated with the outbreak of the GFC in 2007. Renting a home, instead of owning it, seems to reduce workers’ bargaining power as they feel more unstable and hence, insecure. Tough news for workers as in the US, the home ownership rate has plunged to 63.9%, down from 69% in 2004; in Britain, it stands at 63.4%, down from an all-time high of 73.3% in 2007.
2: Tobacco: up in smoke
If markets are supposed to be mirrors of societies, the bond universe is certainly reflecting the world’s and the new generation’s increasing value for health. “Peak smoking” in the US was in the 1960s, when an adult smoked an average of over 11 cigarettes per day. That has fallen to 4 and continues to decline. Tobacco firms have been hit for years as falling consumption and tougher regulation hit sales and margins, but this year they are also facing new pressure from authorities keen to ban some of their most popular flavours. As bond investors embracing Environmental, Social and Governance (ESG) criteria, we also have seen increased interest from clients in excluding tobacco bonds from portfolios. Could these hard exclusions of cigarette companies be about to become mainstream for bond investors?
The value of investments will fluctuate, which will cause prices to fall as well as rise and you may not get back the original amount you invested. Past performance is not a guide to future performance.


18 years of comment
Discover historical blogs from our extensive archive with our Blast from the past feature. View the most popular blogs posted this month - 5, 10 or 15 years ago!


Bond Vigilantes
Get Bond Vigilantes updates straight to your inbox


