


Asset allocation: a new perspective with the ‘WOOLY curve’

When analysing long-term investments, the primary focus is naturally on the potential total returns. Your final profit is simply a function of the future actual returns of the investment, less the original cost.
In the realm of fixed interest bonds, this calculation is relatively straightforward. For instance, you can estimate the likely return using the redemption yield, as the coupon is set, and the redemption date and value are known. This predictability allows for a clear definition and a strong approximation of future profits.
However, in equities, this predictability is not attainable. Returns are a function of the dividend payments made by the company and the future performance of the business, both of which are uncertain. At the end of the period, there is no set redemption value; you remain invested, and to convert your investment back into actual cash, a sale has to be made. The final value remains at the vagaries of future market valuations.
So, what should you buy on any given day, bonds or equities? What should your weighting be? There is no definitive answer, particularly if focused on short-term investment horizons; however, some guidelines can help predict likely long-term outcomes. Equity returns, in particular, appear to become more predictable over extended periods, though this appears to be a function of the starting price paid.
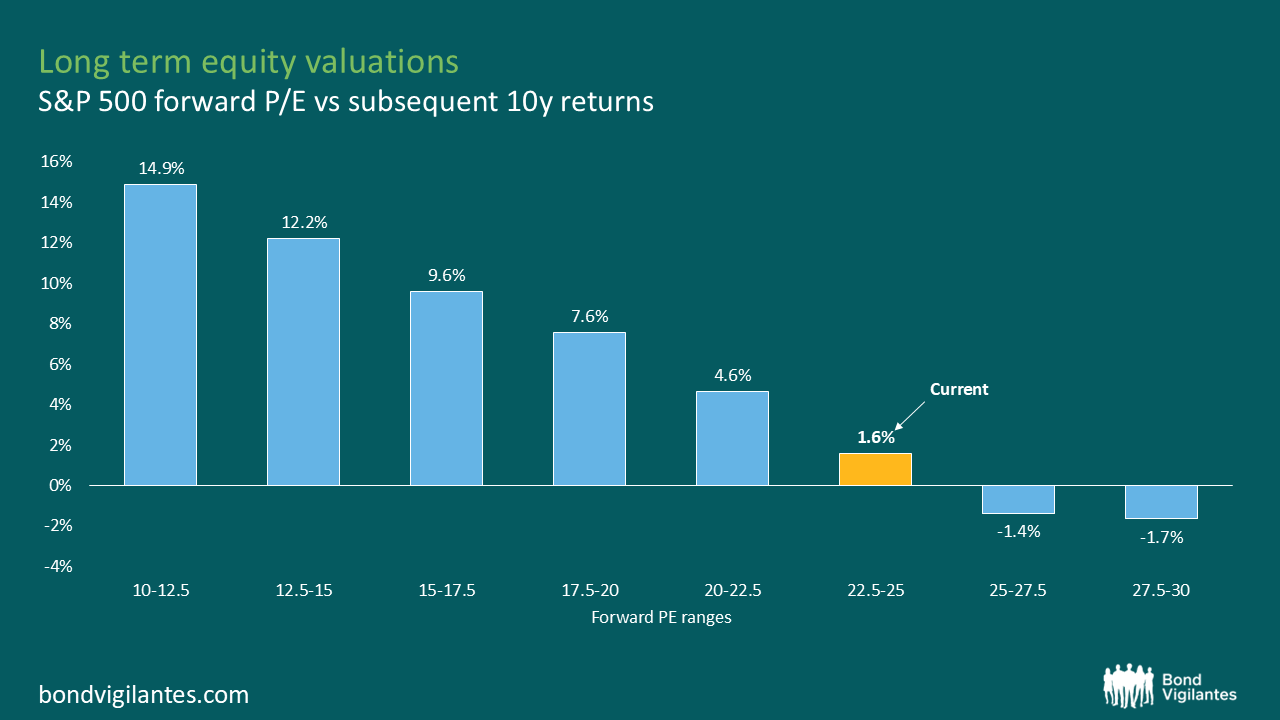
Source: M&G, Bloomberg, 31 December 2024. Past performance is not a guide to future performance.
The chart above shows the subsequent 10-year annualised returns on the S&P 500 based on the starting valuation, as measured using the forward P/E ratio. Unsurprisingly, given the total return is a combination of the starting price and investment outcome, we find that the initial valuation is a significant driver of the eventual outcome, similar to the total return aspect of bond yields. As the above chart depicts, historically, higher valuations have been associated with lower subsequent 10-year returns, and at current levels, forward returns have averaged just 1.6%.
Given the question we are trying to answer is whether investors should prefer equities over bonds, it is essential to consider equity valuations in the context of bond valuations. The chart below depicts the relationship between the S&P 500’s forward P/E ratio and 10-year US Treasury yields. Each dot represents a historical data point, showing the historic level of Treasury yields at different historical equity valuation levels, with the current P/E range shaded in white.
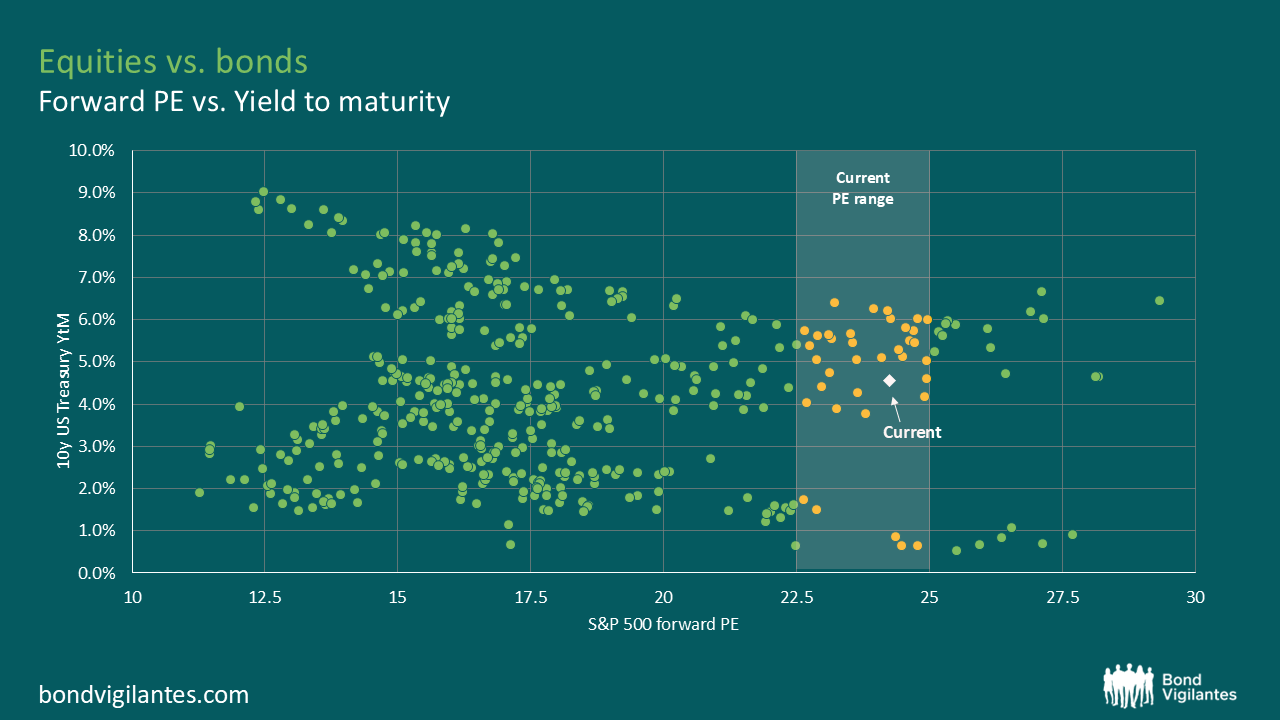
Source: M&G, Bloomberg, 31 December 2024.
The final step in our analysis is to combine the first two charts seen thus far, overlaying the treasury yields with historical equity returns. This helps define a break-even curve, a threshold where investors would have been indifferent between investing in equities or bonds based on historical returns.
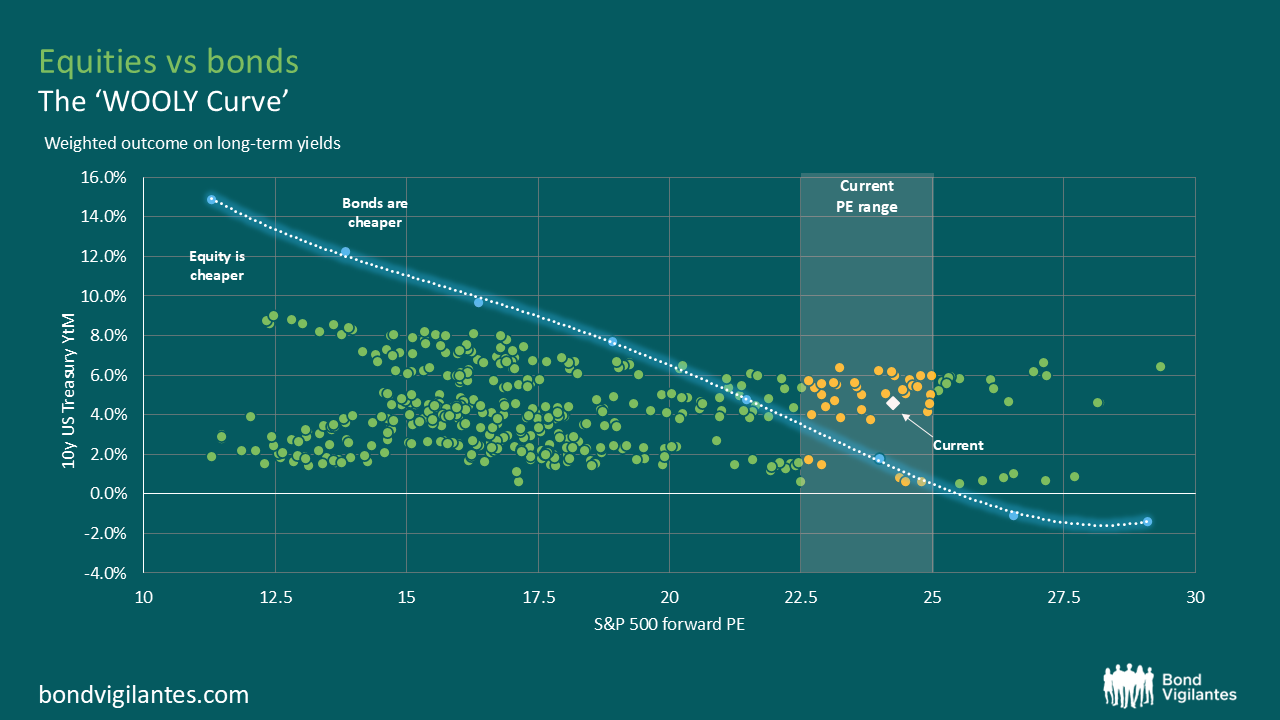
Source: M&G, Bloomberg, 31 December 2024.
This provides us with a historical plot indicating where equities were likely to provide a superior return to bonds and should have therefore been overweighted, and vice versa. Points to the left of the curve indicate periods when equities were cheaper, as their forward “expected” returns exceeded Treasury yields, and points to the right of the curve represent points where bonds were cheaper, delivering “expected” higher returns than equities. We could name this curve the ‘WOOLY curve’, based on the Weighted Outlook of Long-term Yields. This line indicates where, based on historic norms, one may be indifferent between equities and bonds.
This exercise explores historical starting points to determine potential asset allocation. As of the 1st of January 2025, it would depict that if we invested $10,000 in a bond on the 31st of December 2024 and held it for ten years, assuming it compounds at the redemption yield of 4.6%, the investment would grow to approximately $15,700. In contrast, using the historical data from the first chart, a $10,000 investment in the S&P 500 at year end valuations would have an “expected” return of 1.6% per annum, resulting in a final value of $11,700 over the same 10-year period. Essentially, based on this analysis, bonds are expected to outperform equities by approximately 40% over the next 10 years.
This is investing 101 as outlined by Benjamin Graham in the Intelligent Investor. Bond yields and equity yields are both income streams that are then discounted to create a present value, which gives us the equity risk premium. The two should be compared, and asset allocation decisions should be analysed accordingly. Warren Buffett has constantly noted, future returns are not random, but depend on your starting point.
The above charts do not suggest that 10-year US treasuries are cheap or that the S&P 500 is expensive. However, they do indicate a strong possibility that, from an investor’s perspective at current valuations, one is historically a better bet than the other. Starting yields have historically provided a potential guide to future investment returns and portfolio weightings.
I hope you agree that this is more than just Wooly thinking!
The value of investments will fluctuate, which will cause prices to fall as well as rise and you may not get back the original amount you invested. Past performance is not a guide to future performance.

