
Is the UK housing market on the brink?
The housing market is the transmission mechanism between Bank of England base rates and the UK consumer. The B of E cuts interest rates to encourage borrowing, which causes house prices to rise and homeowners’ pockets to swell. Higher interest rates slow the economy by restricting borrowing and suppressing the housing market. The state of the UK housing market is therefore one of the most important determinants of UK interest rates.
We have had another look at some of our favourite housing market charts, and while these suggest that the UK housing market is still fairly rosy, I believe that we are at a critical point.
The first two graphs below examine whether the UK housing market is overvalued. Graphs three and four look at two leading indicators that have proven to be very reliable at predicting the strength of the housing market half a year into the future.
1. UK house prices look expensive on a P/E measure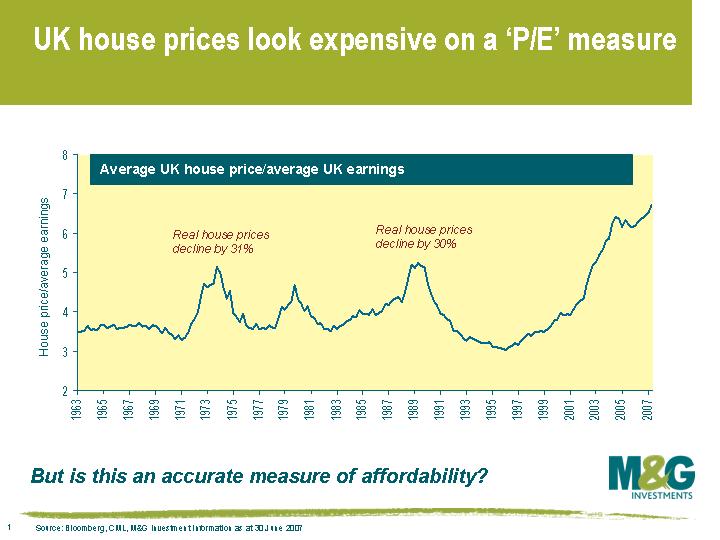 The housing market chart that people are most familiar with shows the average UK house price divided by average earnings, which is effectively a P/E ratio. There is no question that under this measure, UK house prices look the most expensive they’ve ever been. But is this an accurate measure of affordability? I believe it’s more important to look at how much Joe Public is spending on mortgage payments as a proportion of income, as that’s what determines whether people can afford to buy a house or not.
2. Mortgage payments still a relatively small portion of average earnings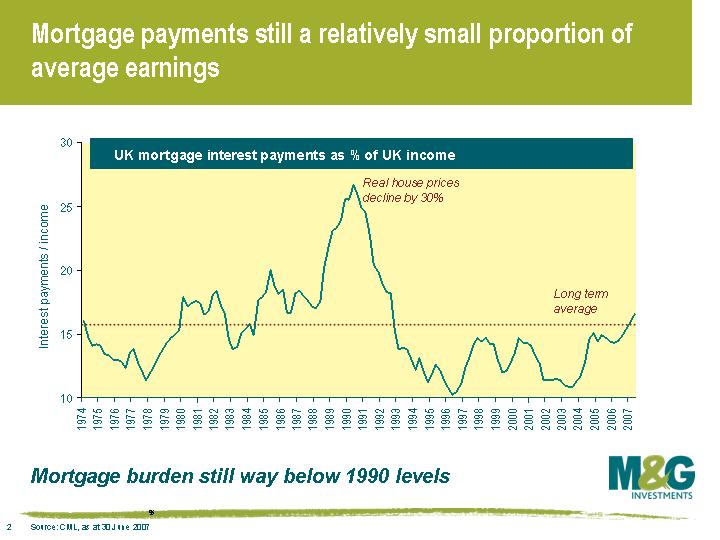 The mortgage burden isn’t that great at the moment. As at the end of June, mortgage payments formed 16.6% of average income (quarterly data). Monthly figures for the end of July have mortgage payments at 16.9%, the highest level since Q3 1992, but still not much above the long term average of 15.4% (figures go back to 1974). It’s easy to see what caused the last UK housing market crash – UK interest rates were increased to 15% in October 1989, and as a result, mortgage payments had soared to 26.7% of average income by Q2 1990.
3. Mortgage approvals suggest demand for houses will remain strong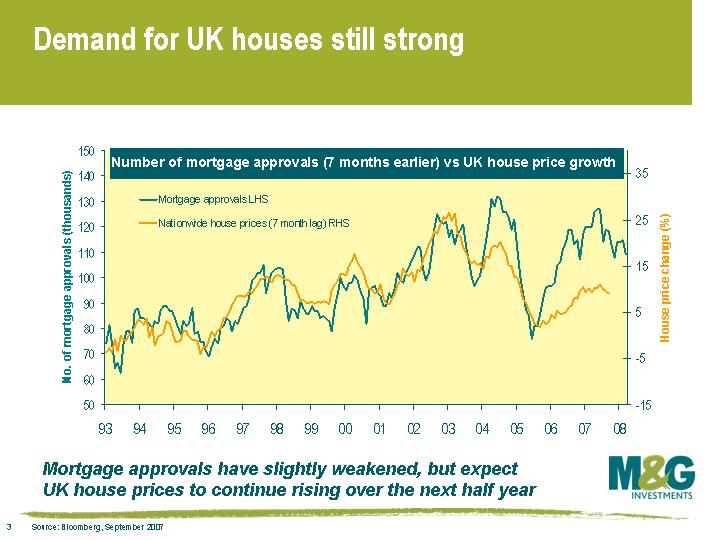 Lead indicators suggest that UK house prices will remain buoyant over at least the next half year. This chart shows the number of mortgage approvals taken out by individuals each month. The rationale for looking at mortgage approvals is that people who seek to take out a mortgage are almost certainly going to buy a house in the next few months. The lines have diverged a little since over the past 2-3 years, and we therefore look more at the direction of mortgage approvals rather than the absolute number in order to predict changes in UK house prices. Yesterday it was announced that the number of mortgage approvals fell to 109,000 in August (a four month low), but the drop was only slight.
4. Supply of houses is failing to meet demand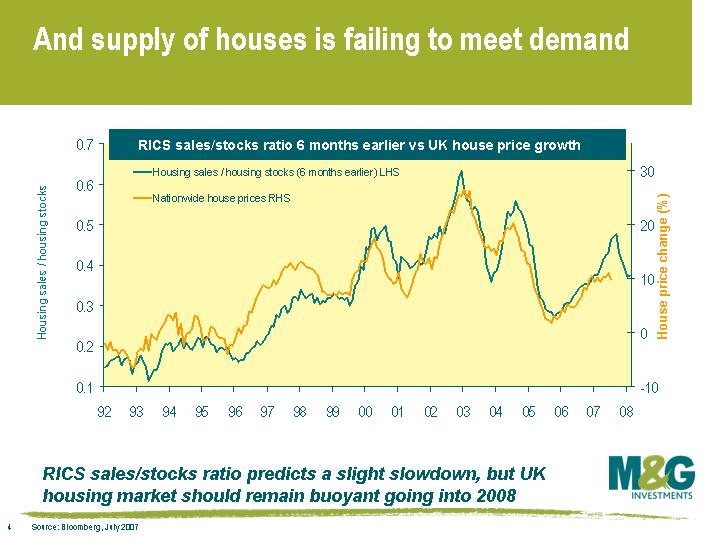 The RICS sales/stocks ratio is a very accurate indicator of future house price movements, as it encompasses both the demand and supply of houses. It is a measure of the number of sales that estate agents have made over a rolling 3 month period, divided by the total number of houses that estate agents are advertising for sale. So a high ratio indicates that a lot of houses that come onto the market are being sold straight away (demand exceeds supply), while a low ratio indicates there is a big overhang of houses on the market (excess supply). When the ratio is high, house prices have traditionally risen, and when the ratio is low, house prices have traditionally fallen. At the moment this indicator also suggests the housing market will be fairly buoyant going into 2008, although the rate of growth is likely to slow a little.
All in all, therefore, the available data suggests that there is little danger of collapse in the short term, but the story from the middle of next year could be very different.
The fallout from the credit crunch, the drying up of money markets and the Northern Rock debacle caused 3-month LIBOR (the rate that banks lend to each other) to rise to 6.9% at the beginning of September. This rate has since fallen back to 6.3%, but it’s still way above the 5.75% target rate set by the B of E. In reality therefore, banks have experienced a sudden jump in interest rates, and this will inevitably be passed onto the consumer in the form of higher mortgage rates.
Just how much mortgage rates will jump remains to be seen, but if there is a sudden move, this should be picked up in the two lead indicators mentioned above. A rise in mortgage rates will result in the number of mortgage approvals falling sharply, and the RICS sales/stocks ratio would start to decline. Any sign of this occurring will result in me taking a much more bearish view on the UK housing market.
The value of investments will fluctuate, which will cause prices to fall as well as rise and you may not get back the original amount you invested. Past performance is not a guide to future performance.
19 years of comment
Discover historical blogs from our extensive archive with our Blast from the past feature. View the most popular blogs posted this month - 5, 10 or 15 years ago!


Bond Vigilantes
Get Bond Vigilantes updates straight to your inbox