
Full steam ahead for the gilt market
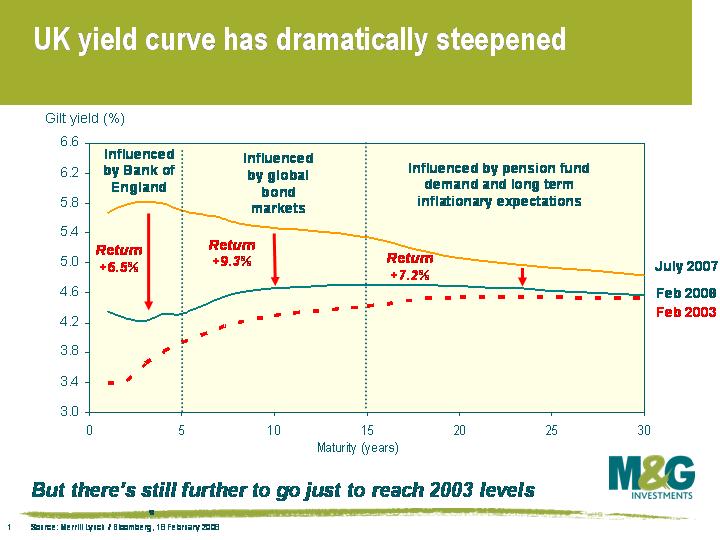 This chart shows how the UK yield curve has steepened dramatically since July 2007. Note that short dated yields have plummeted the most, which has been driven by a rapid change in UK interest rate expectations (in June 2007, Bank of England base rates were 5.75% and were expected to rise to at least 6% – by December, rates were 5.5% and were expected to fall to 4.75%). Note also that while 2 year gilts have experienced the biggest drop in yields, the best returns have actually come from medium dated gilts – this is because shorter dated bonds are much shorter duration, and short dated gilt prices are therefore a lot less sensitive to changes in yields.
To what depths can gilt yields go? Well the dashed red line in the chart shows where the UK yield curve was in February 2003, and the UK economy of February 2003 looks shipshape compared to the mess we’re in now. In Q1 2003, UK economic growth was 2.5% YoY, UK house prices had risen 25% YoY, and unemployment was slightly below its current level. The global economy was about to ride the wave created by US interest rates standing at 1.25% (Alan Greenspan’s final rate cut actually wasn’t until June 2003).
The UK economy of 2008 is rudderless and adrift – growth will do very well to exceed 2%, the housing market is about to capsize, and unemployment is likely to rise. The global economy is in the process of getting sucked into the whirlpool that is the US housing market. UK inflation is a slight headwind now (2.2% versus 1.7% in Feb 2003), and higher food and energy prices might push inflation higher over the coming months, but UK inflationary pressure should fall towards the end of this year as UK growth slows and spare capacity is created.
The gilt market has backed up a bit so far this year, and is now ‘only’ pricing in three 0.25% interest rate cuts in 2021/12. We think that rates are likely to fall by more than the market is pricing in. A worsening of the economic storm should see yields fall across the curve, and M&G’s bond funds are positioned long duration as a result.
The value of investments will fluctuate, which will cause prices to fall as well as rise and you may not get back the original amount you invested. Past performance is not a guide to future performance.
19 years of comment
Discover historical blogs from our extensive archive with our Blast from the past feature. View the most popular blogs posted this month - 5, 10 or 15 years ago!


Bond Vigilantes
Get Bond Vigilantes updates straight to your inbox