
The 2008 Great Crash – an historical perspective
It’s always very hard trying to get a sense of historical perspective, particularly when you’re living through something that will be discussed and debated long after we’re all gone. I think this chart helps. It shows the S&P going back to January 1928, and I’ve used a logarithmic scale so that you can get an idea of how this crash compares to those that occurred in previous eras.
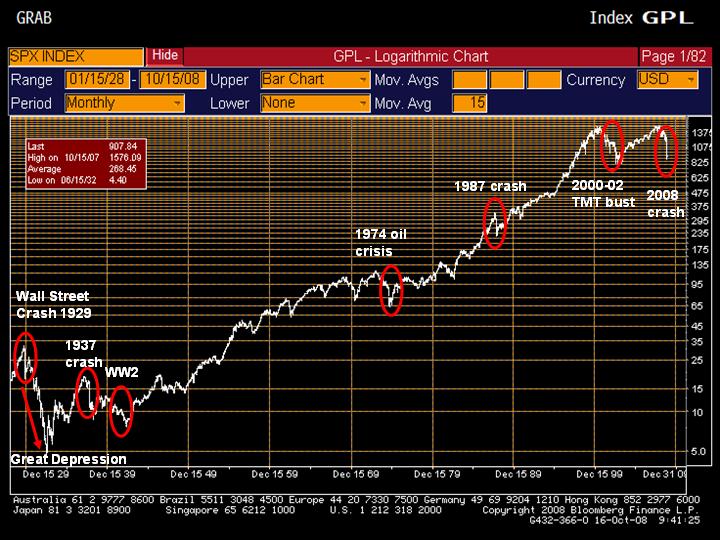 The 30% fall in the S&P since the end of August is considerably worse than the 1987 crash. It’s as big as the Wall Street Crash that took place over the month of October 1929 (although there’s a long way to go to match the horrendous bear market that accompanied the Great Depression in 1930-32).
The value of investments will fluctuate, which will cause prices to fall as well as rise and you may not get back the original amount you invested. Past performance is not a guide to future performance.
18 years of comment
Discover historical blogs from our extensive archive with our Blast from the past feature. View the most popular blogs posted this month - 5, 10 or 15 years ago!


Bond Vigilantes
Get Bond Vigilantes updates straight to your inbox