


Mr Bean, QE and US house prices
Mr Bean doesn’t say much publicly, so the bond market spent last week pouncing on every utterance of his UK tour (usually without much regard for the context in which things were said) in an effort to answer the key question of whether or not the Bank of England would continue its program of Quantitative Easing.
Yesterday morning we got a few more clues after the minutes of the last Monetary Policy Committee meeting were released. As could be seen from the gilt market’s reaction (10 year gilt yields at one point almost reached 3.9%, the highest for a month), the interpretation wasn’t too gilt-friendly. Some of the key messages in the MPC minutes were that although monetary data is not providing a precise guide to the success of QE, broad money growth has picked up sharply. Inflation has been surprisingly high over a number of months. Labour markets are weak and wage growth is expected to weaken further, but employment had come in higher and unemployment lower than expected. The more forward-looking surveys suggest growth and inflation (in the short term) may be higher than previously expected. So possibly it is actually the beginning of the end of QE, rather than the end of the beginning.
Another important point in the minutes was the reminder that “one risk to the economic recovery in the US and possibly the world was the US housing market”. That’s because house prices affect people’s collateral, thus affecting their ability to borrow. House prices affect banks’ assets (and therefore also affect the banks’ ability to lend), And house prices affect the amount of residential investment.
We’ve recognised the importance of the US housing market, and have written extensively about the health of the market on this blog. It was the fall in US house prices that began in the second half of 2006 that sparked the chain reaction leading to this financial crisis. Presumably, it will be a recovery in house prices that will help to bring us out of this financial crisis (and we’re definitely still in one, as CIT’s woes demonstrate).
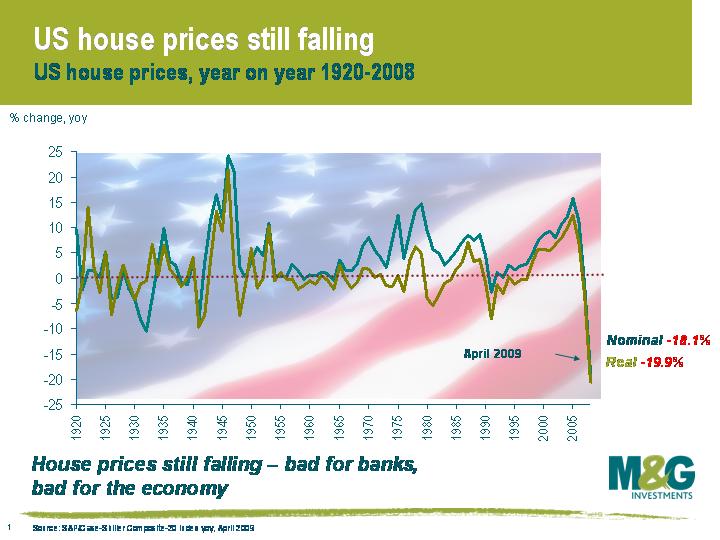
US house prices are sharply lower than a year ago, as this chart shows. According to the S&P/Case-Shiller indices, house prices fell 18.1% in the year to April (May’s numbers come out next week), albeit the pace of decline seems to be slowing, with April 2009 seeing the smallest fall since June 2008. House price data from two other sources, the National Association of Realtors and the Federal Housing Finance Agency, had US house prices rising in May.
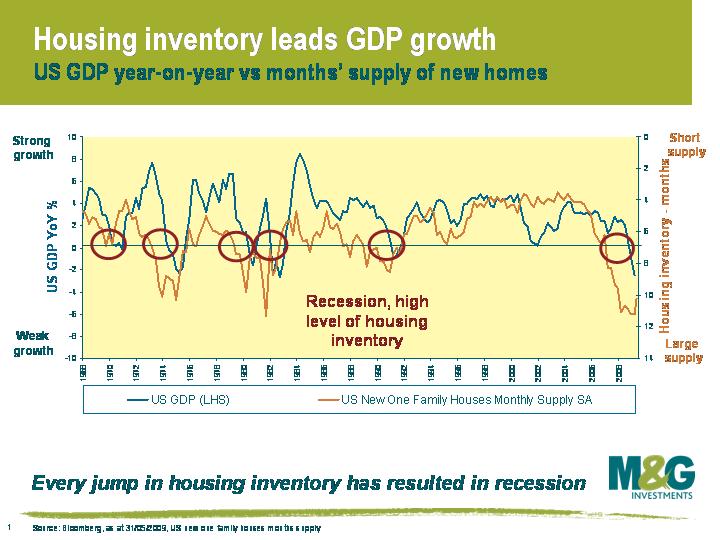
However it’s difficult to see a sustained rise in US house prices, or indeed a buoyant economy, until the overhang of unsold stock on the housing market (or ‘inventory’) begins to clear. A good measure of the inventory overhang is ‘months supply’ , which says how long it will take to clear the supply overhang at the current level of demand. The measure is a good predictor of US recessions (see blog from Feb 2008 here) and isn’t a bad predictor of growth either. Inventory levels have improved in recent months, but at 10.2 months supply, there is still a significant inventory overhang. This has much to do with delinquencies (now 25% for subprime, or 9.1% in total, which is the highest since records began in 1979), unemployment (already highest since 1983 and still rising) and rising repossessions. History suggests that months supply will need to fall to about 7 months supply before we see a sustained recovery in both the economy and the housing market.
The value of investments will fluctuate, which will cause prices to fall as well as rise and you may not get back the original amount you invested. Past performance is not a guide to future performance.
19 years of comment
Discover historical blogs from our extensive archive with our Blast from the past feature. View the most popular blogs posted this month - 5, 10 or 15 years ago!


Bond Vigilantes
Get Bond Vigilantes updates straight to your inbox