UK inflation shocking?
UK CPI inflation jumped from 4.0% to 4.5%, versus expectations of only a slight increase to 4.1%. Core CPI, which strips out food and energy prices, soared from 3.2% to 3.7% and is now at easily a record high (data goes back to 1997). One bank called the inflation numbers shocking, arguing other economies aren’t seeing anything like this surge in core inflation, UK monetary policy is too loose and the MPC should hike rates in August.
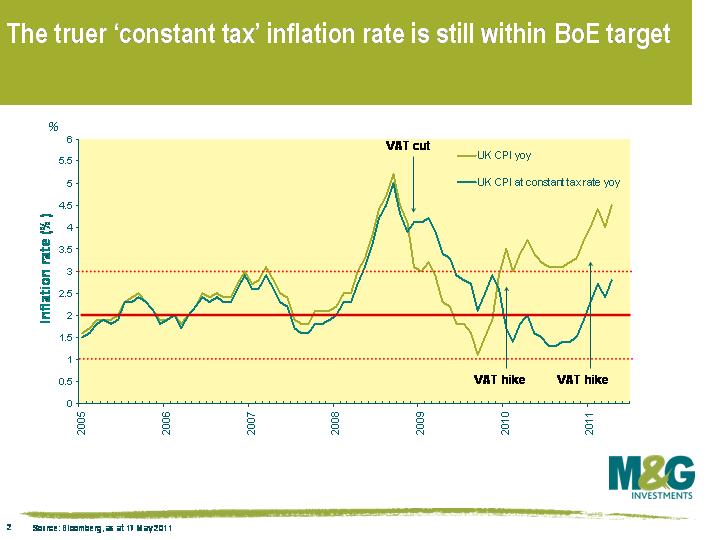
The first thing to point out, as previously discussed on this blog (see here), is that the CPI figures include the VAT increase to 20% in January. The VAT increase is presumably temporary unless there’s another hike next year, and will therefore fall out of the inflation numbers early next year (it’s difficult to say exactly when as it depends on the timing and extent of the VAT passthrough from retailers to consumers). This chart gives a truer ‘long term’ picture of UK inflation by stripping out this tax effect, and as you can see, 2.8% is still within the Bank of England’s target (albeit energy and food price increases over the past year have pulled it uncomfortably close to 3%). Note that the headline CPI number came in temporarily lower than the constant tax measure through 2009 following the VAT cut in January of that year, but the last two years have seen the headline CPI inflation number look temporarily high.
The second thing to point out is that even if inflation does continue rising through this year (and maybe unexpectedly fails to fall next year), will the Bank of England really hike rates? Well the market seems to think so, as it’s still pricing in two 0.25% rate hikes in the UK by this time next year, with the first hike coming in November.
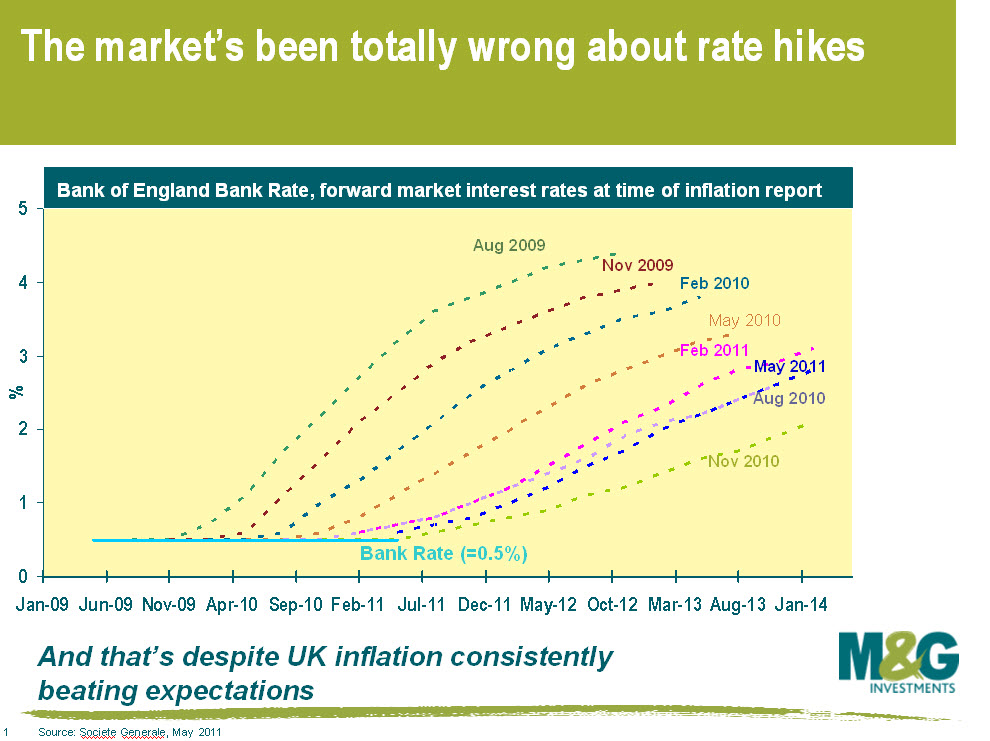
However this chart shows just how badly wrong the market has got its UK interest rate forecasts. Each dotted line shows the market’s expectations of the future course of the Bank of England base rate at the time of each quarterly inflation report going back to August 2009. In August 2009, the market was pricing in a Bank of England Bank Rate for May 2011 of 3.25%. Instead, the Bank Rate has remained firmly stuck at 0.5%. It’s all the more surprising if you consider that UK inflation has consistently exceeded market expectations at the time of release, so if inflation is the primary driver of the Bank Rate, you’d have expected to see the market underestimate the Bank Rate over this period.
Why has the market been so wrong? The answer is all about growth – investors have placed too much emphasis on inflation in their Bank Rate forecasts. The UK economy is no bigger than it was six months ago. UK consumption has flatlined. With such a vulnerable consumer, housing market, and banking sector, we can’t risk higher rates. With that in mind, it’s not a bad idea to have a fresh look at the second part of the opening paragraph in the Bank of England’s quarterly Inflation Report;
‘In order to maintain price stability, the Government has set the Bank’s Monetary Policy Committee (MPC) a target for the annual inflation rate of the Consumer Prices Index of 2%.Subject to that, the MPC is also required to support the Government’s objective of maintaining high and stable growth and employment.’
The value of investments will fluctuate, which will cause prices to fall as well as rise and you may not get back the original amount you invested. Past performance is not a guide to future performance.


18 years of comment
Discover historical blogs from our extensive archive with our Blast from the past feature. View the most popular blogs posted this month - 5, 10 or 15 years ago!


Bond Vigilantes
Get Bond Vigilantes updates straight to your inbox


