US income inequalities: Buffett rules
In August last year, I picked up on Warren Buffett’s call for a higher burden share for America’s rich in a New York Times Op-Ed and alluded to the heated debate around income taxation and wealth distribution. Since then the US Senate has seen the Democrats proposing and the Republicans opposing the ‘Fair Share tax’, also called ‘Buffett rule’, which would require those with incomes over $1m to pay an income tax rate of at least 30 per cent. Alongside the political debate, academic research has informed and polarised the public debate before and after. For instance, Nobel laureate Peter Diamond and Emmanuel Saez have estimated that the income tax rates for the wealthy should be between 45 and 70 per cent.
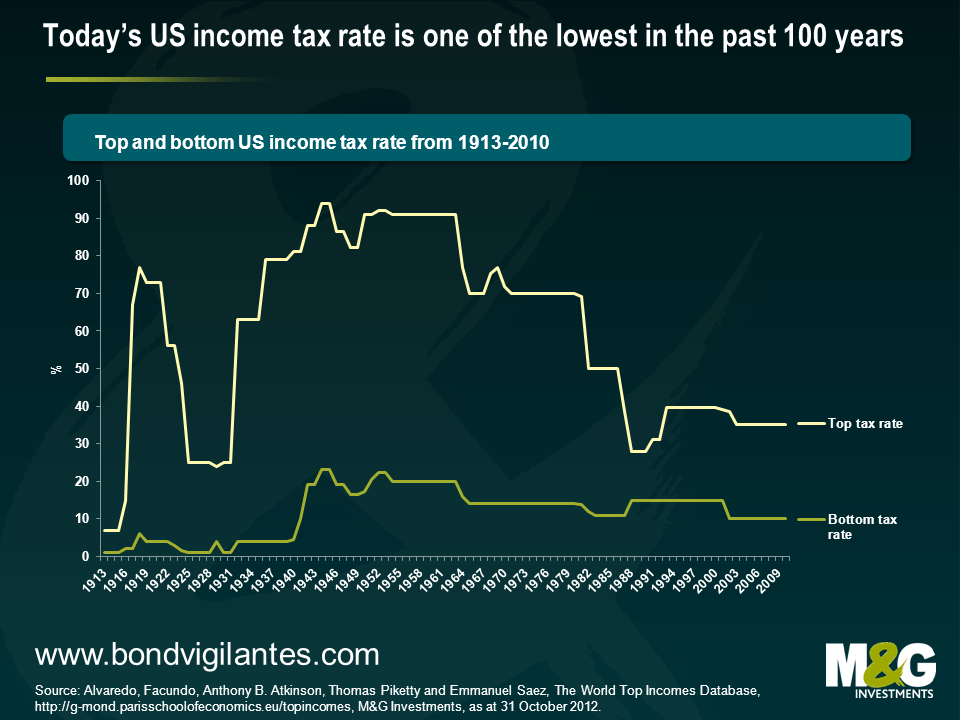
Being misguided by today’s environment, the intuitive reflex is to say that a country like the US could never have – or accept – such high income tax rates. High income tax rates are rather perceived to be a European predicament, associated with these countries’ welfare state systems. A look at the historical US income tax bands reveals though that this is actually a clear misperception – and the elder amongst us will even remember these days. US top income tax rates have historically been significantly higher than the last 25 years suggest, although it’s fair to say that they peaked at war-related time periods. The top tax rate didn’t concern a large share of the tax payers back then, but it wouldn’t do so today either.
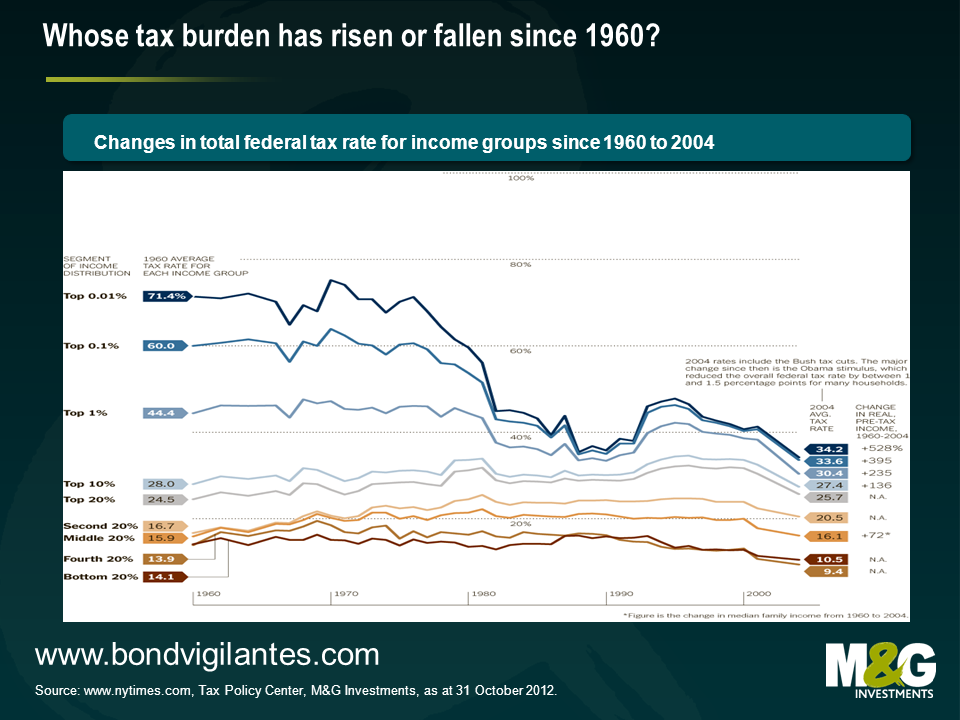
Admittedly, purely looking at these top and bottom income tax rate bands doesn’t tell you enough about the tax burden that the poor, the rich and the middle class had to bear in the US over this period. So let’s have a look at the chart below. This tells us that over the 44 years from 1960 to 2004, so after the implementation of the Bush era taxes, the average tax rate has actually modestly fallen for the 40% with the lowest income. The lower middle income class has seen a slight increase in their tax burden over the same period. Those who can be described as upper middle income class had seen a rise in their income tax levels throughout the 1990s which were reverted in the Bush era. Most strikingly though, the top 1% income group has seen a sharp decline of its tax burden since the 1960s, initially peaking in the early 1970s and falling subsequently to its lowest historical level in the Bush era.
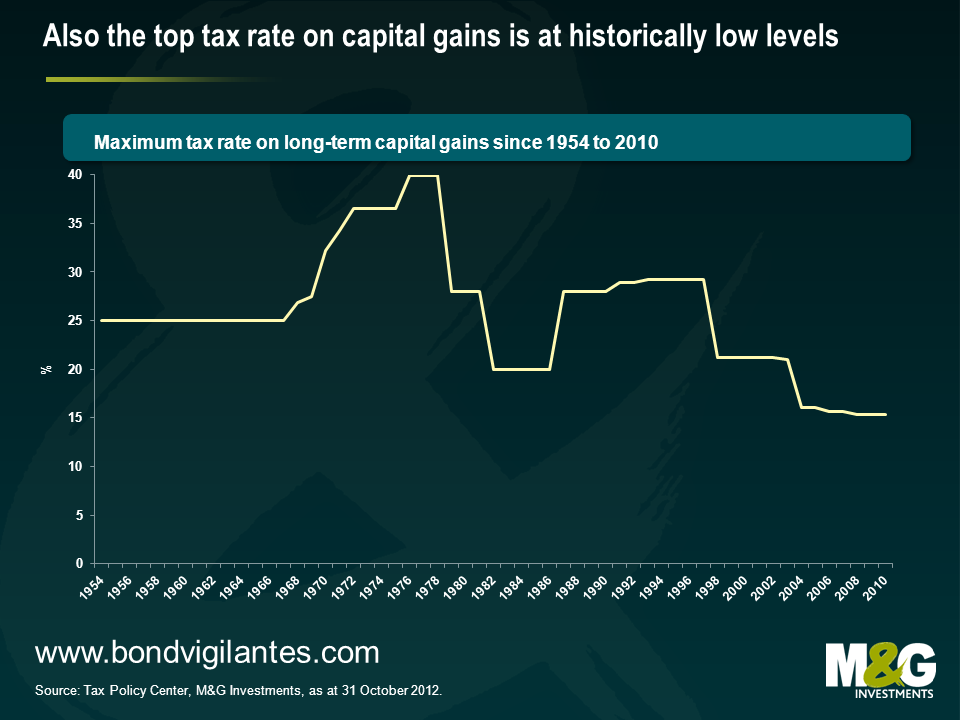
Now with a look at Buffett’s opinion piece, you could point out that he’s not only been referring to the low income tax burden, but that he and many of his peers make a lot of their money – different to those belonging to the lower and middle income class – from capital investments. Therefore, it’s important to have a look at the historical development of the maximum tax rate on capital gains as well. Supporting Buffett’s assessment, the chart below demonstrates that the current tax rate level for capital gains is the lowest in the past 50 years.
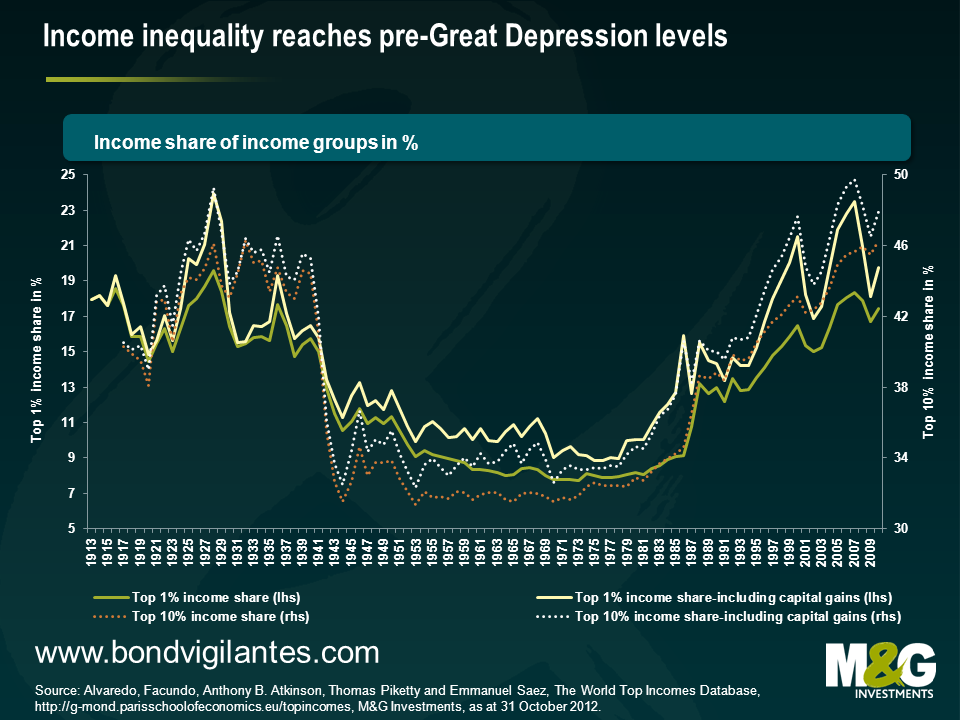
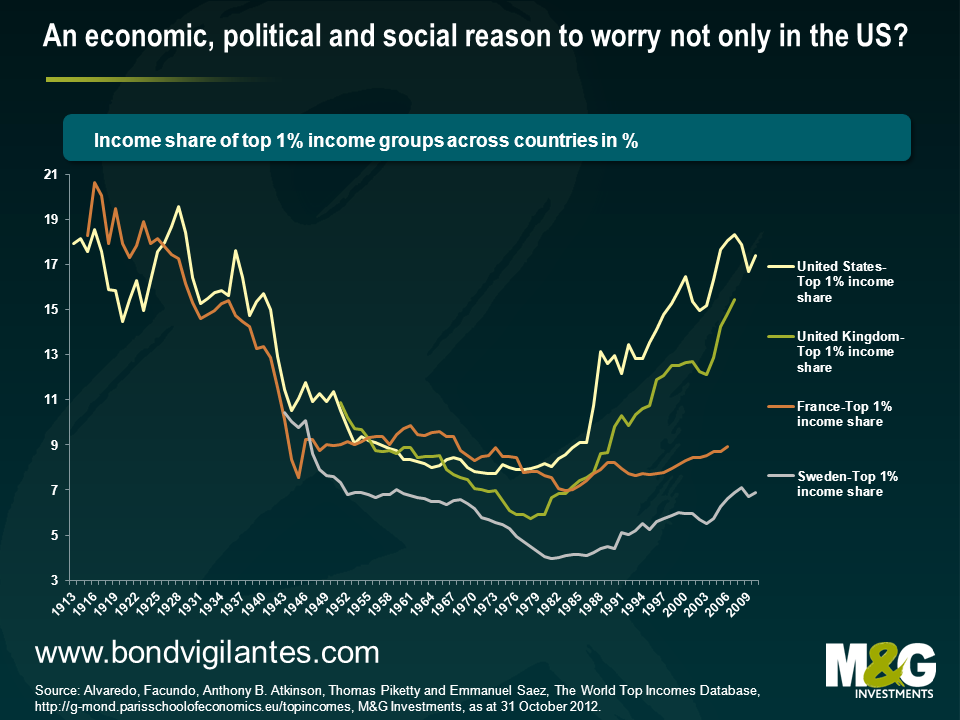
So let’s put all this into perspective. The previous charts suggest that the “mega-rich”, as Buffett has previously described himself and his peers, as well as the ordinary wealthy currently face one of the lowest income and capital gain tax burden since these figures have been reliably recorded. At the same time, their share of the total income has doubled since the 1980s. While income inequality fell after World War II until the 1970s, the so-called ‘Great Compression’, this trend took a u-turn in the following decades. Today Warren Buffett and his peers, represented by the top 1% income category, earn around 20% of total income.
But is this exclusively an American phenomenon? It is not, but the magnitude of this development seems to be particularly high in the United States. I’ve picked three more countries to demonstrate this. One of these, the UK, follows a similar economic and social model as the US, whereas Sweden and France represent the European welfare state model. While the UK has seen a comparable increase in the income share of the top 1%, this development in France and Sweden has been rather modest, and is only at around the long-run average. It’s particularly interesting to think about the below chart in the socio-economic context. Instantly, the recent talks about the feasibility of tax hikes for higher incomes in the UK come back to mind. At the same time, Hollande’s unpopular demand for higher income taxes for the rich, and their potential effect on government revenue, might have been put into a less favourable perspective by this chart.
What do I make of all of this? First of all, it doesn’t look like a healthy development for a society when the gap between poor and rich widens disproportionately. In the US, the income share of the wealthiest part of the society has reached close to all-time record levels. The financial crisis didn’t revert the trend seen since the 1980s, it was only briefly interrupted. Inequality is currently at the highest level since the Great Depression. It might be even more reasonable to be worried about such a development since there isn’t a proportionate burden share, as the evolution of the tax burden across income classes in the US suggests. Ultimately, this might have contributed to what appears to be a much divided society these days. That’s a development that doesn’t sound too unfamiliar to me in the UK. It might also partly explain today’s toxic political climate in the US where parties and individuals have become strong lobbyists for rather limited parts of the society. It seems to be clear that a situation in which tax burden and income distribution are historically rather exceptional, but have been taken as the new norm by one side at the negotiation table is difficult to resolve. The argument that it might only be a correction of a previous exaggeration is then easily overheard. And there’s an economic side to it. The IMF actually concludes in a paper that fighting income inequality and fuelling growth might be two sides of the same coin in the long run. Therefore, Warren Buffett rules. He’s given this debate visibility. And I believe that he’s got a fair point. Surely, the higher taxation of the highest incomes will not make a fundamental difference to the US government revenues in the short term. But it certainly helps to create the feeling of a shared burden across society and to revive the inspirational thought of unity. Apart from this rather philosophical note, it might also have implications for the bipartisan negotiations around the fiscal cliff. When I look at the expiring Bush era taxes that will be brought to the negotiation table, then I may conclude that all this public debate – and the factual evidence presented – make it more likely that both sides can ultimately agree on the expiry of the Bush era tax cuts for the wealthy rather than those for the middle incomes. That would be a sensible thing to do
The value of investments will fluctuate, which will cause prices to fall as well as rise and you may not get back the original amount you invested. Past performance is not a guide to future performance.


18 years of comment
Discover historical blogs from our extensive archive with our Blast from the past feature. View the most popular blogs posted this month - 5, 10 or 15 years ago!


Bond Vigilantes
Get Bond Vigilantes updates straight to your inbox


