Why we love the US dollar, and worry about EM currencies
The US dollar has been one of the worst performing currencies in the world in the last decade, but we think it is ripe for a rally. We expect the US dollar’s correlation with risky assets to steadily change (in fact this is already happening). We believe that the US monetary policy transmission mechanism is actually working fine. We are bullish on US growth, particularly in relation to other regions. The Federal Reserve appears behind the curve, but a number of policy makers are increasingly realising this. And following a prolonged period of big underperformance, the US dollar is looking fundamentally cheap, especially in relation to some emerging market currencies.
The main push back we hear regarding our bullish US dollar view is that by being long US dollar you’re basically being short of risky assets. Lately this has been true; the US dollar has tended to rally sharply when large banks are blowing up or the Eurozone is threatening to fall apart, and has tended to perform poorly when everything looks alright again.
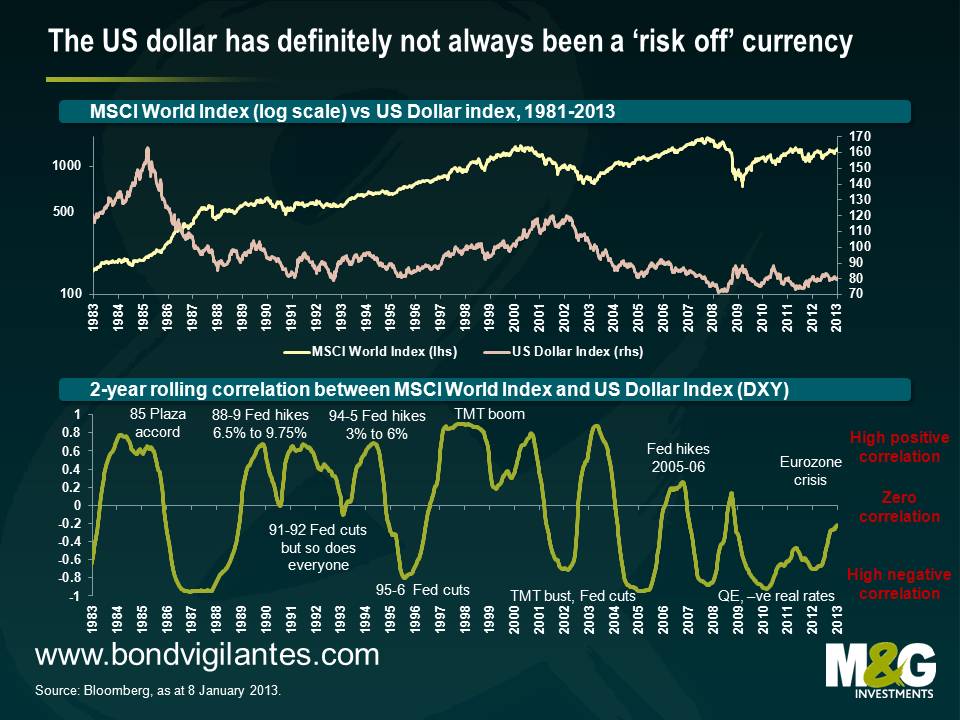
However the US dollar has not always had this risk on/risk off (“RoRo”) characteristic. The first chart below plots the US Dollar Index (a general international value of the US Dollar) against the MSCI World equity index, and the chart immediately following shows the rolling two year correlation of the two indices with some rough annotations (usual causation/correlation disclaimer applies).
It’s noticeable that the RoRo qualities of the US Dollar have weakened in the last two years, presumably on the back of a broader risk rally at a time when investors and central banks have been dumping/diversifying away from euro denominated assets. Going further back, it’s also apparent that the US dollar has not always been a ‘risk off currency’, where a major factor appears to be Fed Funds rate cycles.
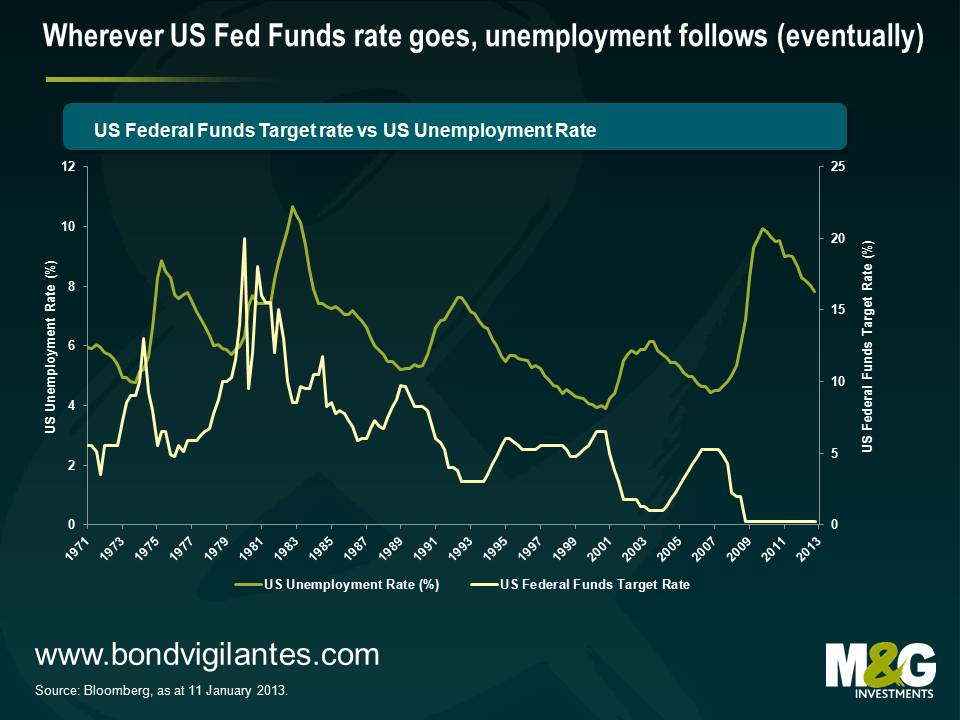
On the point of Fed Funds rate cycles, we think that the Federal Reserve continues to be behind the curve, or following the Federal Reserve’s change in communication, it’s perhaps more accurate to say that the market is behind the curve. We spent much of last year discussing how the US housing market was starting to take off (eg see here), which is evidence that the monetary policy transmission mechanism is no longer broken. But it’s interesting to consider the chart below – wherever the Fed Funds rate has gone in the last four decades, unemployment eventually follows. The shock to the US economy in 2008 was obviously huge, but this cycle doesn’t actually look that different to previous ones.
The current trajectory suggests that the US unemployment rate could hit 6.5% sometime in the middle of next year, an eventuality that would surely see US Treasuries sell off violently. There are eerie echoes of 1994, when the Fed hiked rates from 3% in January 1994 to 6% in February 1995 with very little prior warning; investors were caught with their pants down and markets were given a jolly good spanking (the 10 year US Treasury yield had fallen to 5.2% in late 1993 but a year later peaked at 8%).
It’s likely that the US dollar would appreciate as US yields jumped if you assume that hikes in the Fed Funds rate won’t be replicated around the world. This seems a relatively safe assumption given the Japanese devaluation rhetoric and continuing mess in Europe (Eurozone unemployment recently hit a record high of 11.5%, while the UK is likely to have experienced negative growth in Q4). That said, the US dollar surprisingly depreciated versus the Japanese yen and a number of European currencies in 1994, prompting then Fed chairman Alan Greenspan to state that the US dollar was weaker than it should be – Greenspan’s wish was granted from 1995-2000 though, as the US dollar was supported by factors such as high relative real interest rates, a US productivity surge, EM crises and Japanese stagnation.
Another plus point for the US dollar is that the horrendous performance of the currency over the last decade has left the US economy looking competitive. Last February I wrote about how some manufacturers were moving operations from China to Mexico to take advantage of the dramatic increase in Mexico’s relative competitiveness (see here). I’ve since heard a number of anecdotes – admittedly the weakest form of evidence – about manufacturers also relocating back to the US.
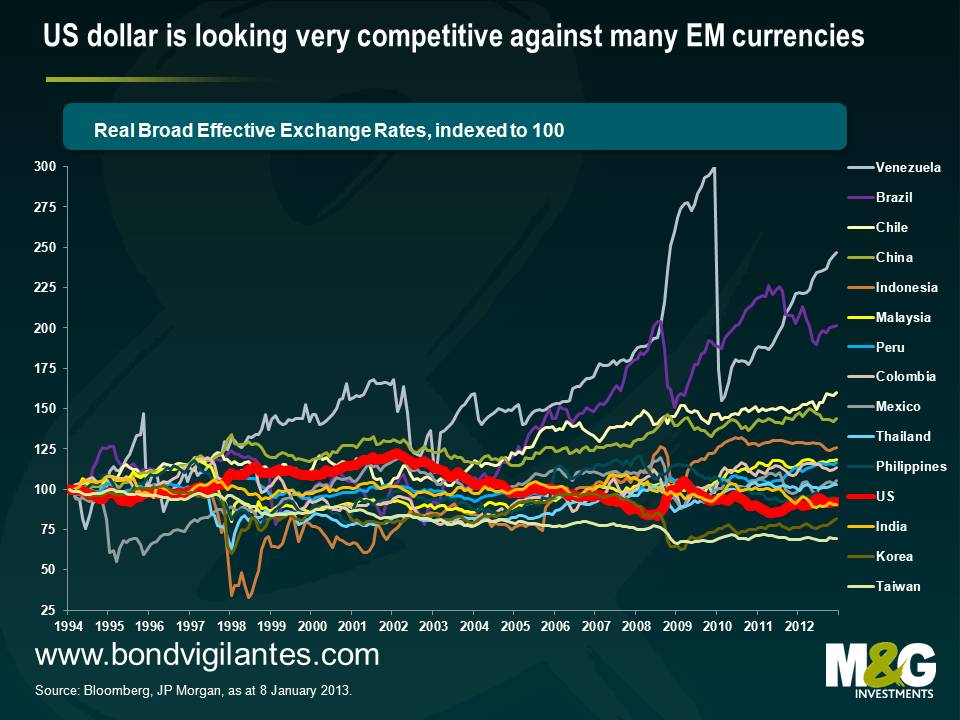
The conclusion from the chart below is that such behaviour makes a lot of sense. It shows the relative performance of real effective exchange rates, which is a measure of a country’s trade weighted exchange rate adjusted for inflation. Real effective exchange rate measurement is imprecise since inflation data can be unreliable (eg Argentina) and calculations can vary depending upon the particular measure of inflation used (eg CPI, PPI, export price indices, core inflation, unit labour costs). The starting point can also make a lot of difference when using a time series – I’ve chosen 1994, which is immediately after China’s 50% devaluation*, but before the Latin American and Asian financial crises.
But while the absolute level of some of the exchange rates in the chart below need to be treated with a pinch of salt, the direction of travel should give a relatively unbiased view. The US dollar (thick red line) is looking very competitive versus the majority of emerging market currencies.
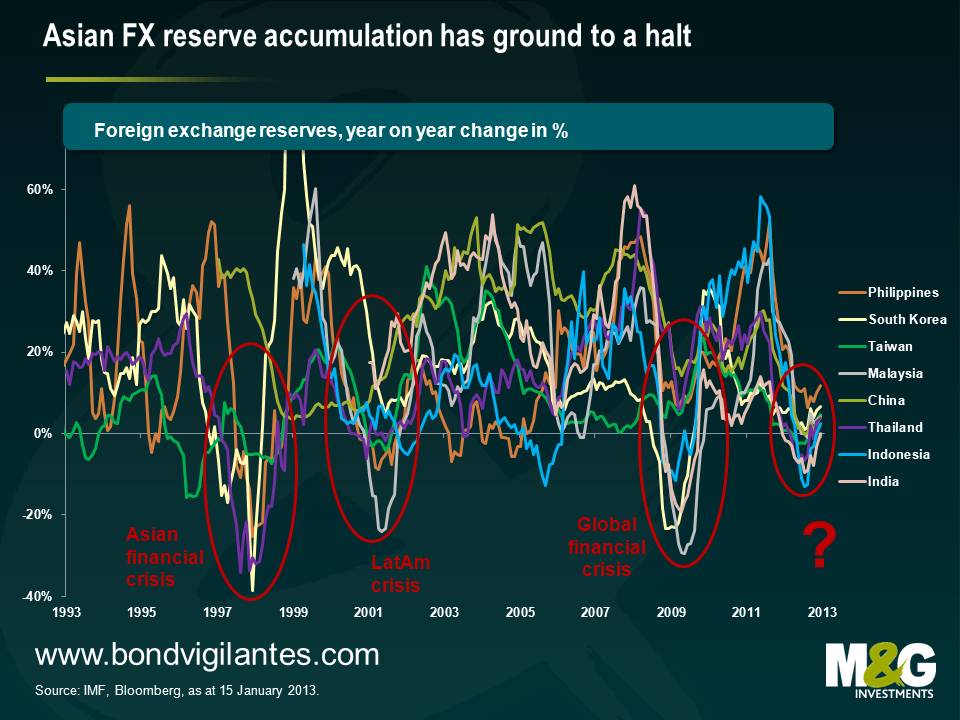
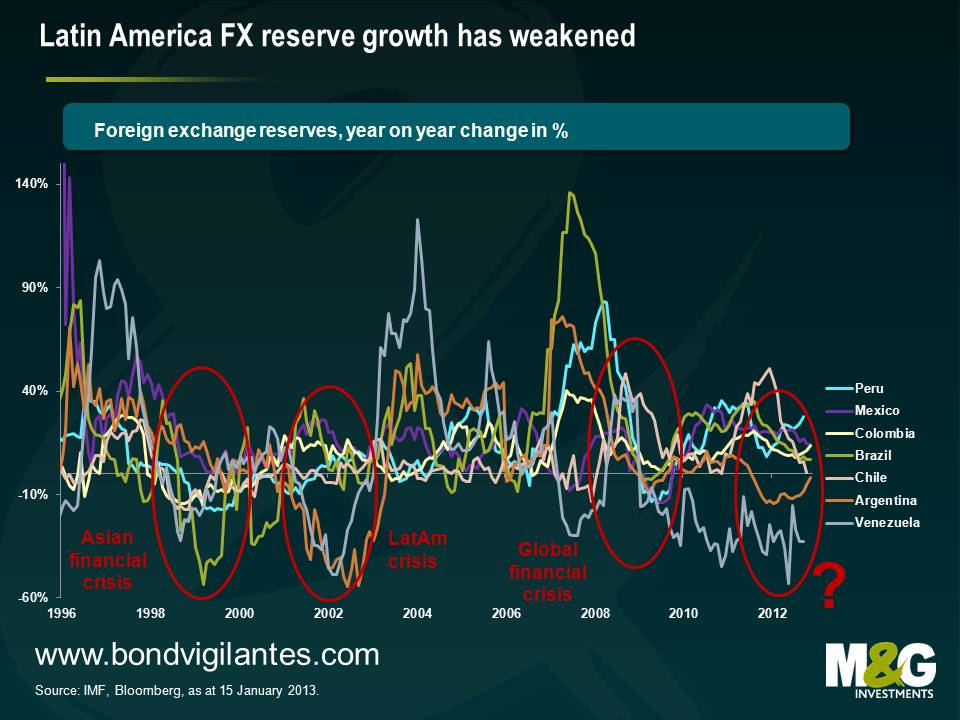
Meanwhile a surprising – and worrying – aspect of the last year has been that emerging market FX reserve growth appears to have stalled. Part of this can be explained by weaker global demand resulting in weaker EM exports. Part of this can be explained by EM countries gradually rebalancing their growth models away from exports and towards domestic consumption, the result of which means a narrowing of the global current account imbalances.
However, lower FX reserve growth is not at all consistent with EM countries continuing to receive large Foreign Domestic Investment (FDI) and record portfolio inflows – you’d expect to see reserves jump. And neither is lower FX reserve growth consistent with the US dollar’s performance over the past year – a slowdown in FX reserve accumulation is typically synonymous with US dollar strength because FX reserves are typically measured in US dollars, and non-US dollar denominated assets would fall in value when measured in US dollar terms. Yet the US dollar has been broadly flat and if anything weaker over this period.
It is a very dangerous combination to have flat or falling export growth (see previous blog) combined with flat or falling FX reserve growth combined with a significant appreciation in real effective exchange rates. In a study of prior academic literature, Frankel and Saravelos (2009) find that measures of FX reserves and real effective exchange rates stand out as easily the most important lead indicators of financial crises. Note that other lead indicators with strong predictive powers were found to be credit growth, GDP and current account measures, and a number of EM countries are looking shaky on these measures too.
Concerns around stalling FX reserve growth are tempered by the fact that reserves in many countries are at or close to record highs. But while high levels of FX reserves do act as a cushion for the individual country during a crisis, FX reserve accumulation can also have significant downside risks for the individual country (eg real estate bubbles, credit bubbles, misallocation of domestic banks’ lending – sound familiar?). Much has also been written about the risks to the global financial system** as a whole and I’d recommend this 2006 ECB paper for a good overview. I’d add that while countries with high levels of FX reserves allow countries to weather crises better, they don’t make countries immune to crises; despite high levels of FX reserves, Taiwan still saw its currency slump 20% against the US dollar in 1997.
When is the US dollar likely to appreciate, or EM currencies depreciate? EM debt crises since the 1980s have tended to follow periods of rising Fed Funds rate and/or US dollar strength, so this would suggest it’s not imminent. However I was presenting at a conference last month and found a kindred spirit in CLSA’s Russell Napier, who has near identical concerns about EM debt, and his view is that there have been many examples where bubbles have burst before the risk free rate rises – domestic overinvestment, lending to poor credits, commodity price declines and capital exodus can cause debt crises independent of external factors.
Either way, the reason that EM FX reserves are not increasing (see charts below) at a time when EM currencies aren’t strengthening seems most likely to be because EM currencies are at best no longer cheap, and at worst have become overvalued. Which is another reason to like the US dollar right now.
* China’s devaluation in 1994 is widely cited as being one of the triggers for the 1997 Asian financial crisis. If you consider that Japan is currently more important to many Asian countries’ trade now than China was in 1993, could a big yen devaluation wreak havoc on the region in the same way? A counterargument could be that a big yen sell off would encourage Japanese savings to flood into its trade partners’ capital markets – capital controls meant this wasn’t possible following China’s devaluation.
** Ben Bernanke’s global savings glut hypothesis argues that excess global savings have been responsible for lower government bond yields. The fact that EM FX reserves have stalled suggests that these countries have not been net buyers of US Treasuries in the last year. The baton had been taken on by countries such as Switzerland and Denmark, whose FX interventions to maintain their respective currency pegs resulted in rapid FX reserve increases and strong support for core government bonds, but upwards pressure on these countries’ exchange rates has recently greatly reduced and their reserves are no longer growing either. That really just leaves the GCC countries, whose FX reserves are largely a function of the oil price. Yields on core government bonds would presumably therefore be significantly higher were it not for large scale domestic central bank purchases.
The value of investments will fluctuate, which will cause prices to fall as well as rise and you may not get back the original amount you invested. Past performance is not a guide to future performance.


18 years of comment
Discover historical blogs from our extensive archive with our Blast from the past feature. View the most popular blogs posted this month - 5, 10 or 15 years ago!


Bond Vigilantes
Get Bond Vigilantes updates straight to your inbox


