Should we worry about recent rises in capacity utilisation?
In recent years the use of capacity utilisation (CU) as a leading indicator for inflation, and hence for interest rates, has fallen somewhat out of favour. The large amount of spare capacity in the developed world in 2009-10 failed to translate into the substantial deflation that many had anticipated. Most economists and investors are eagerly focussing on U.S. labour market data instead, given that the Federal Reserve has tied its interest rate policy to an unemployment rate threshold of 6.5%. So, is it time to throw CU into the dustbin of economic history once and for all? This might be premature; ignore CU at your own peril.
Every month the Federal Reserve Board produces a CU percentage figure for industries in manufacturing, mining and utilities by essentially dividing actual output by capacity, i.e. a maximum sustainable output level. In general, capacity figures are derived from physical product data from government and trade sources or, if actual product data is unavailable, from responses to the Bureau of the Census’s Quarterly Survey of Plant Capacity. The basic rationale behind using CU figures as a leading inflation indicator reads as follows: in economic boom times factories tend to bring their output closer to full capacity, which places growing strains on their goods-producing capital. Excess demand and lack of supply, in combination with failure of stressed equipment, can lead to product shortages, sparking price increases and inflationary pressures. A more detailed explanation can be found in chapter 4 of Richard Yamarone’s book “The Trader’s Guide to Key Economic Indicators” from 2012.
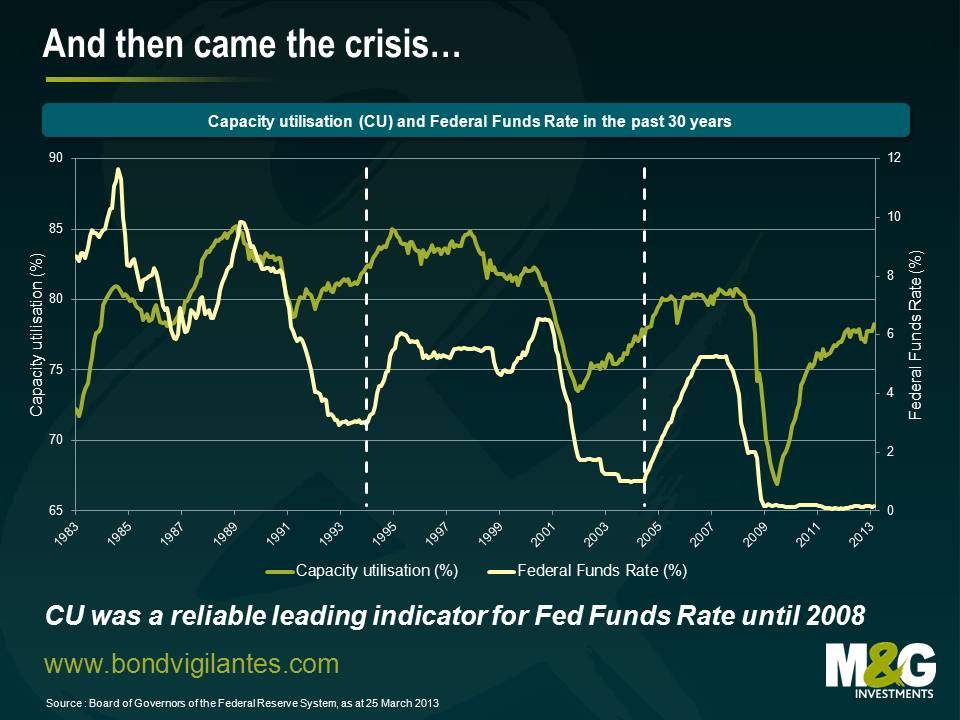
Prior to the financial crisis in the late 2000s, the Fed apparently followed this line of argumentation. As the first chart shows, major hikes in the Federal Funds Rate, e.g. the January 1994 and July 2005 rate hiking cycles, marked by white dotted lines, followed periods of rising CU numbers. However, from 2008 onwards this relationship has clearly broken down. Although CU has risen by more than 11 percentage points from 66.9% in June 2009 to 78.3% in February 2013, the Fed Funds Rate has been kept close to zero. One could argue that despite this remarkable CU growth, i.e. reduction in spare capacity, in recent years the absolute CU level is still below the psychologically significant 80% threshold. For instance, the 1994 rate hike, and the subsequent “death of the bond market”, began at a considerably higher CU level of 82.4% (January 1994). However, I do not find this argument particularly convincing, considering that the Fed’s most recent major rate hiking cycle started at a CU level of only 77.9% (July 2004), 0.4% below the current figure.
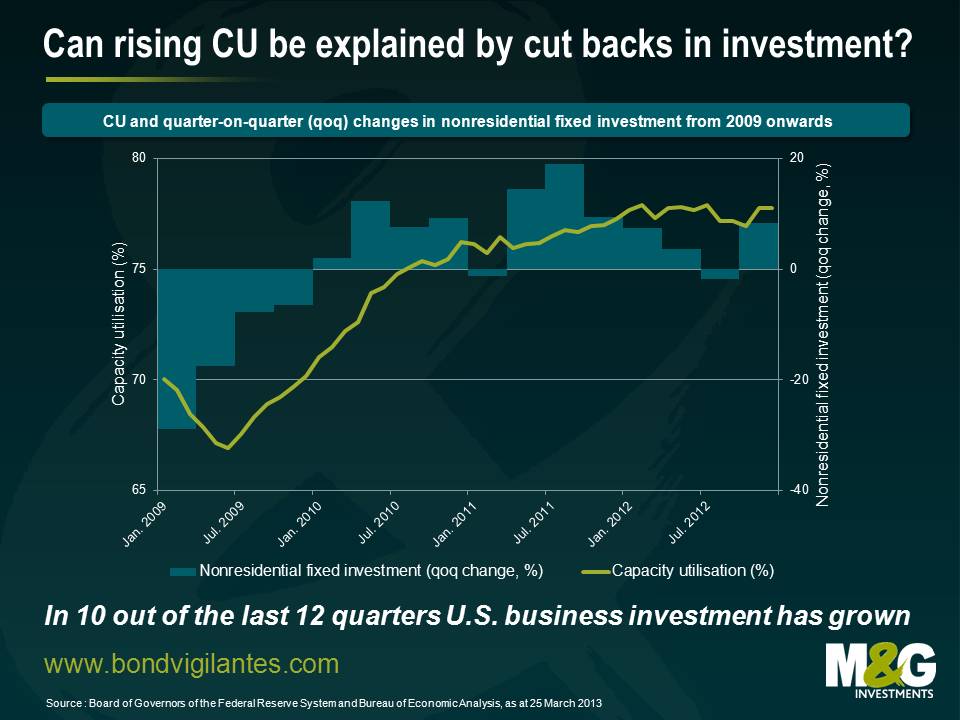
Another aspect worth exploring is the relationship between CU and business investment spending. Maybe U.S. companies have simply slashed their investment plans and decided to run down their plants and equipment after the financial crisis, scared to invest their cash safety blankets. In this case, rising CU numbers would merely be an artefact and no indicator for economic recovery and inflationary pressure. The second chart shows both CU and quarter-on-quarter (qoq) changes in non-residential fixed investment for 2009 onwards. With increasing CU figures, investment changes get less negative in 2009 before they enter positive territory in Q1 2010. Throughout the following three years, business investment has grown in 10 out of 12 quarters. Slightly negative qoq changes of -1.3% and -1.8% were recorded in Q1 2011 and Q3 2012, respectively. It should also be noted that the decline in qoq investment changes from Q3 2011 to Q3 2012, which was addressed in a Wall Street Journal article from November 2012, has come to an end by jumping to +8.4% in Q4 2012. Considering this pattern of investment spending, recent CU increases cannot be explained by cut backs in business investment. Therefore, I believe that the rise of CU is indeed a strong sign for an ongoing recovery of the U.S. economy.
In conclusion, although at the moment the Fed seems to be preoccupied with the unemployment rate, I believe it is worthwhile keeping an eye on CU. If CU continues to rise, while being backed up by growing business investments, this would indicate inflationary pressures too strong to be forever ignored by the Fed.
The value of investments will fluctuate, which will cause prices to fall as well as rise and you may not get back the original amount you invested. Past performance is not a guide to future performance.


18 years of comment
Discover historical blogs from our extensive archive with our Blast from the past feature. View the most popular blogs posted this month - 5, 10 or 15 years ago!


Bond Vigilantes
Get Bond Vigilantes updates straight to your inbox


