


Emerging market debt: 2013 returns post-mortem and themes for 2014
Emerging market (EM) fixed income posted its third negative performance year since 1998, driven by rising US Treasury yields, fears of tapering, and concerns around declining capital inflows from developed markets into emerging markets. A number of EM countries were also hindered by country-specific drivers such as slowing growth, decreasing productivity, twin deficits, and exposure to a slowing Chinese economy. EM fixed income still saw inflows for 2013 of $9.7bn, although this was way behind the $97.5bn inflows of 2012, and the asset class has seen outflows of around $40bn since May (source EPFR, JP Morgan).
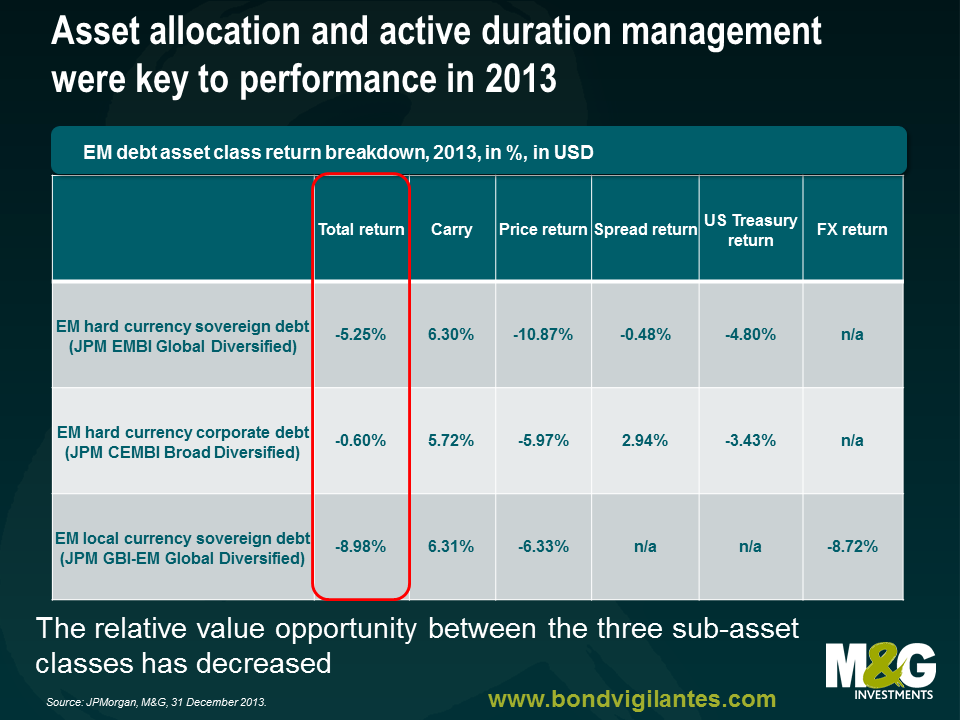
Within the asset class, EM corporate bonds outperformed EM sovereign debt, with the former returning -0.6% and the latter -5.3% in 2013. This sub-asset class benefited from its shorter duration and tangential spill-over (or higher correlations?) from the stronger performance in global investment grade and high yield credit. EM corporate bond spreads, measured by the JP Morgan Corporate EMBI index, are now flat to hard currency sovereign debt which translates into a narrowing of 66 bps since the beginning of 2013.
Therefore, the asset allocation between EM sovereigns in both hard and local currency and EM corporates was one of the key calls for performance in 2013. Sovereign bonds underperformed over the year, with hard currency debt delivering a negative return of -5.3%, also due to the fact that it has the longest duration of all three sub-asset classes. However, local currency debt faced a particularly challenging year, delivering a negative total return of -9.0% which can be mostly attributed to the foreign exchange component of the bond, while the carry, i.e. the additional return due to higher local interest rates, compensated for the back-up in yields.
It is worth though having a closer look at the underlying dynamics as it helps to further understand the drivers of performance in 2013 and how 2014 will be different.
1) Most of the negative return of EM hard currency sovereign debt was driven by rising US Treasury yields and less by the perceived deterioration in EM credit profiles and widening of EM spreads.
The negative impact of widening credit spreads was modest, contributing -0.5% to the total return of hard currency sovereign debt as the chart above shows. To put this into perspective, spreads widened by 50 bps in 2013, while 10 year US Treasury yields backed up by 116 bps. Hence, duration management was key in 2013. With tapering priced in and the US Treasury forward curve pricing 10 year US Treasury yields at around 3.5% by year end, an additional backup in US rates should be less pronounced in 2014 than it was in 2013. The risk to this outlook is for stronger than expected data and/or worsening of inflation expectations, which is not priced in at the moment. That is, a bear flattening of the US curve through pushing forward the anticipated hikes in the Fed Funds rate (currently priced for 2015 and beyond) is a risk to be monitored carefully.
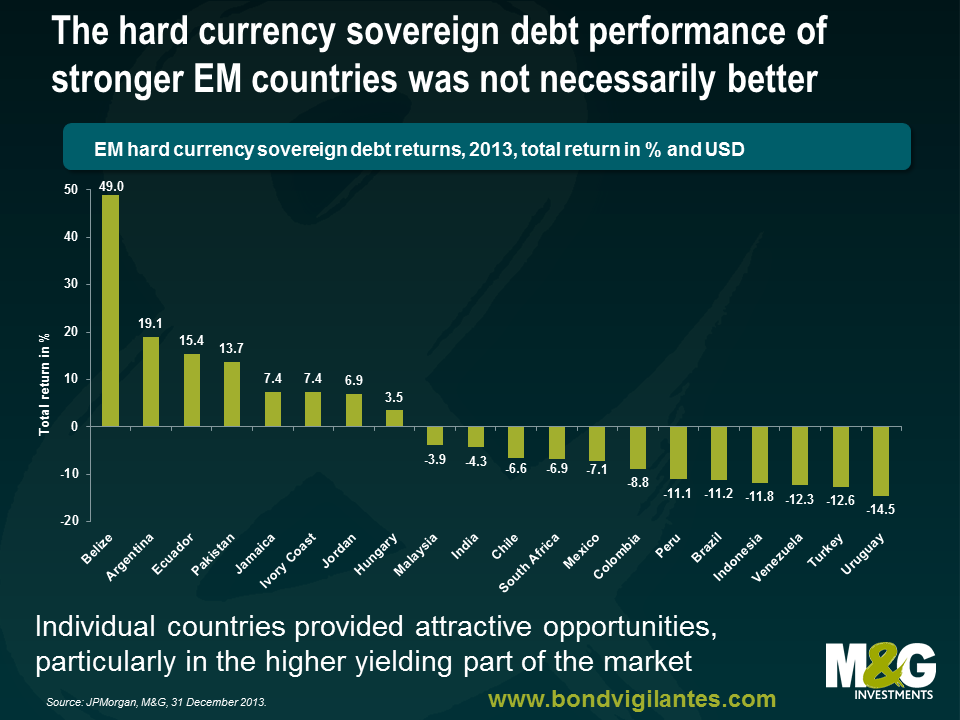
2) The performance of hard currency sovereign debt was not necessarily better for countries that are perceived to be more resilient, i.e. have lower debt levels, stronger liquidity, fiscal and current account position, sustainable growth as well as reform momentum, than for those that are perceived to be more vulnerable.
Let’s take Mexico, one of the stronger emerging market economies, and South Africa, an increasingly vulnerable emerging market country, as an example. Mexican government debt denominated in hard currency returned -7.1%, while the total return for South Africa’s government bonds stood at -6.9%. One explanation is that the channel of adjustment in the current account deficit countries is weaker currencies and/or higher interest rates which may not be such a negative factor for sovereign debt spreads. Countries that allow for a free floating currency minimise net international reserve losses, which is supportive for the performance of hard versus local currency debt. In fact, the major performance difference between these two countries was precisely on their local currency debt (see below), where Mexico justifiably outperformed South Africa.
3) Another characteristic of 2013 was the outperformance of those bonds associated with higher credit risk, such as high yielders and frontier markets.
The JPMorgan Next Generation Markets Index (NEXGEM), an index for frontier market sovereign bonds rated BB+ and lower, returned +5.1% in 2013. This may seem counterintuitive given the recent change of sentiment towards EM assets, but it is refreshing that the market differentiated between the various emerging market issuers and rewarded the stable or improving credit profile of the weaker issuers with positive returns and re-priced deteriorating stories into negative returns. Argentina, for example, returned +19.1% on the delayed court decision regarding the holdouts, as well as on expectations for better economic policies with a new government in 2015. Venezuela, on the other hand, returned -12.3% on continued growing macroeconomic and political imbalances. In addition, Eichenberg and Gupta find that countries which allowed for large increases in their current account deficits and for a sharp appreciation of their currencies, saw indeed a stronger valuation correction, but also suggest that bigger and more liquid emerging markets experienced, generally speaking, more pressure on currency and debt valuations. Identifying the critical bottom-up, idiosyncratic factors was hence key in 2013 and will remain so in 2014, given the large rally we have seen in most of these frontier market bonds and, therefore, less favourable valuations.
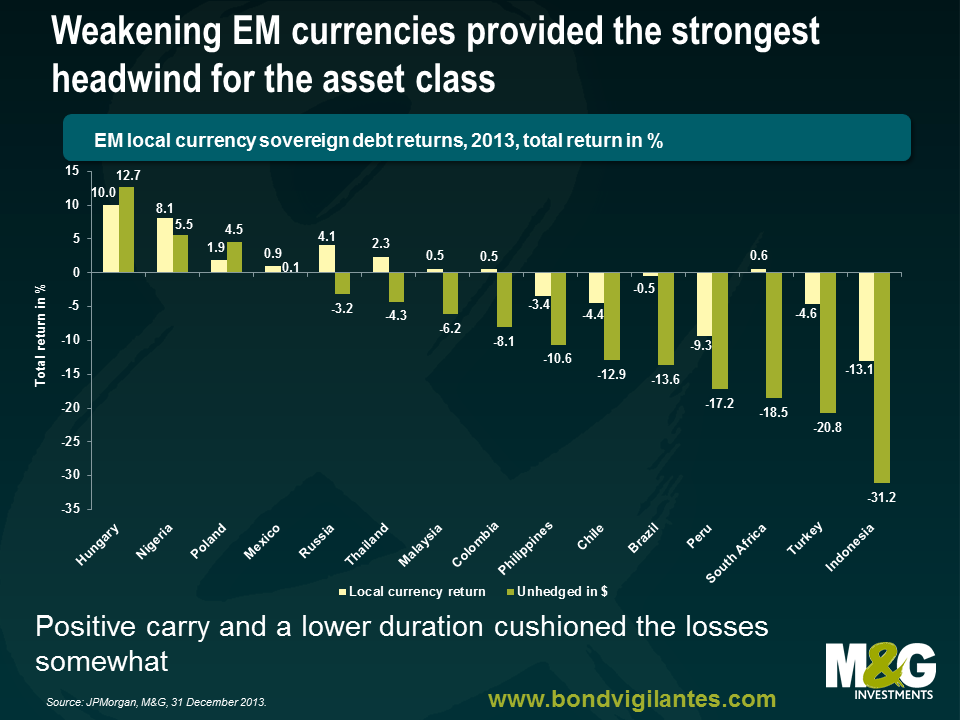
4) Local currency debt was the key underperformer.
The bulk of the losses in emerging market debt issued in local currency was due to currency depreciation, which was one of the key transmission mechanisms in 2013 to potential lower capital flows into emerging markets. As such, various currencies will continue their move to fair value or undervaluation, if warranted, through 2014 as well. An eventual narrowing of current account deficits in countries that require an adjustment but do not face major structural rigidities, such as Brazil, India or Indonesia, should slow the depreciation pressure and, thus, performance in 2014 should not be as negative. That is, the balance of risks and market focus should then be centred on the capital account.
5) Positive carry and a lower duration have provided an anchor of support for local currency debt returns.
Local currency yields rose by 135 bps in 2013 to 6.85%, driven by currency weakness (South Africa), monetary policy tightening (Brazil, Indonesia), fiscal deterioration and inflation risk (Brazil), political and external account concerns (Turkey), as well as a higher floor from US yields. The carry, however, and a lower average duration on local currency debt, for which a comparable index has a duration of 4.6 years, allowed for the total return in local currency terms to be flat in 2013 and provide a better cushion for 2014.
6) Political risks were pretty muted in 2013 (with a few exceptions), but are likely to increase significantly in 2014.
Though countries like Turkey and Ukraine as well as the Middle East faced serious political crises, politics did not play a major role for the asset class in 2013. However, 2014 will be a year in which the return impact from idiosyncratic political events in emerging markets could increase substantially. Twelve of the major emerging market countries will have presidential and/or parliamentary elections, including all the ‘fragile 5’ countries, i.e. Brazil, India, Indonesia, South Africa and Turkey – and we will comment in more detail on this in a forthcoming blog closer to the election dates. The prospect of these elections could potentially reduce the net capital flows into these economies on a temporary basis, such as through local capital flight, delayed foreign direct investment (FDI) and/or portfolio flows as well as increased demand for foreign exchange (FX) or credit default swap (CDS) hedging etc., pending the outcome of the elections and subsequent prospects for future economic policy and support for reforms.
In summary, the asset allocation between EM sovereigns in both hard and local currency and EM corporates should be less important in 2014 than it was in 2013, given that the forward yield curve implied levels for US interest rates is already pricing 10 year yields in the mid 3% range. Furthermore, the relative value opportunity between these three asset classes has decreased after the underperformance of sovereign debt in 2013 and the narrowing of EM corporate bond spreads on the back of the rally in global credit in both the investment grade and high yield space. In addition, valuations for local currency debt look better, also on the basis of the exchange rate adjustments seen in 2013 and higher yields. In other words, we expect the difference on performance, on aggregate, to be more muted at the top down level.
On the other hand, idiosyncratic EM events, including political events, will become more relevant, which makes bottom up security selection and timing, i.e. the repositioning through bouts of volatility, even more critical in 2014 . Global macro factors and drivers of global risk appetite, such as economic growth and inflation, China’s rebalancing efforts, commodity prices as well as developments in the Eurozone, will remain equally important.
The value of investments will fluctuate, which will cause prices to fall as well as rise and you may not get back the original amount you invested. Past performance is not a guide to future performance.
18 years of comment
Discover historical blogs from our extensive archive with our Blast from the past feature. View the most popular blogs posted this month - 5, 10 or 15 years ago!


Bond Vigilantes
Get Bond Vigilantes updates straight to your inbox