


What is the collapse in the Baltic Dry shipping index telling us about global growth?
The Baltic Dry Index (BDI) is a daily priced indicator of the cost of shipping freight on various trade routes for dry bulk carriers, based on data submitted by shipbrokers to the Baltic Exchange in London. Since March this year the index has fallen by over 50%, and this has made economists worry that the fall reflects a generalized slowdown in global trade – dry bulk goods include cement, coal, ore as well as food stuffs like grain. A lot of it is the stuff that China imports to support its investment led growth model, so a collapse in demand for the ships that carry bulk dry goods to China might be telling us that China is slowing rapidly. And that obviously has significant impacts on those economies which are reliant on exporting to China for their own growth – for instance Australia, Chile, South Africa and South Korea all have between 21% and 36% of their exports going to China.
Obviously though demand for space on ships is only half of the equation. As expectations grew that the Great Financial Crisis was behind us, and as China kept publishing high single digit growth rates, there was a significant expansion in shipbuilding. Since 2010 annual growth in Dry Bulk supply has been anywhere from 5% to over 15% year on year – in most periods outstripping demand growth, and certainly depressing prices. It’s not just dry bulk, there’s also big excess supply in container ships. Shipping companies are trying to manage these supply problems – the average age of ships when scrapped has fallen from 28 years in 2011 to 21 years in Q1 2014, 4% of the fleet is “idle”, ships are “slow steaming” (going slowly to save fuel and costs of being idle at port) and shipping companies are cancelling future orders for new ships (in 2013 32% of orders were not delivered as planned and were either postponed or cancelled). But for 2014 and 2015 at least the excess supply problem gets worse, not better.
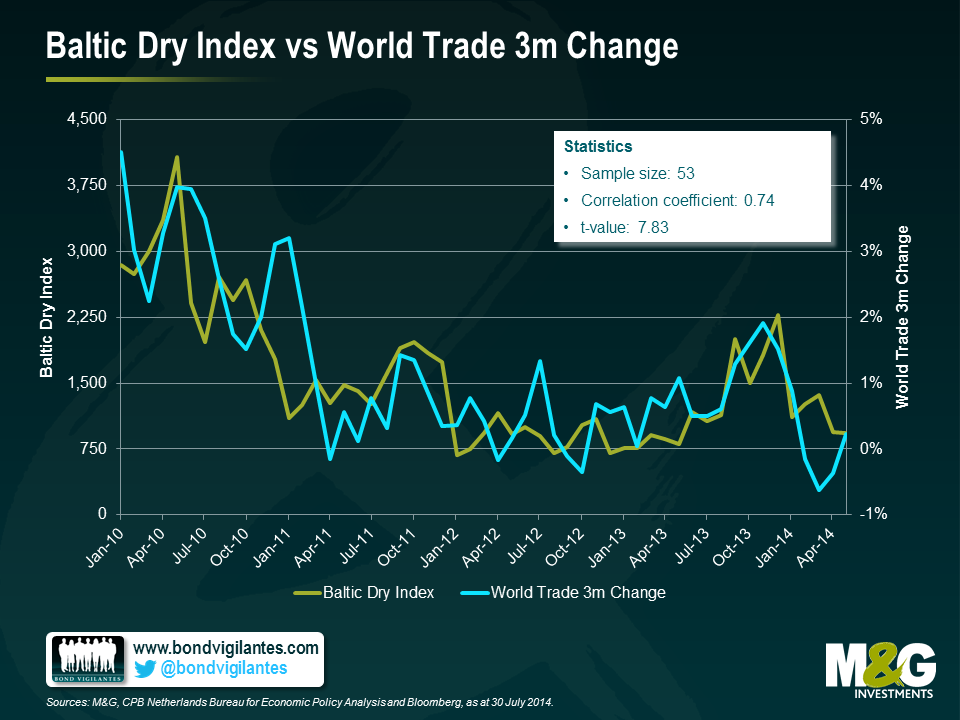
So is the Baltic Dry Index telling us anything about global trade and growth? We started off from a position of scepticism – there used to be a good relationship (we wrote about it here in 2011), but since the massive shipping supply boom maybe it had lost its power as in indicator? But it turns out that the correlation between world trade and the BDI is EXTREMELY good. The CPB Netherlands Bureau for Economic Policy Analysis produces the monthly CPB World Trade Monitor. It’s clear from these global trade data that the volume of trade has been weakening since the end months of 2013. Trade actually fell in May, by 0.6% month on month, although due to volatility and seasonals, a rolling 3 month versus previous 3 month measure is preferred. The chart below shows that after some strong momentum in global trade in 2010 it’s fallen to a much more stagnant growth level in the past couple of years, and a brief recovery in mid 2013 has tailed away. In Q1 this year, world trade momentum turned negative. We have shown the Baltic Dry Index against this measure of world trade – it doesn’t just look like a strong relationship optically, but it has a correlation coefficient of 0.74 (strong) with a t value of 7.83 (statistically significant at an extremely high level).
When we last wrote about the Baltic Dry Index we pointed out that it appeared to be a good lead indicator for 10 year US Treasury yields, the theory being that a fall in the BDI presaged falling GDP and therefore justified lower rates. And indeed the fall in the BDI in early 2011 did nicely predict the big Treasury rally 3 months later. There is still a relationship today, but sadly for us bond fund managers the better relationship is with UST yields predicting movements in the BDI (so ship-owners please feel free to make money on the back of this). Nevertheless, over the same time period as the earlier chart there is still a decent correlation if you use the BDI as a leading indicator and push it forward by 3 months, so it does appear to have some predictive powers.

So we’ll keep looking at the Baltic Dry Index for the same reason that we like the Billion Prices Project for inflation. When you can find a daily priced, publically available measure or statistic that comes out a month or more ahead of official data and is a strong proxy for that data it’s very valuable.
The value of investments will fluctuate, which will cause prices to fall as well as rise and you may not get back the original amount you invested. Past performance is not a guide to future performance.
19 years of comment
Discover historical blogs from our extensive archive with our Blast from the past feature. View the most popular blogs posted this month - 5, 10 or 15 years ago!


Bond Vigilantes
Get Bond Vigilantes updates straight to your inbox