How to find relative value in EUR and USD investment grade credit using CDS
There is more than one way to skin a cat for credit investors. Those looking for credit exposure can do so through either owning the debt issued by an issuer or by selling credit default swap (CDS) protection for the same issuer. The differential in price between the corporate bond and CDS contract can mean the difference between outperforming and underperforming in a world of tight credit spreads and low yields. Additionally, it is possible to do this for the whole investment grade or high yield market, allowing bond investors to gain credit exposure in their preferred geographical region (for example, the U.S., Europe, or Asia). U.S. and European credit spreads have compressed substantially and are now at levels last seen before the Lehman Brothers collapse. Given this convergence, the question for global IG bond investors today is which market is relatively more attractive from a valuation perspective?
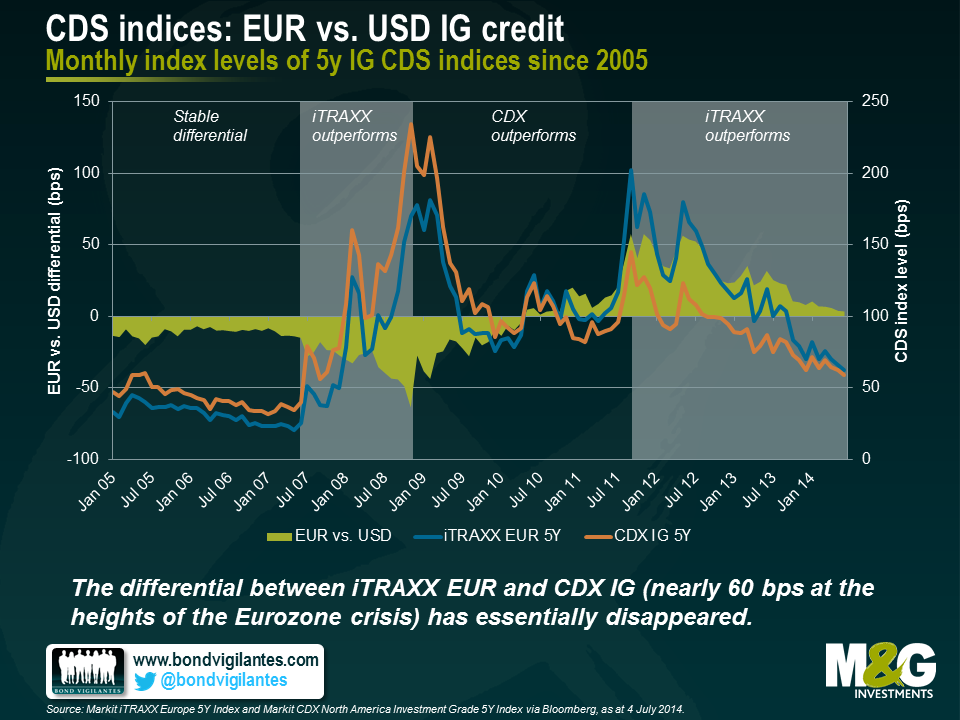
Let’s first take a look at EUR versus USD credit. The easiest way to do this is by using two credit default swap indices. These indices (also known as CDI) represent 125 of the most liquid five-year credit default swaps on investment grade (IG) entities in Europe (iTRAXX EUR 5Y) and North America (CDX IG 5Y). Looking at the historical performance of both indices, the differential between both index levels remained basically flat until the onset of the financial crisis in the second half of 2007. During this period, iTRAXX EUR traded around 10-15 basis points (bps) tighter than the CDX IG. During the crisis, the absolute levels of both indices increased substantially but iTRAXX EUR outperformed CDX IG, with the North American index moving up to a peak level of around 230bps in late 2008. In the following three years, with the easing of the U.S. recession and the emergence of the Eurozone crisis, CDX IG outperformed iTRAXX EUR by around 120 bps.
Starting from its minimum of -64 bps in November 2008, the index differential turned positive in May 2010 and reached its peak value of 57 bps in November 2011. With the Eurozone crisis calming down, iTRAXX EUR has once again outperformed CDX IG. Today the index differential has virtually disappeared (4 bps), and both indices have tightened to around 65bps by the end of May, a level not seen since the end of 2007. iTRAXX EUR continued to tighten in June and temporarily traded through CDX IG for the first time since March 2010.
Selling CDS protection for a company creates a credit risk exposure that is essentially equivalent to buying a comparable bond of the same issuer. Hence, from a fixed income investor’s point of view, it is worth comparing the CDS spread and the credit spread of the cash bond. The difference between these two is often referred to as the CDS basis. Positive values (i.e., CDS spread > bond Z-spread) indicate a higher compensation for taking the same credit risk through the CDS of a company rather than owning the bond of a company, and vice versa for a negative basis.
Drawing a direct like-for-like comparison between CDS and corporate bond indices can be tricky. For example, it is impossible to find appropriate outstanding cash bonds for all the companies that are in the CDS indices. Furthermore, CDS indices comprise contracts with a certain maturity (e.g., five years) and roll every six months, whereas cash bonds approach a predefined maturity and are eventually redeemed, assuming they don’t default or are perpetual instruments.
We approached the problem by constructing our own equally-weighted non-financial CDS and cash bond indices, both for U.S. and Eurozone issuers. In terms of EUR issuers, we started from the current iTRAXX EUR roll, ranked the constituent entities by total debt outstanding and selected the top 20 Eurozone non-financial issuers with comparable outstanding bonds (c. five years until maturity, senior unsecured, vanilla, reasonable level of liquidity, etc.) for our CDS and bond indices. We then compared the year-to-date evolution of weekly CDS and cash bond spreads as well as the CDS basis, averaged over the 20 index members. For our USD indices we applied the same strategy, selecting a subset of 20 US non-financial issuers from the current CDX IG roll.
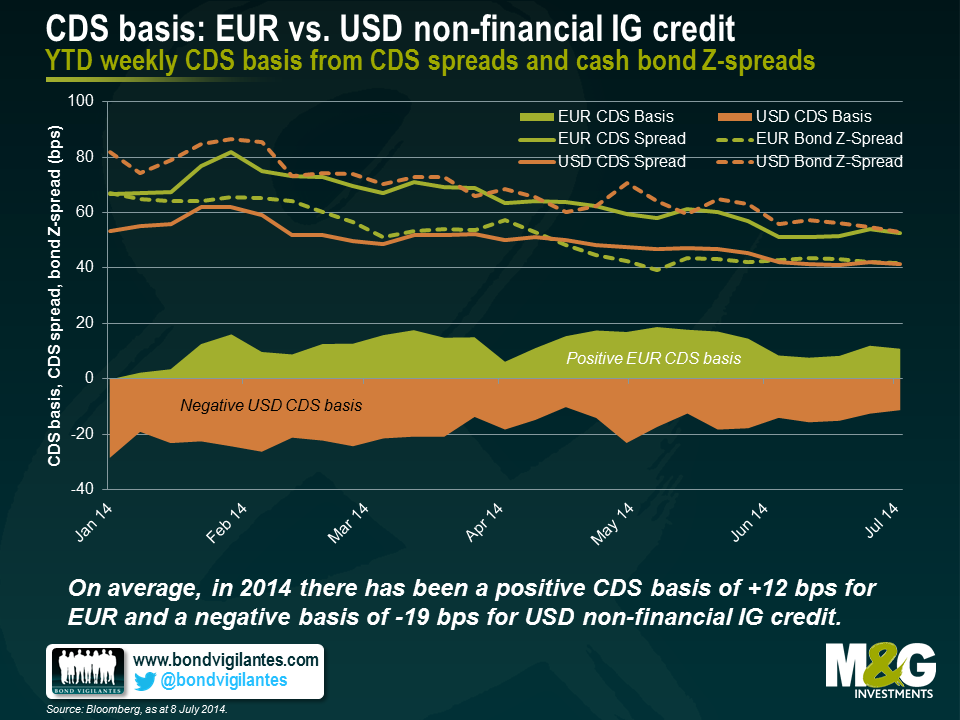
The chart below shows CDS spreads, bond Z-spreads and CDS bases both for our EUR and USD indices. Throughout the year, all four non-financial IG index spreads have been grinding tighter. The CDS basis for USD non-financial IG credit has been consistently negative (-19 bps on average). In absolute terms the negative USD basis has receded, moving from between -30 and -20 bps in January to -11 bps in the first week of July. In contrast, except for the first week of January which might be distorted by low trading volumes, the EUR non-financial IG CDS basis has been positive (+12 bps on average) and amounts to +11 bps for the first week of July.
Several reasons have been put forward to explain the contrast between EUR and USD CDS basis values, including supply/demand imbalances within European cash bond markets adding a scarcity premium to bond prices and thus suppressing bond spreads. It has also been argued that in Europe CDS contracts were predominantly used for hedging purposes (i.e., to reduce credit exposure by buying the CDS contract) driving up CDS spreads, whereas the use of USD CDS contracts was more balanced between increasing and decreasing credit risk exposure.
In the current market environment characterised by low yields and tight credit spreads, CDS basis values do matter. The choice between a cash bond or a credit derivative is another lever fixed income investors can use to exploit relative value opportunities. By carefully selecting the financial instrument, cash bond vs. CDS contract, a spread pickup of tens of basis points can be realised for taking equivalent credit risk. A positive basis indicates that the CDS looks cheap relative to the cash bond, and vice versa for a negative basis. For instance, at the moment it often makes a lot of sense for us to get exposure to EUR IG credit risk through CDS contracts rather than through cash bonds, when we see attractive positive CDS basis values.
The value of investments will fluctuate, which will cause prices to fall as well as rise and you may not get back the original amount you invested. Past performance is not a guide to future performance.


18 years of comment
Discover historical blogs from our extensive archive with our Blast from the past feature. View the most popular blogs posted this month - 5, 10 or 15 years ago!


Bond Vigilantes
Get Bond Vigilantes updates straight to your inbox


