Two devils in the US inflation detail
US inflation has been surprisingly low for a few months after a peak in May 2014. According to the latest data released in September, core CPI (i.e. excluding food & energy) stands at just 1.7% with much of this weakness caused by declining goods prices. According to the US Bureau of Labor Statistics (BLS) the average price of imports, excluding fuel, has not increased in six months. A stronger dollar, falling commodity prices and outright price cuts have all more than offset the upward push from service sector prices. In general, over the last two years disinflation within the goods sector has tamed overall US CPI, allowing the Fed to pursue stimulative policies to get the economy back on track.
Going forward this picture is likely to change. Goods disinflation is finally receding and the strong momentum in the housing and labour markets are already putting some pressure on service sector prices. Where should we be looking? As usual, the devil is very much in the detail. There are two primary service inflation indicators which will be worth keeping a close eye on.
The first one is residential rents. Shelter is one of the largest components in the US core consumer price inflation, and is derived from housing costs based on rent, not home prices.
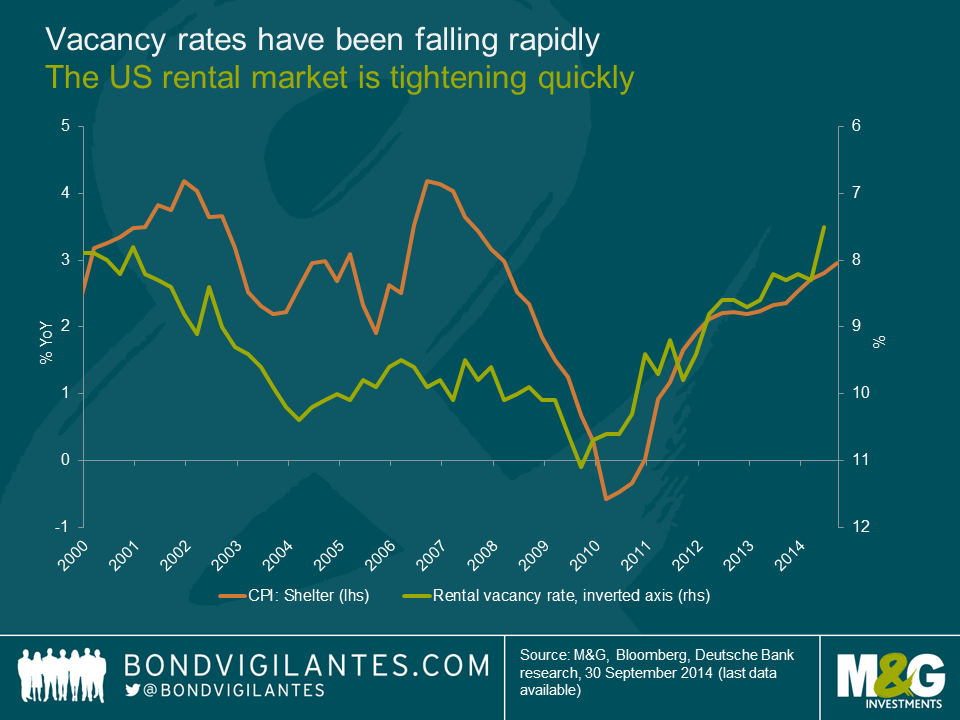
As shown in the chart below, vacancy rates have been falling rapidly and are just 7.5% today, the lowest level on record, suggesting the rental market is quickly tightening and the costs of renting will inevitably rise over the next 12-18 months. If this trend continues, current housing supply could soon become insufficient to meet the increasing demands of a stronger job market and increase in household formation.
Moreover, based on current vacancy rates, housing rents could rise at 4 to 4.5% over the next 12 months. And since rents account for roughly 40% of the core CPI, higher rents could push the annual inflation rate up significantly.
The second indicator worth paying attention to is healthcare costs. This is the largest component of the personal consumption expenditure index, or ”PCE deflator” (i.e the one the Federal Open Market Committee (FOMC), tends to follow), as it accounts for approximately 20%.
Medical inflation is also likely to benefit from a stronger job market. With jobless claims at multi-year lows and private non-farm payrolls now above the pre-crisis peak, the demand for healthcare should rise. Furthermore, according to the US Department of Health and Human Services, the new “Obamacare” plan is likely to increase healthcare expenditures as previously uninsured individuals have now been granted access to medical care. Over time, the increased demand for healthcare against a relatively constant supply, should put upward pressure on medical prices.
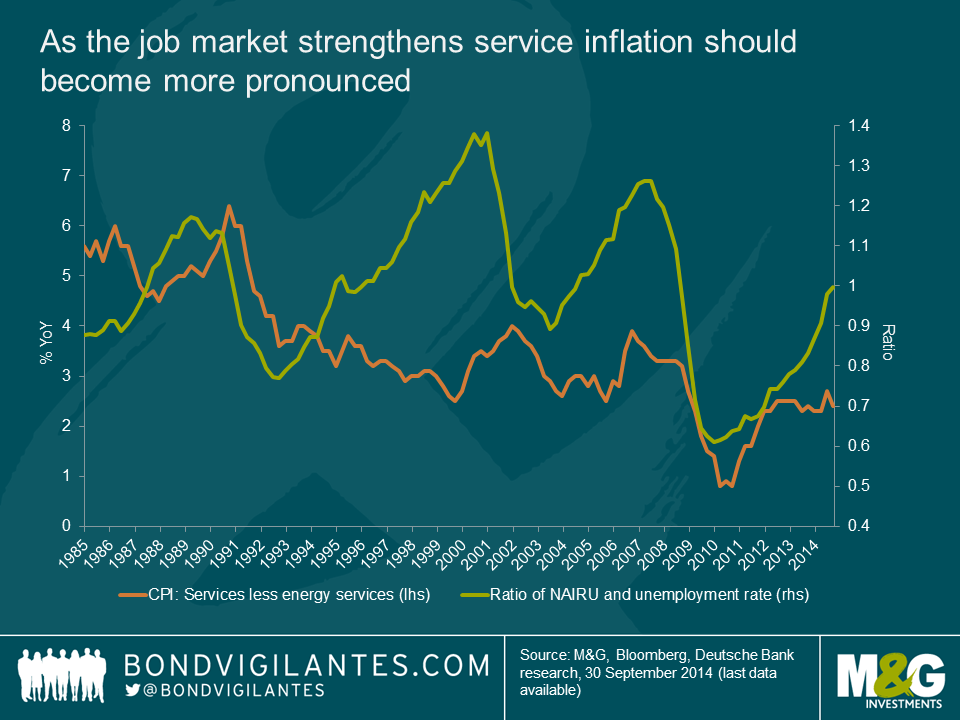
For the last three years, service-related prices have been consistently running above 2%. Going forward, as the job market strengthens, and wage pressures become more evident, service inflation should become more pronounced. The graph below shows how the correlation between the two has been reasonably strong since the great financial crisis.
So far, the biggest drag on inflation has been the downward pressure on goods prices coming from overseas. However, given service sector inflation has three times the weight of goods inflation in core CPI, it would take an unusually large decline in the latter to prevent inflation from trending higher from here.
The value of investments will fluctuate, which will cause prices to fall as well as rise and you may not get back the original amount you invested. Past performance is not a guide to future performance.


18 years of comment
Discover historical blogs from our extensive archive with our Blast from the past feature. View the most popular blogs posted this month - 5, 10 or 15 years ago!


Bond Vigilantes
Get Bond Vigilantes updates straight to your inbox


