


Timing the Fed Rate Hike
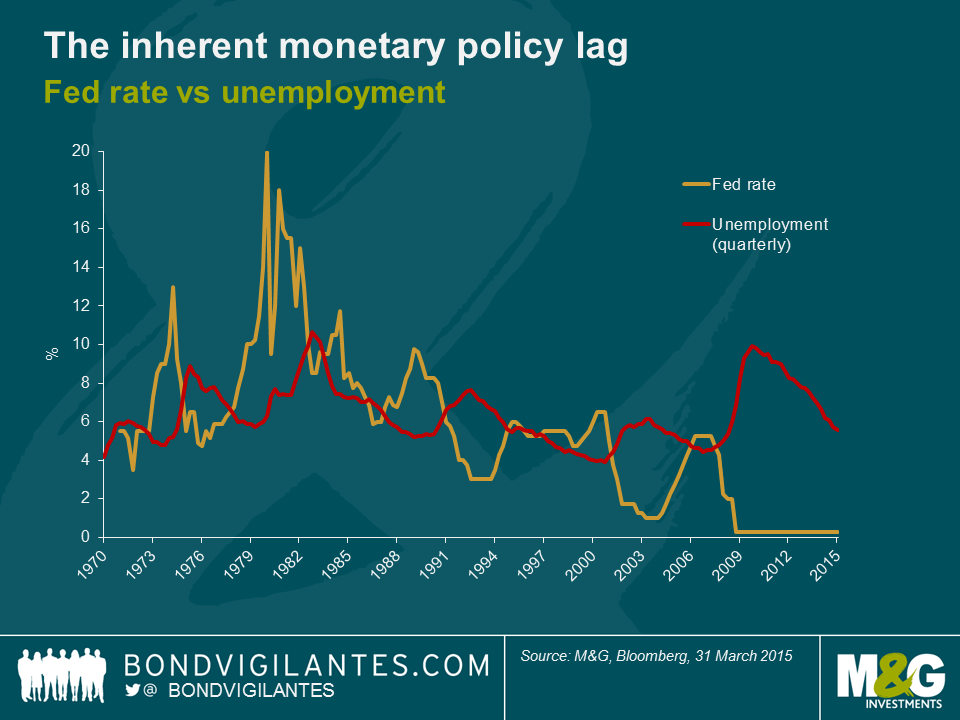
The graph below shows US unemployment alongside the Fed rate over a period of 45 years. From this you can observe the broad relationship between the two, specifically the time delays between Fed rate hikes and the upturn in employment which has historically followed. This time the Fed have delayed the rate hike for a number of reasons, but if history is anything to go by, we can perhaps use this data to make some predictions with regards to the potential timing of the first hike.
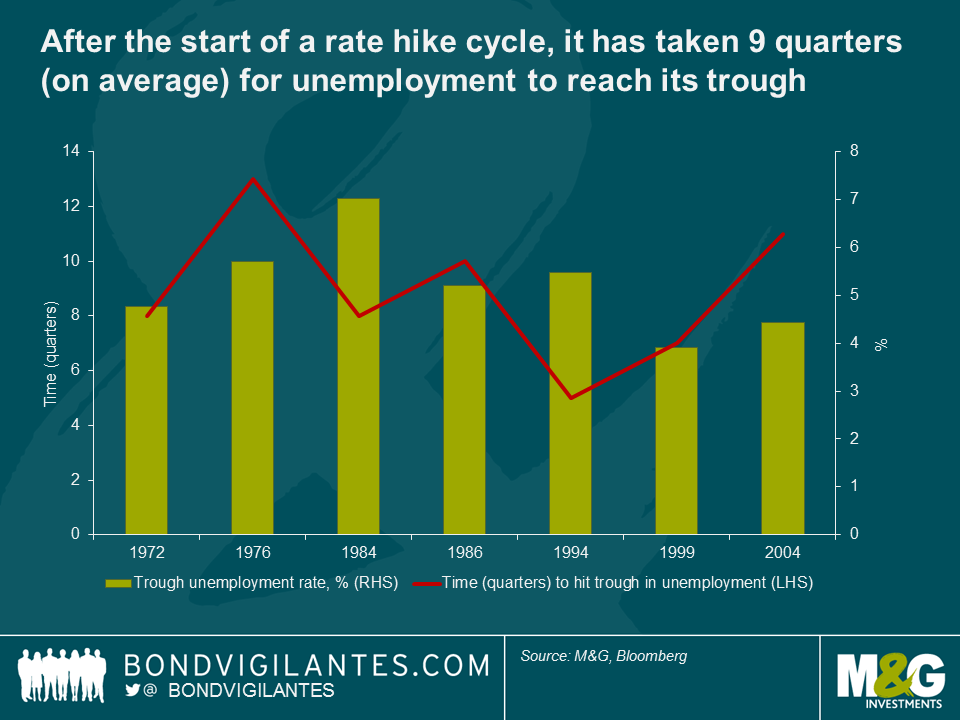
1) After the initial rate hike, the unemployment rate tends to bottom out in 2.25 years
If assessing the timing of an interest rate hike, we need to also consider the time lag inherent in monetary policy. We have therefore looked at each rate hiking period in isolation and determined how long it has taken for the unemployment rate to reach its trough after the first Fed rate hike in its tightening cycle. Although this has varied from 13 quarters in 1976 to 5 quarters in 1994, over the whole period it has taken an average of 2.25 years for unemployment to bottom out after the Fed’s initial rate hike. Therefore, if the Fed was to hike later today, based on previous experience, unemployment may bottom out in September 2017, although it could be between September 2016 and September 2018.
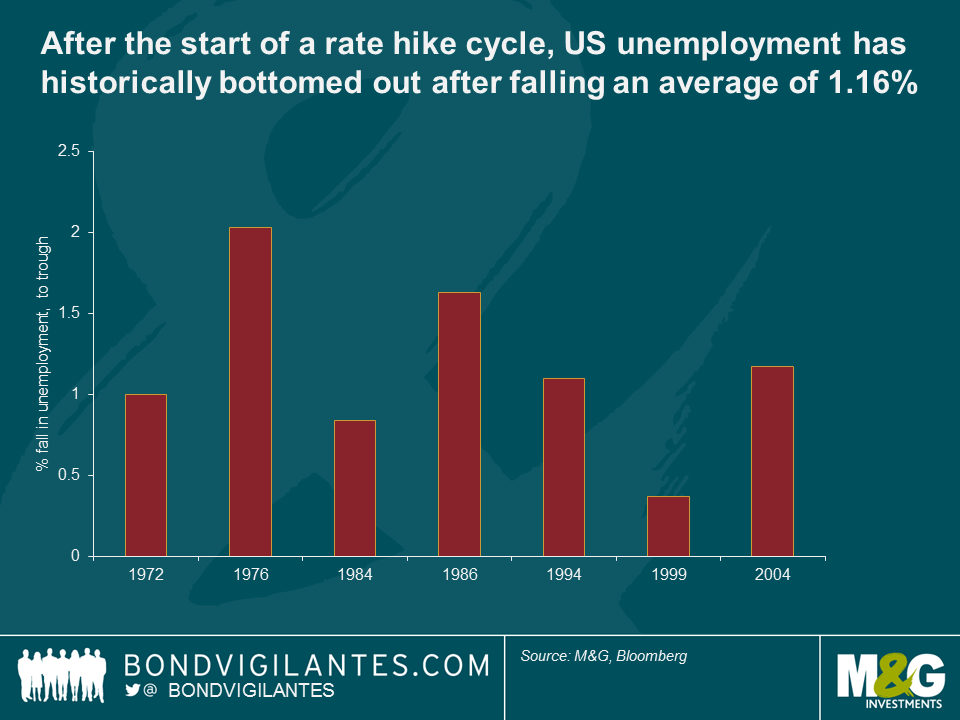
2) Unemployment tends to fall 1.2% after a rate hike cycle
If the Fed hikes rates later today, where will unemployment trend from its end of Q1 reading of 5.6%? Again glancing backwards, when unemployment has bottomed out, it has tended to have fallen by 1.2% on average after the first hike, suggesting that consistent rate hikes commencing in June could result in unemployment eventually falling to 4.4% at the cyclical low.
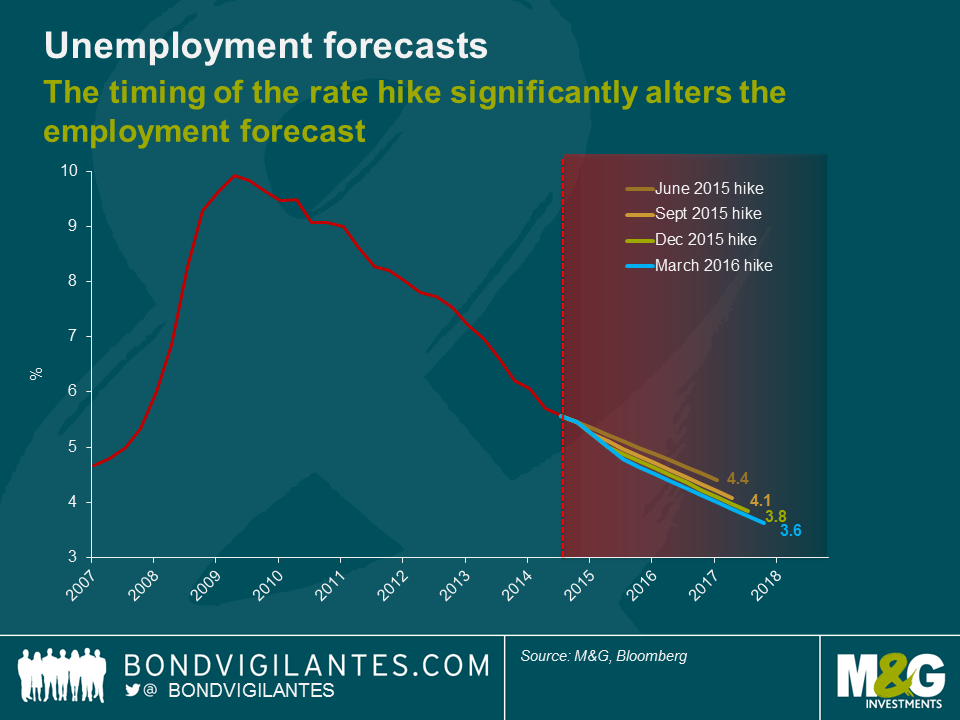
3) Depending on the timing of the rate hike, unemployment could fall to 4.4-3.6%
Building on the observations of the graphs above, we can use these historical averages to predict a range that unemployment could move in, should the Fed hike rates in any of its next four meetings. If the Fed was to delay hiking until March next year, unemployment could fall to 3.6% in June 2018, which would be the lowest US unemployment reading for at least 45 years.
The Fed has delayed its rate hike as wage pressure has been limited so far and the extent of the financial crisis and the lack of flexibility with regard to rate setting at the zero bound necessitated a more than a traditional easing cycle. However, as we have commented before, employment markets are healthy and full employment approaches. As we can see from the above analysis, extrapolating the current trend in employment growth, it is unlikely the Fed will delay its hike until next year and should signal a rate hike very soon given current economic trends and the inherent lag in monetary policy.
The value of investments will fluctuate, which will cause prices to fall as well as rise and you may not get back the original amount you invested. Past performance is not a guide to future performance.
19 years of comment
Discover historical blogs from our extensive archive with our Blast from the past feature. View the most popular blogs posted this month - 5, 10 or 15 years ago!


Bond Vigilantes
Get Bond Vigilantes updates straight to your inbox