What should the relationship be between index-linked bond yields and equity yields?
There ought to be a relationship between yields available on equities (earnings or dividend yields) and those on index-linked gilts and other inflation-linked bonds. Ex-ante, and adjusted for risk, expected returns should be similar across asset classes. In the case of equities and index-linked bonds, both asset classes give you exposure to “real” returns on both income and capital. For index-linked bonds this is explicit in the bond contract – coupons and final redemption proceeds are uplifted by the RPI in the UK, and CPI in most other markets. For equities the link is less firm, but still exists. Buying a share should give you exposure to the “real” economy. As inflation rises, companies are able to increase prices of the goods that they sell, and the assets that they own (inventories, equipment, property, patents) should also increase in price. Some of their liabilities – for example debt – will shrink in real terms (others won’t, for example wages, RPI linked pensions). But as owning a share in a company is like owning a share in the real economy, earnings and dividends should increase as inflation increases.
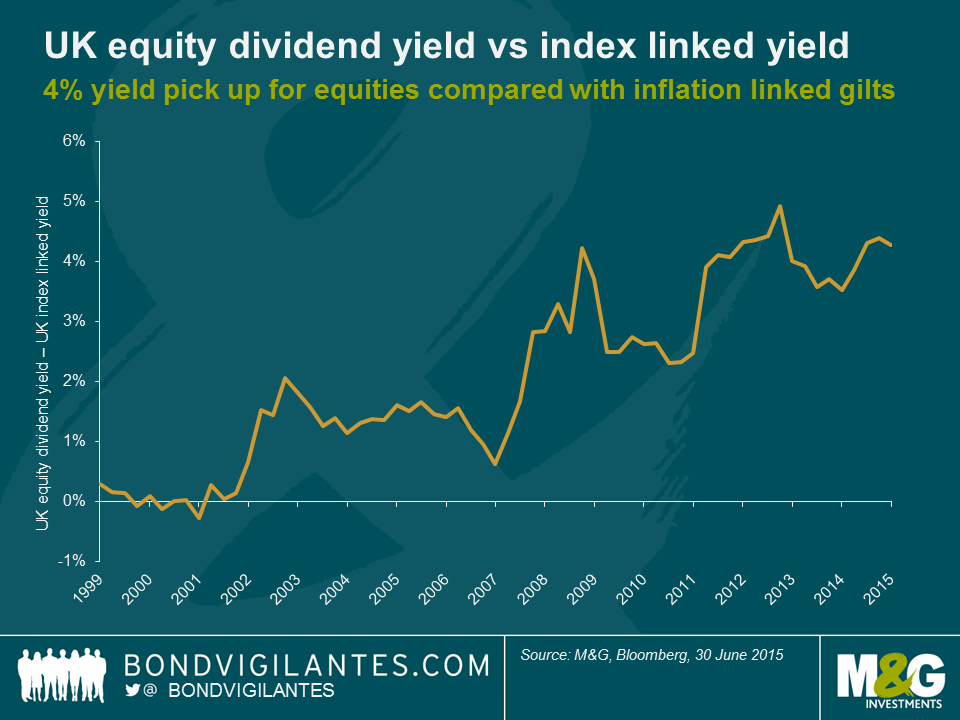
Therefore the yields on linkers and shares should be related over the medium term. But the chart below shows that the dividend yield on the FTSE 350 is currently over 400 bps higher than that available on the 10 year index-linked gilt (which currently has a negative yield). Back at the height of the dotcom boom, the relationship briefly reversed – you received a higher yield on UK government debt than on riskier equities, but since then the trend has been for equity yields to rise relative to bond yields.
This large valuation discrepancy could signal a significant increase in the perceived riskiness of shares relative to bonds over the past decade. But in fact credit spreads are around their lows for the cycle (so the high dividend yield probably doesn’t mean that the stock market expects companies to default in large numbers) and the VIX index, a measure of implied volatility in equities, is also near record lows. It’s worth remembering that in the 1970s, when inflation was out of control, equities did terribly, despite the link between dividends and inflation. Whilst dividends did rise, returns were destroyed by a collapse in the P/E multiple of equities. Could this be the reason for the gap between equity and linker yields – the expectation of high inflation causing multiples to fall? Unlikely again – over the next ten years the market expects RPI inflation to be around 2.5% (and this has fallen from 2.8% in June as the oil price weakens again). Neither do markets anticipate a deflationary future, with dividends being cut. Final explanations for the 4% yield pick-up therefore probably need to reflect the extraordinary monetary policy actions around the world (including QE), with negative nominal yields amid a savings glut dragging real bond yields down with them; and linked to those savings gluts we have extraordinary demand from pension funds for certainty. Having been structurally on the wrong side of the equity/bond trade (owning too many shares relative to their benchmarks linked to bond yields and inflation) over the years, pension fund de-risking is taking place as defined benefit schemes become mature. Index-linked bonds have structural demand, especially in the UK and the Netherlands.
As a trading tool, the chart above wouldn’t have helped you much – perhaps you would have sold equities at the start of the last decade, but when would you have bought them back? 2003? 2009? 2013? The market has kept making new yield spread highs thanks to the relentless rally in index-linked gilts. But on a valuation basis, you might well prefer the dividend yield of 3.8% plus growth on the FTSE 350 to the inflation linked -0.8% per year on 10 year index-linked gilts.
The value of investments will fluctuate, which will cause prices to fall as well as rise and you may not get back the original amount you invested. Past performance is not a guide to future performance.


18 years of comment
Discover historical blogs from our extensive archive with our Blast from the past feature. View the most popular blogs posted this month - 5, 10 or 15 years ago!


Bond Vigilantes
Get Bond Vigilantes updates straight to your inbox


