


The real data – the Phillips curve is alive and well
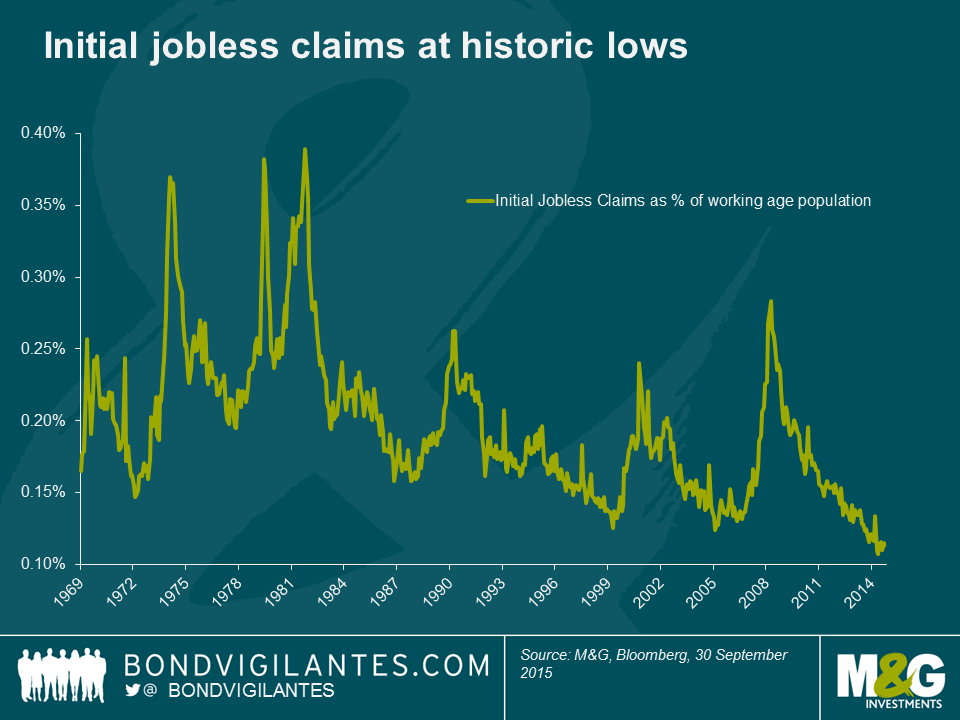
One of the first rules of economics is that the equilibrium market price is generated by relative supply and demand. Limited supply or excess demand should result in an increase in price. One of the questions that has arisen in the post financial crisis world is why have wages not increased despite unemployment heading towards historically low levels? Given the improvement in data such as headline employment, jobless claims, and the JOLTS (Job Openings and Labor Turnover Survey) data, the US economy should be experiencing higher wage pressures by now.
Thinking back to my tutorials from ex Bank of England guru Charlie Been, economists should not only take note of supply and demand when examining equilibrium rates. There was also lots of discussion of both nominal and real wages when examining the relationship between labour market equilibriums, and the cost of that labour.
Nominal wages in the US and UK are at historically low levels, implying that the relationship between supply and demand in the labour market is different this time. However, when we look at the relationship expressed as the real cost of labour it can be seen that the relationship between a tight labour market and rising wages is indeed present as expected.
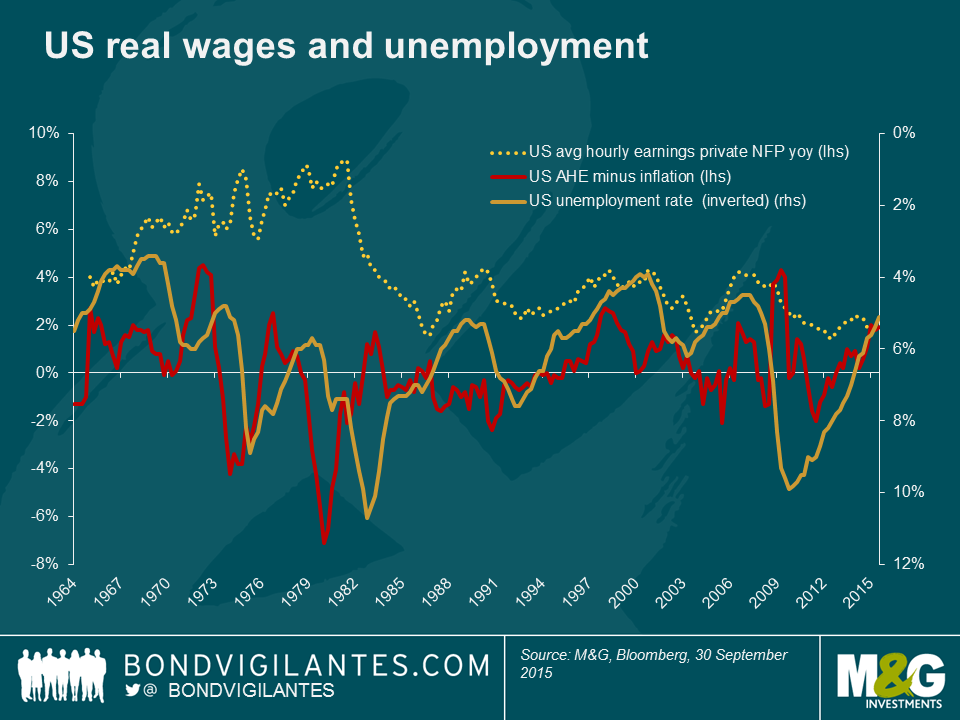
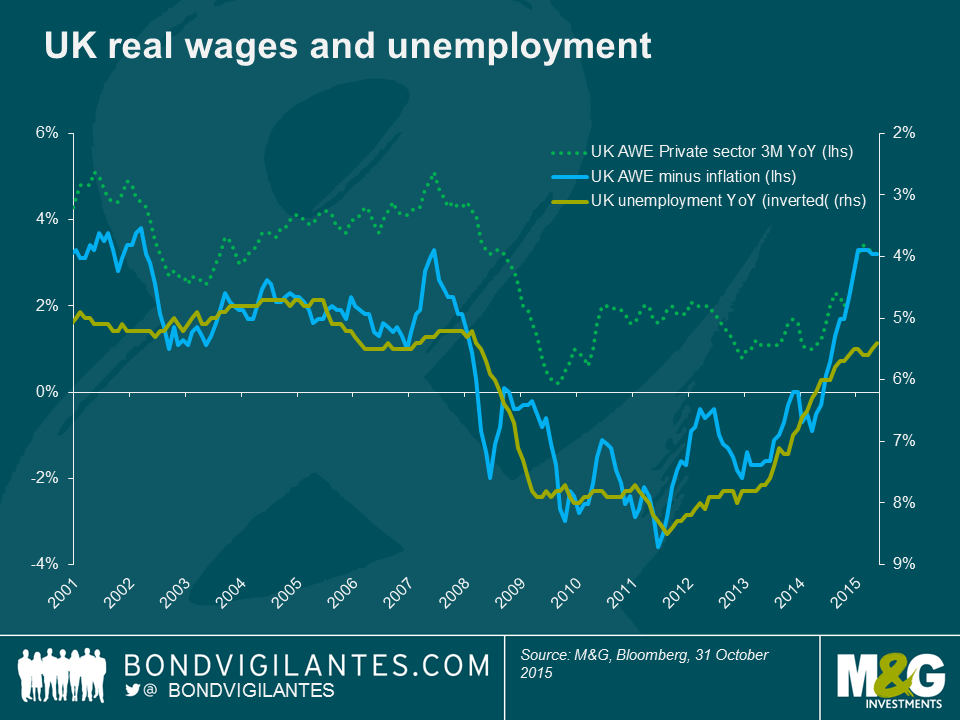
Those that argue that the current low rate of wage growth in nominal terms is the true depiction of the labour market would have to reflect on the problem of the mid 1970s experience, when a weak labour market was accompanied by rapid nominal growth in wages of 7 to 8 percent as seen in the US chart above. I argue that the labour market is tightening and wage growth is there in real terms. Looking at the data, it can be seen that the real cost of labour is more correlated with the unemployment rate (inverted in the charts above) than the nominal wage rate. The UK chart shows that nominal wage rates were pretty flat during the economic collapse and recovery in the UK, while real wages responded accordingly to the weakness and subsequent strength of the labour market.
We can therefore argue that the current data, and likely future data, imply the Phillips curve is still alive and well. The challenge the central banks face in hitting their inflation targets is that the price of other stuff (mainly oil) has (temporarily) collapsed, thus the strength in the labour market is currently masked. The economic rules of excess supply and demand are amply demonstrated in the depressed commodity markets, the low yields available in the QE-led European bond markets, and in the labour market.
The Fed and the Bank of England should recognise that labour data suggests rising inflationary pressures. Further attempts to strengthen growth via loose monetary policy will enable inflation targets to be hit sooner than would otherwise be the case, but once the deflation outside the labour market halts, central banks will be faced with the traditional problem of reducing (not increasing) inflation. This need for higher rates in the future implies that long term government bond yields near record lows do not need chasing.
The value of investments will fluctuate, which will cause prices to fall as well as rise and you may not get back the original amount you invested. Past performance is not a guide to future performance.
19 years of comment
Discover historical blogs from our extensive archive with our Blast from the past feature. View the most popular blogs posted this month - 5, 10 or 15 years ago!


Bond Vigilantes
Get Bond Vigilantes updates straight to your inbox