


The 2nd largest bailout in British history and its economic effects
The Slavery Abolition Act of 1833 formally freed 800,000 Africans who were then the legal property of Britain’s slave owners. What is less well known is that the same act contained a provision for the financial compensation of the owners of those slaves, by the British taxpayer, for the loss of their “property”. The compensation commission was the government body established to evaluate the claims of the slave owners and administer the distribution of the £20m the government had set aside to pay them off. That sum represented 40% of the total government expenditure for 1834. It is the modern equivalent of around £23bn.
The distribution of the £20m was entrusted to a Slave Compensation Commission which began to meet in October 1833 and included representatives of the Colonial Office and the slave registry. It worked on data collected by assistant colonial boards of compensation nominated by the governor in each colony, and compensation was allowed on slaves appearing on the books of the slave registry on 1 July 1835. Actual payment of the claims was made by the National Debt Office and began in 1835. The commission was terminated at the end of 1842, but one of the commissioners was appointed as an arbitrator to adjudicate upon outstanding claims. At the end of 1845 all money unappropriated reverted to the public purse. The registry continued in existence until 1848. Enslaved Africans received nothing.
Director of the Centre for the Study of the Legacies of British Slave-ownership at University College London, Dr Nicholas Draper, in his book The Price of Emancipation suggests that approximately half of the £20 million the British taxpayers paid in compensation to slave owners stayed in Britain. According to the BBC, slave-ownership wasn’t confined to the upper classes: an enslaved person was considered a sound investment. In 1833, middle class people including clergymen, naval personnel and people who had returned from the colonies were all slave-owners. Some purchased enslaved people, others acquired them through inheritance or marriage. Their value was based on skills, gender, age, health and the profitability of the plantation where they worked.
The compensation of Britain’s 46,000 slave owners was the largest bailout in British history until the bailout of the banks in 2009. Using data sourced from the Bank of England, it is possible to gain an understanding of the impact that this large monetary stimulus had on the UK economy. The payments to British slave owners represent a helicopter drop of money into a fairly closed economy, and the impact on growth, inflation, and asset prices should be directly observable.
According to government finances, the bailout was largely funded by government borrowing. In 1835, the public sector registered a deficit of -£15.2m, the equivalent of -2.8% of nominal GDP.

In the basic IS-LM model, the behaviour of the economic agents – consumers, firms, and the government – is reconciled by the product and money markets. The product market balances the demand for product by consumers, firms, and the government with national income. The money market balances the demand for money by consumers and firms with the supply of money provided by the government and the banks. The equilibrium the IS-LM model obtains is the demand equilibrium for the economy.
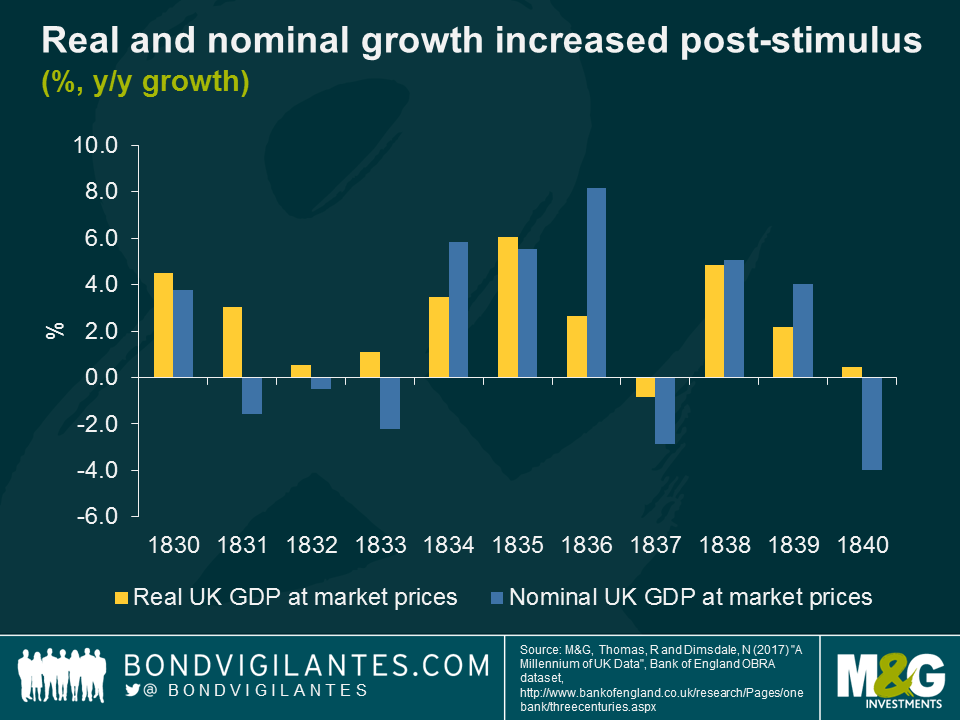
As the economic theory would suggest, the effect of a large cash stimulus was a spike in inflation. This is because the cash stimulus resulted in an increase in aggregate demand due to an excess demand for goods and services. After a four year period of deflation between 1832-35, inflation skyrocketed by almost 10% in 1836.

The increase in aggregate demand resulted in a short-term boost in output. Since in the long-run output is determined by supply factors, a fiscal expansion cannot permanently increase output above its long-run full employment level. Nominal GDP grew by over 8% in 1836, with real GDP rising by 2.6%. In 1837 the economy contracted in both real and nominal terms before returning to positive growth in 1838.
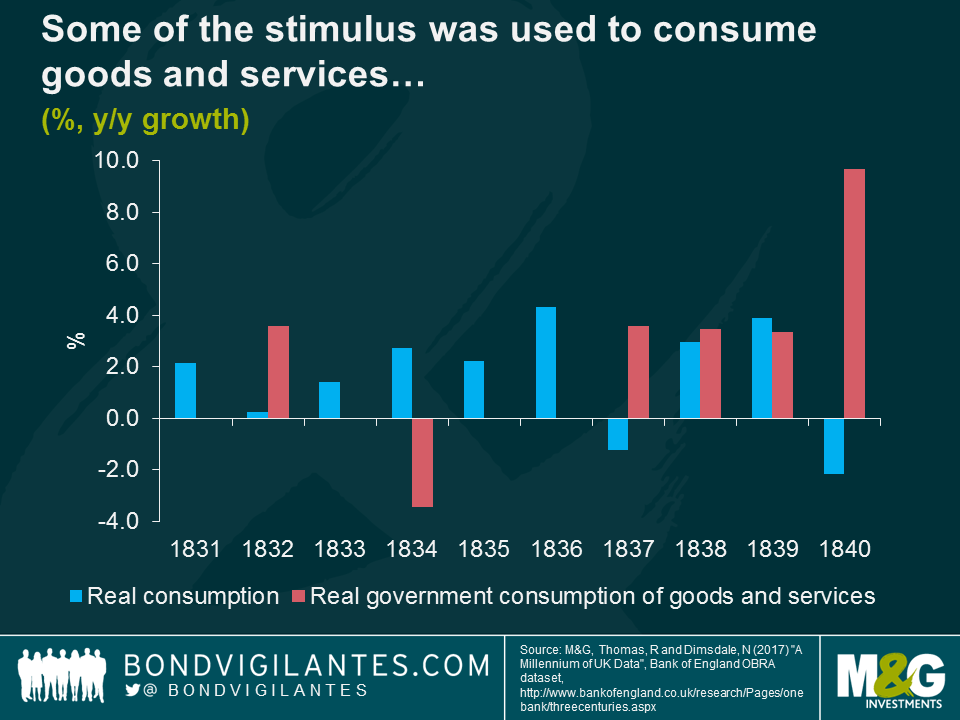
Looking at the drivers of economic growth during the period following the payments, consumption growth almost doubled to 4.3% in 1836. Government spending on goods and services was flat as it had been for most of the preceding years. This is unsurprising given the lack of any social net. Government expenditure was almost entirely spent on defence or spent on servicing the national debt (UK debt to nominal GDP was 155.1% in 1835 and 50% of government expenditure was used to service the debt).
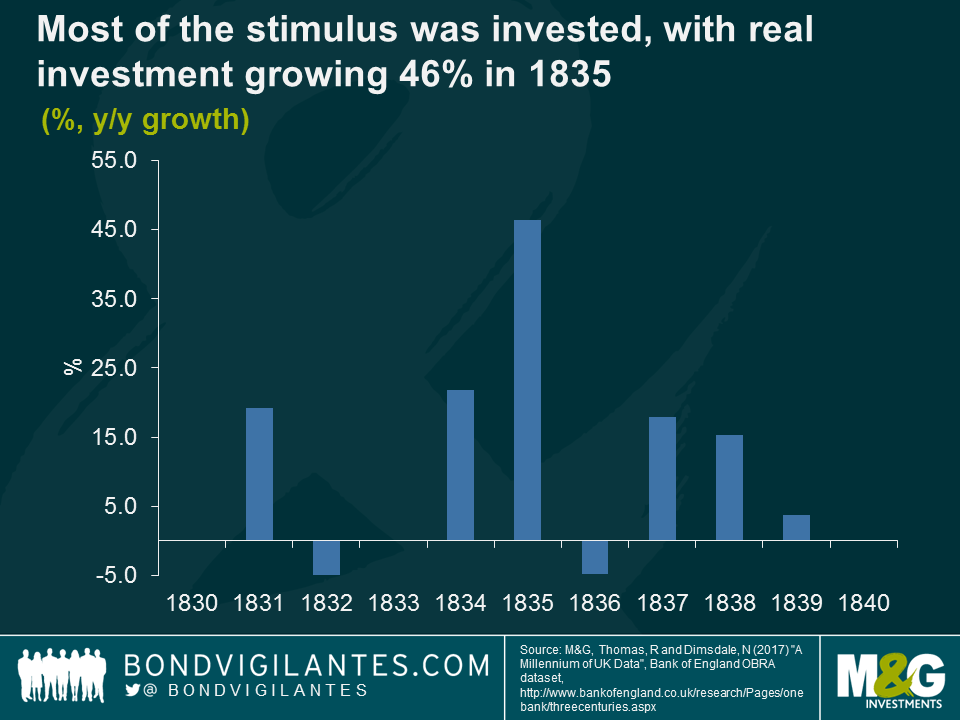
The main impact of the cash stimulus into the UK economy was on private investment which grew by over 46% in 1835. Proceeds of the government bailout were invested in a number of industries including railways, construction, banks, insurance and shipping.
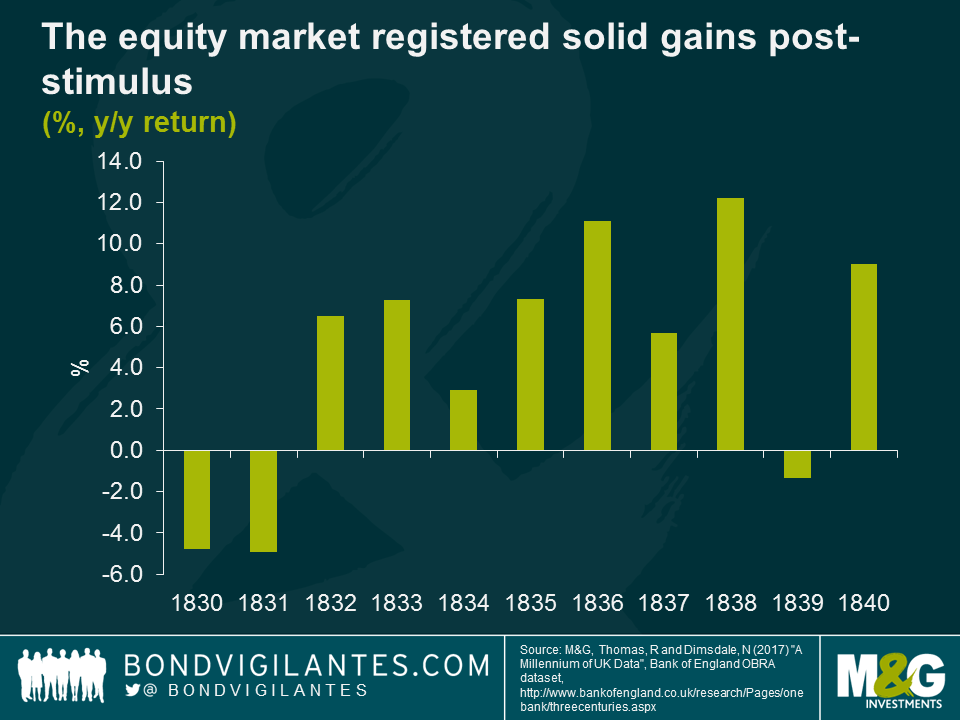
The equity market registered strong gains for most of the 1830s, including an 11% rise in 1836, 6% in 1837 and 12% in 1838. Share prices may have risen as investors recycled cash into shares in corporations. Dr Draper claims that as many as one fifth of wealthy Victorian Britons derived all or part of their fortunes from the slave economy and that up to 10 per cent of Britons who died in the 18th century had benefited.
The amount of money available to the compensation fund reflects how much influence elite Victorians had on the UK government of the day. The fiscal injection of cash into the economy had textbook consequences including an increase in GDP, high inflation and rising asset prices. It is an interesting economic event from Great Britain’s distant past, albeit one generated from the horrors of slavery.
The value of investments will fluctuate, which will cause prices to fall as well as rise and you may not get back the original amount you invested. Past performance is not a guide to future performance.
19 years of comment
Discover historical blogs from our extensive archive with our Blast from the past feature. View the most popular blogs posted this month - 5, 10 or 15 years ago!


Bond Vigilantes
Get Bond Vigilantes updates straight to your inbox