Does the U.S. yield curve predict wider credit spreads? Also, goodbye to Hamish Watson
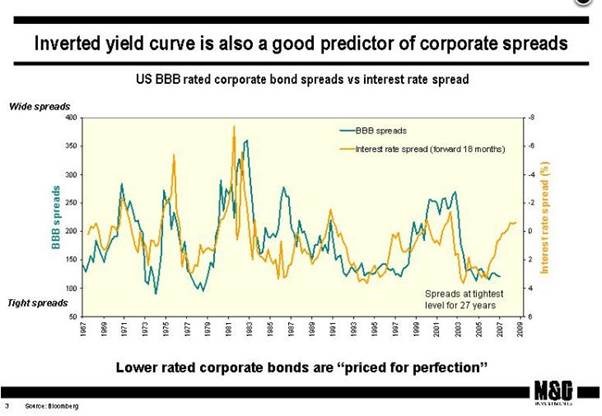
As the U.S. yield curve flattened to just 45 bps (2s-10s) last week, we dug out something I wrote back in 2007, in the early days of this blog. A chart that accompanied the blog showed that a) U.S. BBB credit spreads had hit their tightest level for nearly 3 decades and b) that the yield curve had flattened substantially (and in fact inverted). If you pushed the yield curve shape chart 18 months into the future it seemed to have a remarkable predictive power for what credit spreads would do next (not entirely surprisingly, as a flatter yield curve is traditionally a good indicator of economic slowdown). Thus, in 2007 it appeared to predict a big selloff in corporate bonds. Of course, all that happened, and more – credit spreads jumped to levels far higher than the 200 bps implied by the curve, as the Great Financial Crisis hit. But the directional call was sound.
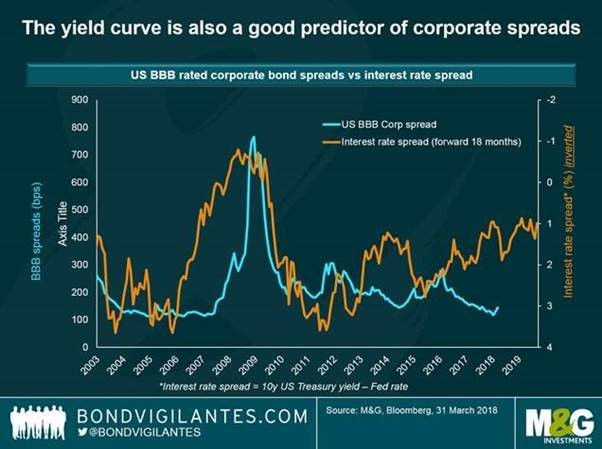
By popular demand. we’ve just updated the slide for the period since the Great Financial Crisis. As in the earlier chart we have extremely tight credit spreads (at similar levels to those seen in 2007), and like then the yield curve is very flat, although not in inverted, recession predicting territory.
Similar to 2007, there is a gap between the continued strong performance of BBB credit spreads, and the shape of the U.S. yield curve. Looking at the most recent data you would think that there is a good chance that credit underperforms from here. However, eyeballing the chart it’s also clear that the directional relationship between the two series is nowhere near as strong as it was pre-GFC. Look at the period 2012 to 2015 for example: the yield curve flattened substantially from +375 bps to just over +100 bps. Yet BBB credit spreads tightened aggressively over the same period. Of course, the post GFC world is also a world where quantitative easing from central banks drove an aggressive search for yield from investors, which not only reduced credit spreads, but consequently allowed corporates to borrow at lower rates of interest. Thus, default rates plummeted and the credit cycle has been incredibly elongated. Perhaps though the tailwind for this cycle is ending as quantitative easing tapers away, and central banks raise rates. The flattening yield curve must at least be a warning that credit valuations are now stretched.
Whilst I’m blogging again (I took most of the year to date off, having a social media break) I’d like to pay tribute to my friend and old Bank of England boss Hamish Watson, who died recently. Hamish gave me the chance to move out of the world of financial statistics (remember M4?) at the Bank and taught me everything I know about bond maths on the Bank’s gilt desk which he ran. He subsequently was one of the first staff members at the new Debt Management Office set up after Gordon Brown made the Bank independent in 1997. Hamish was a massive sports fan, and saw his beloved Aberdeen FC lift the Cup Winners’ Cup in Gothenburg in 1983. He was also Eddie George’s bridge partner (rather him than me – I trembled when the Governor even entered the room in his cloud of smoke). I doubt anybody knew more about gilts than Hamish did, and he was a genuine expert in his field, saving the taxpayer money by getting us a good price for ever increasing bond issuance. We’d meet for beers after he retired in the Blue Anchor by Hammersmith Bridge. He’ll be missed.
The value of investments will fluctuate, which will cause prices to fall as well as rise and you may not get back the original amount you invested. Past performance is not a guide to future performance.


18 years of comment
Discover historical blogs from our extensive archive with our Blast from the past feature. View the most popular blogs posted this month - 5, 10 or 15 years ago!


Bond Vigilantes
Get Bond Vigilantes updates straight to your inbox


