Corona-Crunch: one of the most violent corrections on record
A lot can change in a month. While many of us grapple with the new daily regime of lockdowns, remote working, home schooling and scouring the shops for that last fabled toilet roll, it’s worth taking a moment to review what has happened to credit markets over the past few weeks.
Even in social isolation, one would be hard pressed to miss news headlines reporting the sell off in equities and corporate bonds following the evolving threat of a global pandemic and what this could mean for growth, consumption and corporate solvency. It’s now broadly accepted that most developed countries will enter recession—but for how long and how deeply?
Falling bond prices have led to a rapid widening in credit spreads led by USD bonds. USD investment grade bond spreads are now trading at 11 year wides, last seen during the Global Financial Crisis (GFC). In fact, USD investment grade bond spreads are trading wider today than USD high yield spreads were back in February. EUR investment grade bond spreads have fared somewhat better, trading at levels last seen 8 years ago during the European Debt Crisis.

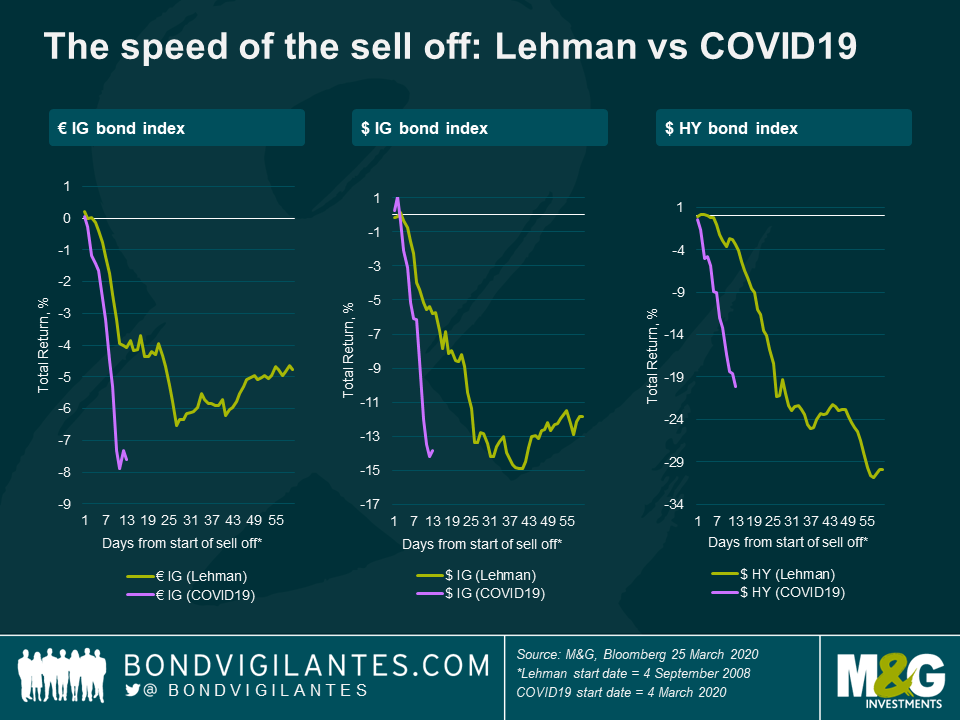
Perhaps what has been most noticeable this time is the speed and magnitude of the price moves, which make this one of the most violent corrections on record.
During the collapse of Lehman Brothers in 2008, it took USD IG bonds 37 days to fall by -14.5%. This time the same decline took only 12 days. Similarly, during the Lehman collapse, EUR IG bonds took 27 days to fall -6.5% while this time it took fewer than 11.
The aggressive pace of repricing is also evident across many other facets of credit.
Credit quality
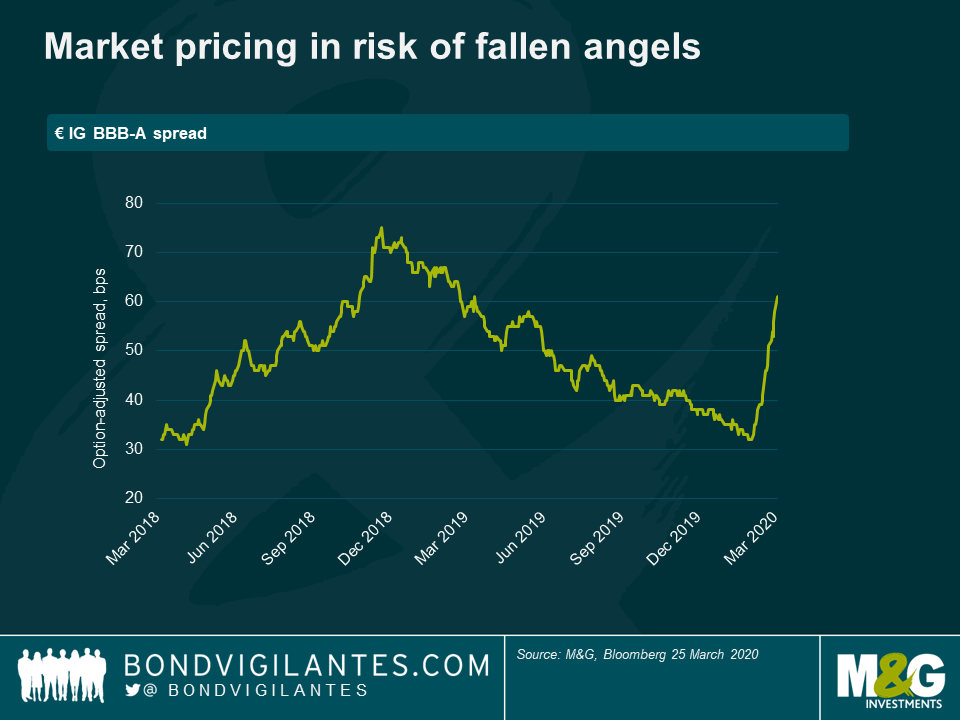
Lower quality BBB credits have steadily underperformed single-As, indicating a flight to quality as the recessionary risk of falling angels (companies rated at the bottom of the investment grade spectrum, BBB, falling into high yield) rises.
Credit term structure
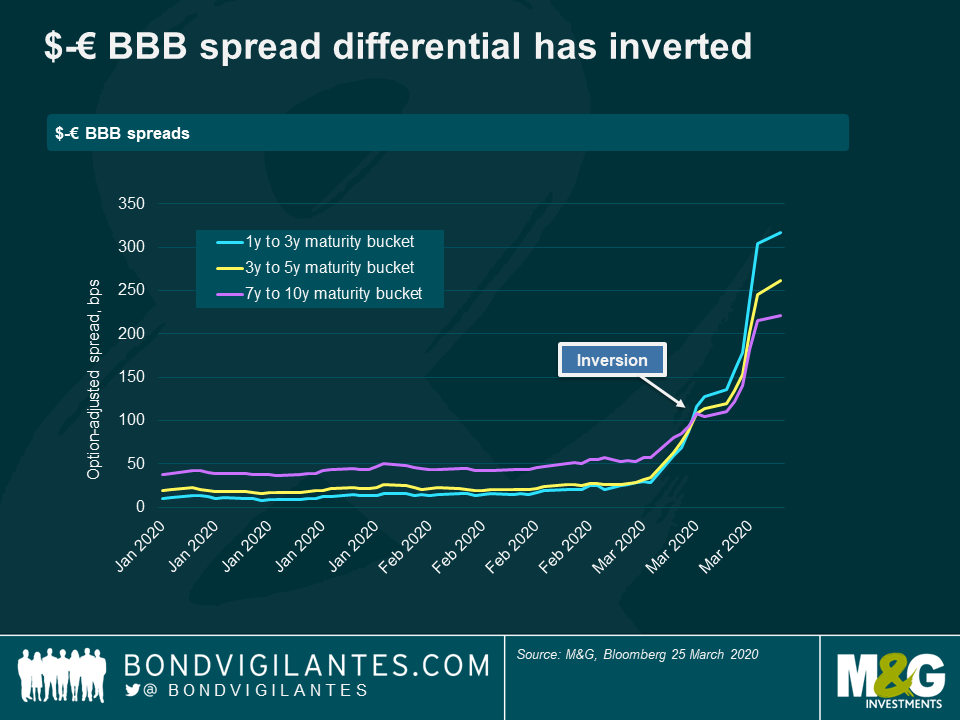
Flattening of the IG credit curve has accelerated and nears inversion. Part of this has been driven by a bias from asset managers to sell down short-dated IG credit in order to meet redemptions, in favour of crystallizing losses on longer-dated paper.

Cross-currency credit spreads
The $-€ BBB spread differential has not only widened significantly over the past month but inverted, further demonstrating liquidity stresses on the short-dated part of the credit curve.
Euro financials vs industrials
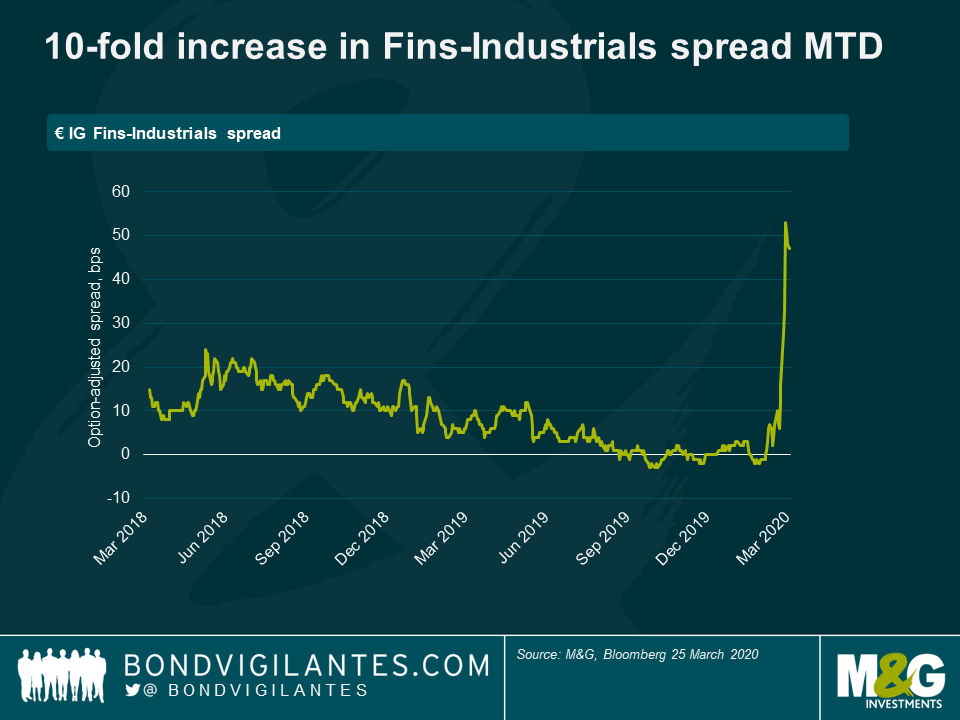
There have also been big changes in inter-sector valuations: the market now prices financials at an excess spread of more than 50 bps relative to industrials, a 10 fold increase from a few weeks ago.
Euro Industrial subsectors
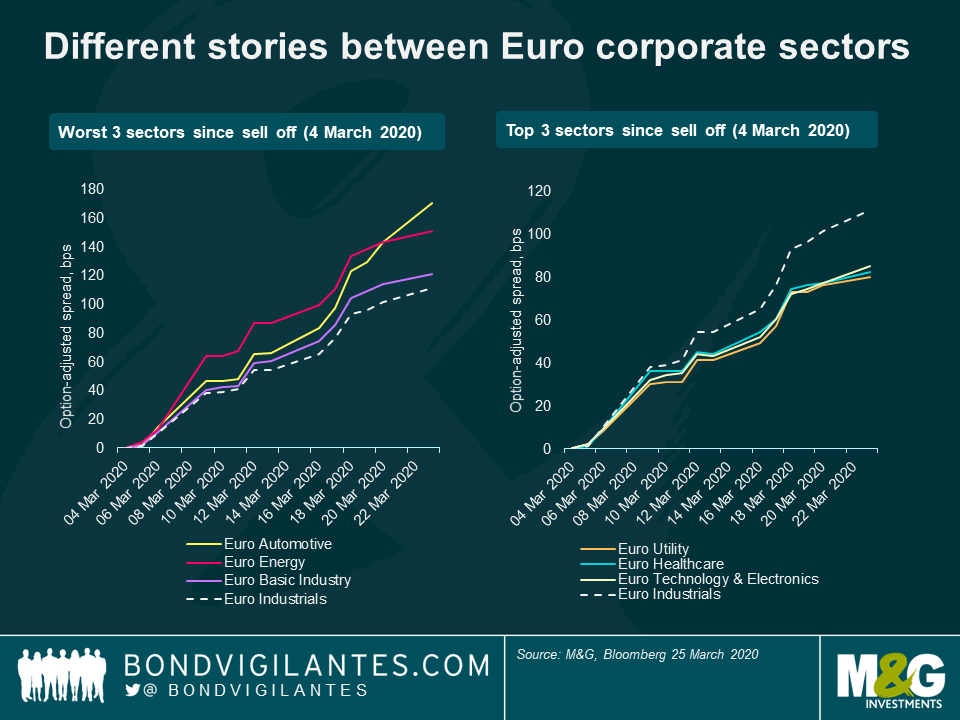
Within the Euro industrials, it’s unsurprising to see those industries most sensitive to a deteriorating growth outlook lagging the Euro corporate bond index, namely autos, energy and basic industry.
At the other end of the spectrum, those industries that have outperformed (at least on a relative value basis) are those likely to benefit from lower rates (Utilities), greater demand for health-related services (Healthcare) and those services that will enable us to adapt to new ways of living and working (Technology).
Such extreme moves are understandable given the unprecedented (at least in modern times) viral outbreak of COVID19. As my colleague Richard Woolnough points out, this time is different.
However, there are other factors at work here that have intensified the moves. The most notable is the evaporation of liquidity in some of the most liquid bond markets. There are likely several contributing factors, all inter-related.
For one, market participants have been uprooted from their normal trading floor environments. Many have been moved to disaster recovery sites, split up into multiple sub-teams or isolated at home. This naturally slows down communication and the market making process.
Secondly, with front office, ops and tech staff split up, many trade matching algorithms have been turned off, slowing down price discovery and forcing dealers in some cases to match orders manually.
Thirdly, there is an inability for dealers to expand their balance sheets and commit principal capital at times of greater demand for liquidity. The pro-cyclical nature of regulatory capital rules requires banks to hold more capital as volatility rises, in turn taking liquidity out of the system when it needs it the most.
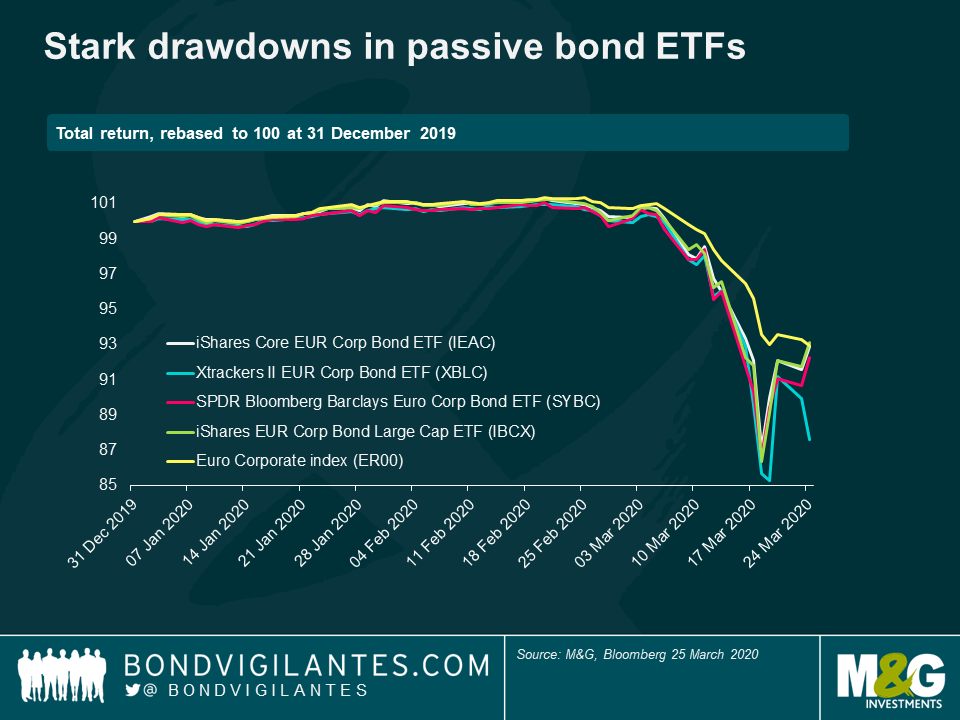
Finally, outflows have been severe. One segment of the market that has been hit particularly badly is passive bond ETFs. They have grown exponentially over the past decade, promising retail investors close to benchmark returns, low costs and instant liquidity. However, the liquidity mismatch between ETF prices and their underlying bonds has caused many ETF prices to swing significantly below their net asset value. This is a function of poor dealing liquidity (wide bid-offer spreads) as described above. This in turn creates further forced selling, putting still further pressure on bond prices and creating the so called “doom loop”. While some of the ETFs have started to recover, the drawdowns have been stark.
No doubt more will come to light over the coming weeks and months. Several governments have announced new bond buying programmes (notably the US and UK), while others have increased existing asset purchases (EU). This type of policy response aims to address directly the aforementioned liquidity challenges. Ultimately this should work, assuming that these efforts are coordinated and implemented swiftly. This, given past experience, is possibly the biggest risk of all.
The value of investments will fluctuate, which will cause prices to fall as well as rise and you may not get back the original amount you invested. Past performance is not a guide to future performance.


18 years of comment
Discover historical blogs from our extensive archive with our Blast from the past feature. View the most popular blogs posted this month - 5, 10 or 15 years ago!


Bond Vigilantes
Get Bond Vigilantes updates straight to your inbox


