A Must-See Graph for Bond Investors: The WEF Global Risks Interconnections Map
Summary: A few days ago, the summer version of the annual World Economic Forum was cancelled due to the worsening COVID-19 situation in Singapore. As a result, we may need to wait slightly longer for an update of the Global Risks Interconnections Map
As bond investors, it’s important that we can adequately price the underlying risks of an asset, considering the various non-financial risks that can impact the economic performance, which can in turn affect the value of an investment.
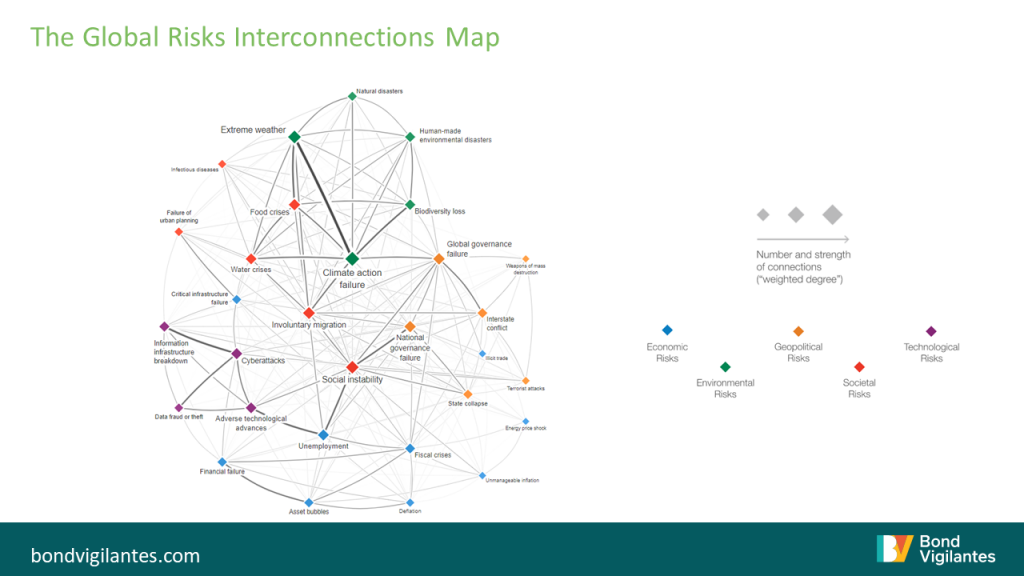
The map below illustrates how global risks are interconnected and brings to light why climate risk has emerged as the most important ESG factor for institutional investors. In short, a failure to solve the climate crisis affects investors in multiple ways.

Source: World Economic Forum Global Risk Perception Survey, 15th January 2020
https://www3.weforum.org/docs/WEF_Global_Risk_Report_2020.pdf
Climate change is defined as a change of climate which can be attributed to human activity that alters the composition of the global atmosphere in addition to natural climate variability. Climate change disproportionally affects the most vulnerable part of the population, through various avenues such as food insecurity, adverse health impacts or population displacements.
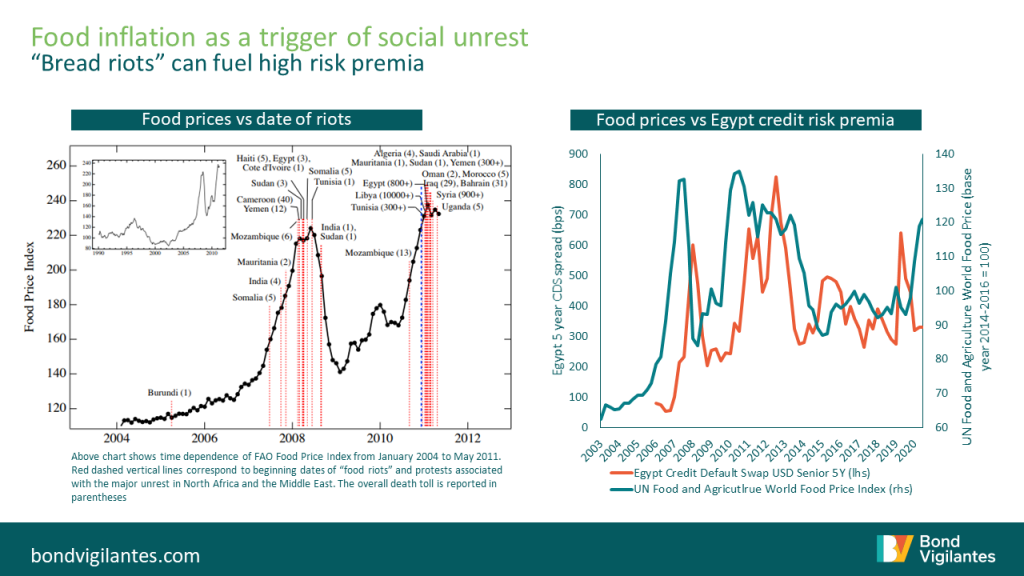
The Bloomberg Agricultural Commodity and Livestock index is trading up +20% since the start of the year and approaching its 5 year high, bringing these dynamics to the forefront of investors’ minds. Arguably, this time around, the rise in food prices is largely a result of pent up demand as economies around the globe start to reopen following government enacted lockdowns. However, part of the price increase can also be explained by supply constraints related to challenging weather conditions. With food being a significant component of the emerging markets consumption basket, history has shown frequently how higher food prices can impact economies, particularly those heavily reliant on food imports. For example, ten years ago, the world witnessed an unprecedented wave of civil protest known as the Arab Spring. The revolution came at a time when food prices started to rise, intensifying various other social issues in the Middle East. A paper written by the New England Complex Systems Institute argues that there is a direct link between the dates of riots in the Middle East and the price of food. While high global food prices on their own are unlikely to be a reliable indicator of social unrest, it can however be an important variable when it coincides with other economic challenges such as rising unemployment, limited fiscal policy space or high income inequality. Back in 2011 when the riots in Egypt intensified, the country was experiencing double-digit unemployment as well as rising inflation. The result of the uprising is well known: a prolonged period of social unrest which led to increased market volatility and a spike in credit risk premia.

Source: New England Complex Systems Institute, https://arxiv.org/abs/1108.2455 2011. Bloomberg, 25 May 2021
Environmental issues can feed through to economic risks in multiple ways, which is demonstrated via the interconnections map. For example, the failure to mitigate climate change results in more frequent extreme weather events (droughts, wildfires, flooding), leading to a food or water crisis. Large-scale involuntary migration can then lead to a worsening of interstate tensions which, in its worst form, can potentially lead to conflict and terrorist attacks. This, in turn, can affect the stability of an economy, lead to a rise in unemployment, affect political stability and impact the economic output, all resulting in higher risk premia for bonds. While there are certain economies directly exposed to climate risk such as Zambia, a country which generates 90% of its energy via hydroelectricity, most countries are indirectly impacted by climate change via other channels.
Given climate change is such an intricate topic, it is hard to capture the adverse impacts of inaction and I would argue that traditional financial risk models do struggle to capture the complex nature of such non-financial risks. The WEF interconnections map helps to untangle some of it, highlighting why major economies around the globe are ramping up climate actions with new regulations. The UK has committed to a net-zero carbon emission target by 2050, and so has the EU via its green deal which targets a bloc wide goal of net zero by 2050. Last year, China pledged to become net-zero by 2060 and on day one of President Biden’s term, the US re-joined the Paris Agreement and set a course to tackle the climate crisis by reaching net zero emissions economy-wide by no later than 2050. Such commitments from economic power houses come with new regulations and new opportunities, both directly impacting the competitive landscape of many companies. Assessing the impacts of this for corporate valuations should, in my opinion, be a priority for every bond investor, in order to properly assess the risk-reward of each individual security and understand the correlations as well as potential shocks to every bond portfolio – consulting the WEF Global Risks Interconnections Map is a welcome step in this process.
The value of investments will fluctuate, which will cause prices to fall as well as rise and you may not get back the original amount you invested. Past performance is not a guide to future performance.


18 years of comment
Discover historical blogs from our extensive archive with our Blast from the past feature. View the most popular blogs posted this month - 5, 10 or 15 years ago!


Bond Vigilantes
Get Bond Vigilantes updates straight to your inbox


