


It’s Halloween again – time for some scary charts
Financial markets have been remarkably resilient so far this year after the turbulence of 2020 and with uncertainty still abounding. Here are seven scary charts to wake investors from their slumber.
1. It’s been a scary couple of years… but things could get even scarier
It’s certainly been a scary couple of years – but things could get even scarier. With the UN Climate Change Conference approaching, important progress is being made by governments on trying to halt the planet’s warming. With ever-growing demand for ESG and sustainable investing, investors are increasingly trying to play their part too.
This is a seismic shift versus five or ten years ago. ESG is very much now front and centre. The scary part of this transition from any bond investor’s perspective is the risk of stranded assets down the line. If you lend to an oil extractor now for 30 years, will you actually get your money back? On the other hand, remaining invested allows a seat at the table to engage with companies and encourage a responsible outcome.
Investments aside, even scarier is the fact that, at a time when the world desperately needs global emissions to be cut, they are actually rising. Have we even reached peak emissions? This will be a crucial decade – let’s hope progress is made at the UN Conference in Glasgow next month.
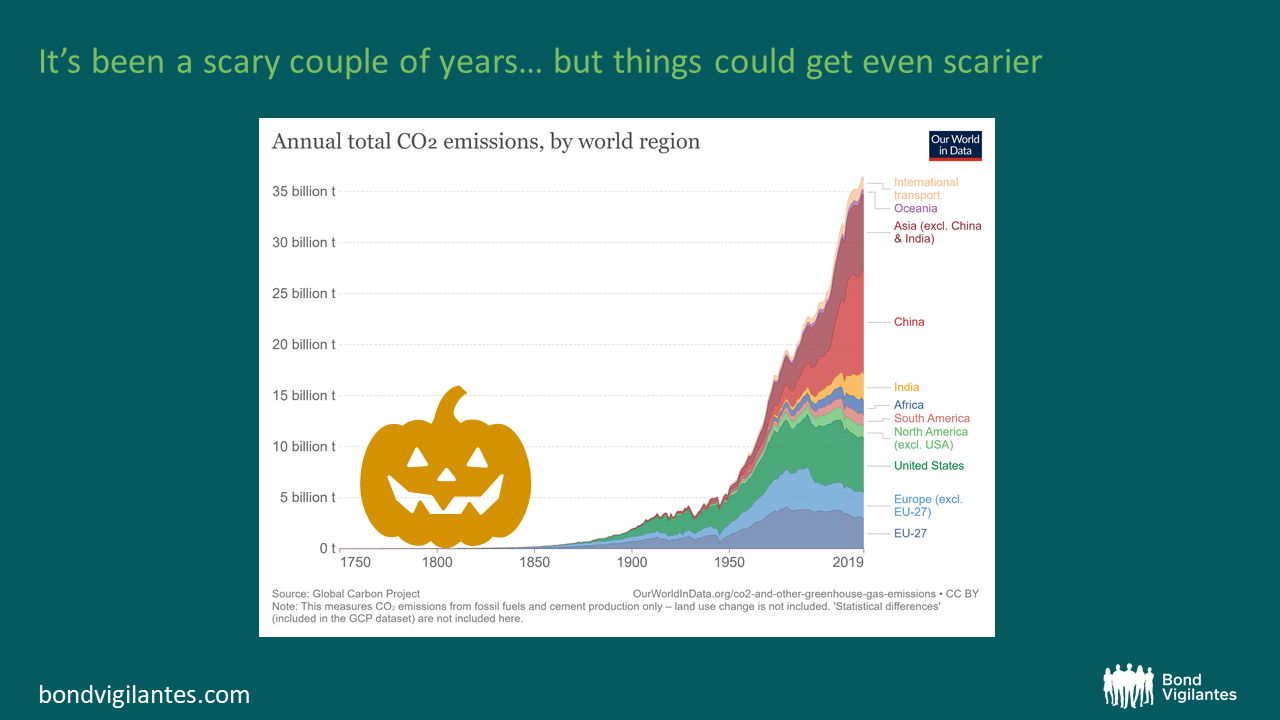
Source: Hannah Ritchie and Max Roser (2020) – “CO₂ and Greenhouse Gas Emissions”. Published online at OurWorldInData.org. Retrieved from: ‘https://ourworldindata.org/co2-and-other-greenhouse-gas-emissions’ [Online Resource]
2. Evergrande’s current liabilities are almost 2% of Chinese GDP
Global bond markets were spooked recently as, in mid-September, China’s largest real estate company Evergrande showed signs of weakness. Highly leveraged, and with various bonds maturing before the end of the year, the news sent shudders through the market.
Even though markets outside of Asian HY seem to have suffered no contagion as yet, it is scary to note that Evergrande’s liabilities are almost 2% of Chinese GDP. To put this into context, Apple’s current liabilities are 0.5% of US GDP ($107.7bn current liabilities vs 21.4trn US GDP).
This prompted the PBoC to intervene and make it clear this would be a contained event. Looking at the roll off of Asian housing stocks, here is a scary reminder that bonds can still be highly volatile instruments, even when the central bank offers a supportive hand. If the PBoC decides not to support Evergrande and the real estate sector going forward, we will likely see more violent moves down as defaults start to stack up. Thus far the year-to-date fall in the Asia Real Estate HY index below is 30%.
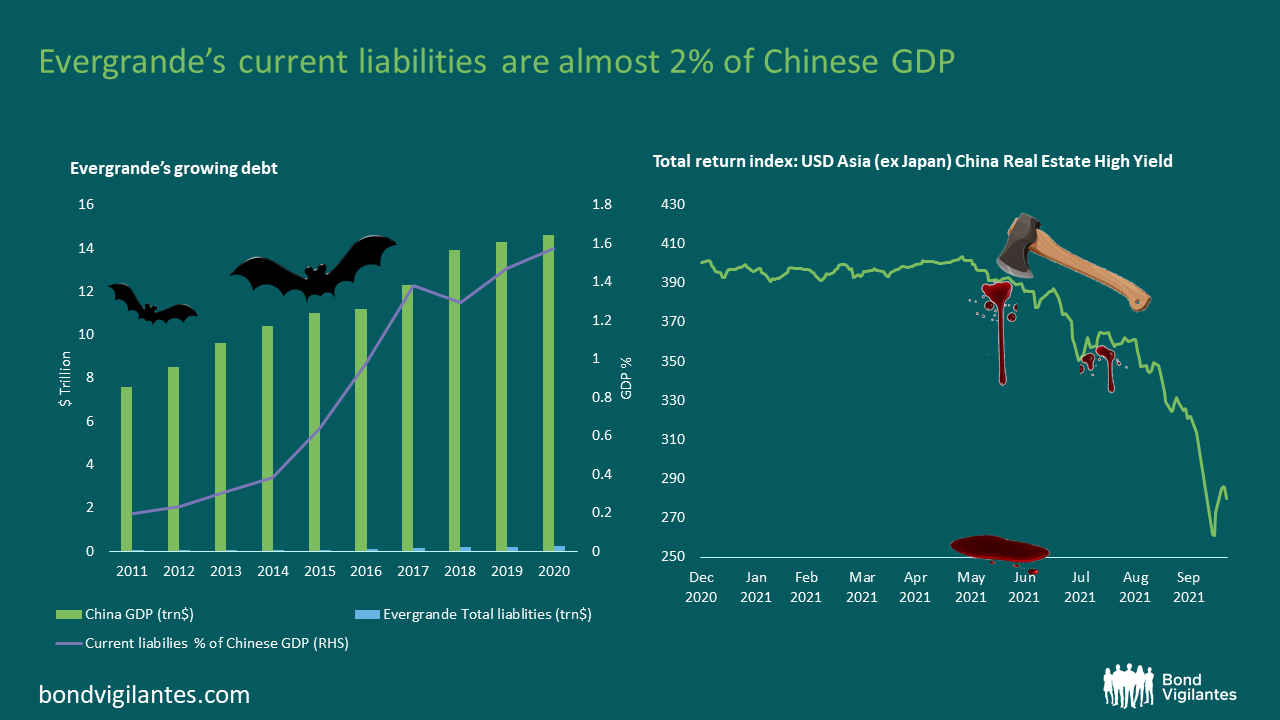
Source: Bloomberg 22 October 2021.
3. A strange recession: labour pressures at multi-decade highs
One of the scariest things bond investors have had to contend with this year has been the risk of a return of inflation. While few expect double-digit inflation ahead, there is a risk we could see some persistently higher inflation prints than we’ve been used to over the past decades.
As the left chart below shows, this has been a very strange recession – they don’t normally hand power to workers. That seems to be what has happened this year though, with signs of a tight labour market and employers having to complete for workers: the National Federation of Independent Business’s “Jobs Hard to Fill” index is running at record highs.
With other inflationary pressures mounting, wage pressure could fan the flames and lead to higher inflation than we have been used to for some time. Looking at the right chart, consumers certainly seem to be pricing in that possibility.
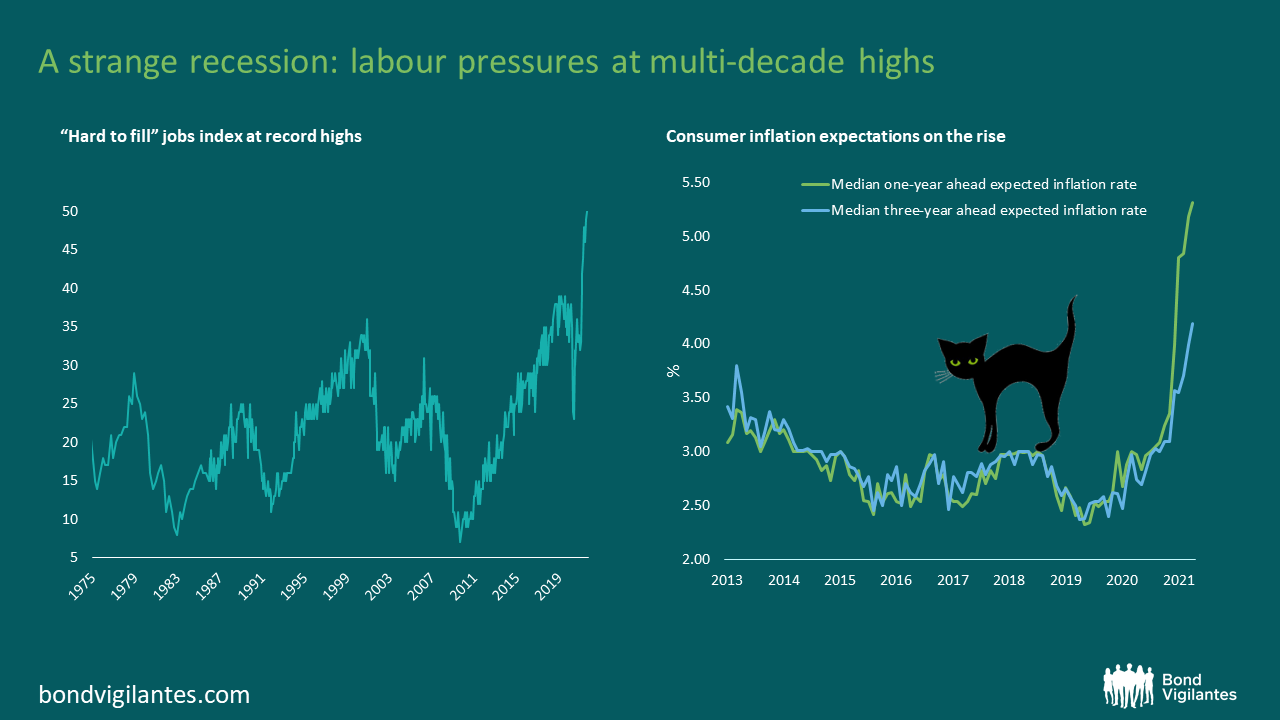
Source: (LHS) Bloomberg, 30 September 2021 (National Federation of Independent Business Jobs Hard to Fill Index) / (RHS) “Survey of Consumer Expectations, © 2013-2021 Federal Reserve Bank of New York (FRBNY). The SCE data are available without charge at http://www.newyorkfed.org/microeconomics/sce and may be used subject to license terms posted there. FRBNY disclaims any responsibility or legal liability for this analysis and interpretation of Survey of Consumer Expectations data.”
4. Natural Gas prices have skyrocketed
Continuing on the theme of inflation… remember when the British gas logo used to be a small, blue ghost? These natural gas prices should send ghostly shudders through the bones of anyone who needs to fill a gas tank this quarter.
Prices have risen 292% year to date, 94 times the rate of UK inflation and far ahead of UK wage growth at 7.1%. Figures are scary across the board: if you’re based in Europe, gas prices have risen 85 times the rate of the Euro area inflation and far ahead of European wage growth at -0.4%. For the US, 54 times the rate of US inflation, far from US wage growth at 9.5%.
A tank of gas used to cost £580 with futures prices around $50… Now, with prices closer to $230, the maths gets terrifying…
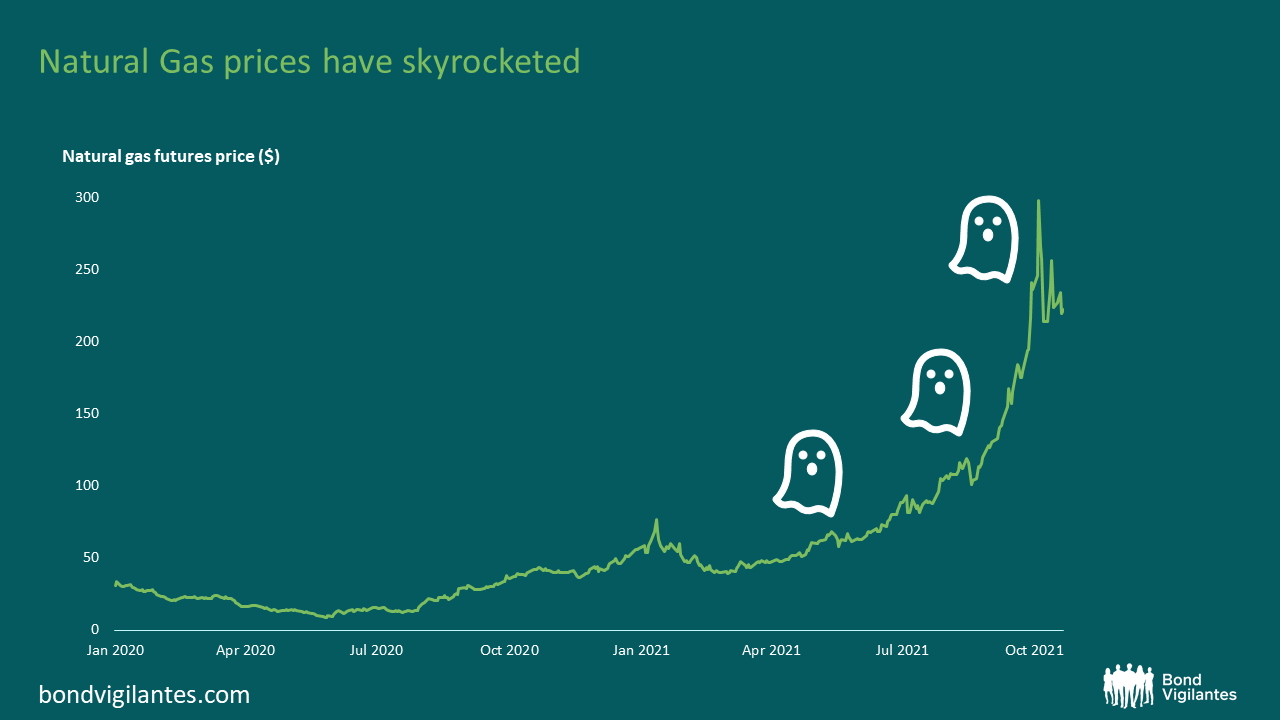
Source: Bloomberg 22 October 2021
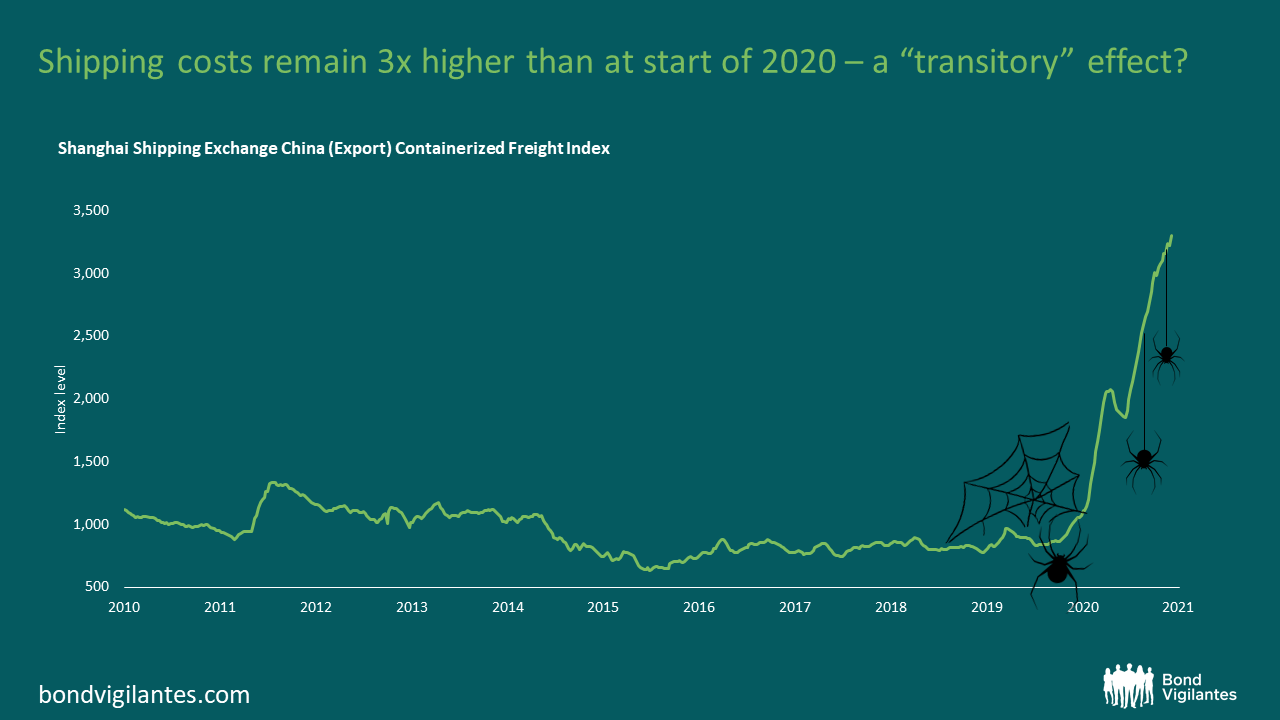
5. Shipping costs remain 3x higher than at start of 2020 – a “transitory” effect?
Many have pointed to the inflation we have seen so far as being “transitory”. There are plenty of reasons to believe this, but it is spooky to consider if this is really the case.
On top of a loss of companies and therefore competition to the recession, shipping costs remain persistently high, placing further supply-side inflationary pressure on the economy. With shipping costs still triple what they were a couple of years ago, is inflation really as transitory as many believe?
Source: Bloomberg 16 October 2021
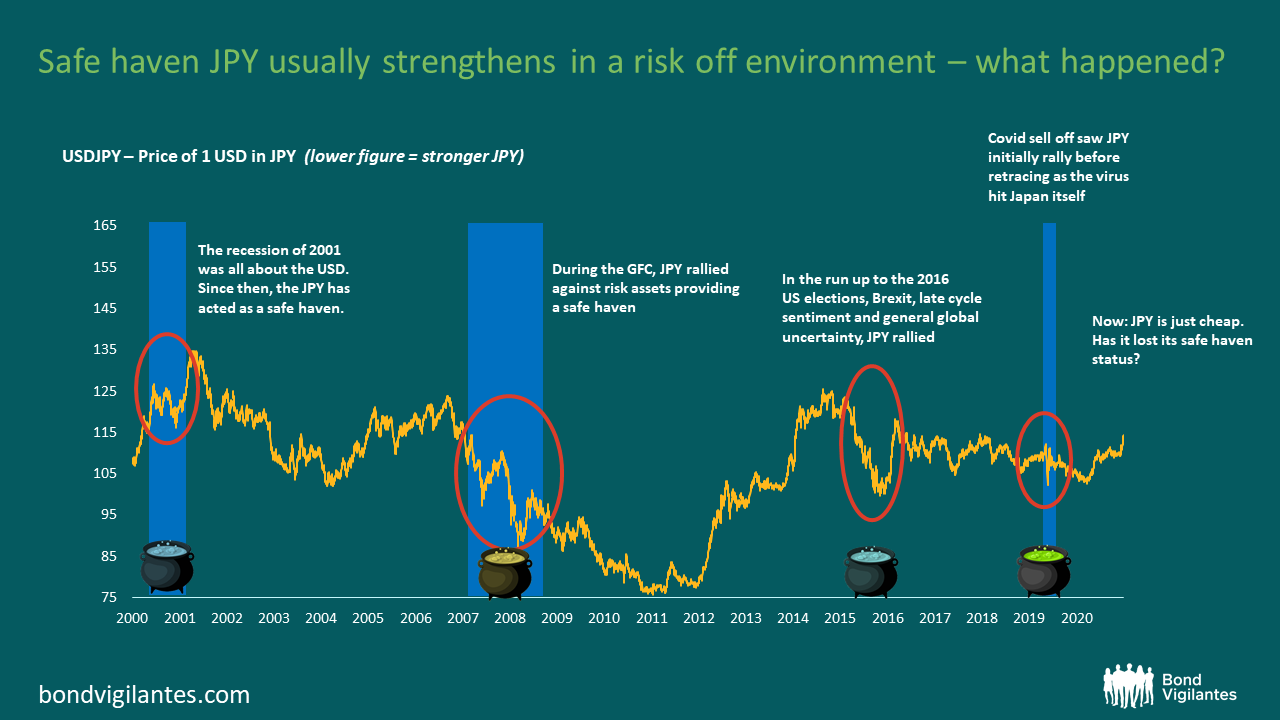
6. Safe haven JPY usually strengthens in a risk off environment – what happened?
With these macro risks on the horizon, can investors rely on the traditional safe havens to protect themselves?
Traditionally, the JPY has worked outside of the risk on currencies. It has acted with fairly low correlation to risk assets, and even traded with negative correlation with HY, EM and other high beta asset classes over long time frames. Many investors therefore use it as a safe haven. This time, however, JPY seems to have lost its touch. USD has strengthened in the last few months leaving JPY behind. Why is this?
There are several reason we can highlight here but all have been hurting our heads lately. Firstly, a change in leadership is not usually currency-positive, at least initially. Secondly, the CNY has barely moved on the back of all of the Evergrande volatility. The PBoC is keen to formulate the narrative that CNY could be the next Asian reserve currency, meaning that right now CNY JPY is a buy. The Chinese economy is also increasingly important to Japan, while high import prices and a weaker Chinese economy play a role too. Japanese exports to China now are higher than they were to the US 20 years ago, so a weak Chinese economy weighs on Japan and JPY.
Thirdly is the simple narrative that the USD is a buy right now with the prospect of higher US rates. JPY has been cheapening as Treasuries rise, and interest rate differentials are being squeezed as Japan’s central bank remains accommodative. The low yielding currencies will all struggle versus USD now, while others (like CHF) have caught up on the rate differentials making JPY not so much of a standout anymore.
So we have a weird combination of a high volatility environment with much uncertainty, but a narrative of stagflation/stronger USD which is JPY-negative. The safe haven is gone at least for now.
Source: Bloomberg 22 October 2021
7. In 2020, the market differentiated between sectors – not so this year
Elsewhere in bond markets, valuations are looking very tight. Looking below the surface in European credit markets, there is also surprisingly little spread between valuations of different sectors.
In the height of the Covid sell off of March 2020, the market clearly differentiated between sectors. Within Euro industrials, unsurprisingly those industries most sensitive to a deteriorating growth outlook (autos, energy and basic industry) significantly lagged the Euro corporate bond index (white line). Meanwhile, the industries that proved more resilient were those likely to benefit from lower rates (utilities), greater demand for health services (healthcare) and those aiding a shift to new ways of living and working (technology).
Now, with credit spreads having ground slowly tighter all year, the market doesn’t seem to be differentiating that much at all, with dispersion in this case having decreased five times over. A sign that credit markets are getting too complacent? Or justified in a low default environment? It is certainly scary to see how far we have come in valuations with Covid uncertainly still there.

Source: Bloomberg 18 October 2021
The value of investments will fluctuate, which will cause prices to fall as well as rise and you may not get back the original amount you invested. Past performance is not a guide to future performance.
19 years of comment
Discover historical blogs from our extensive archive with our Blast from the past feature. View the most popular blogs posted this month - 5, 10 or 15 years ago!


Bond Vigilantes
Get Bond Vigilantes updates straight to your inbox