The knock on effect of falling house prices – crystal ball breaking
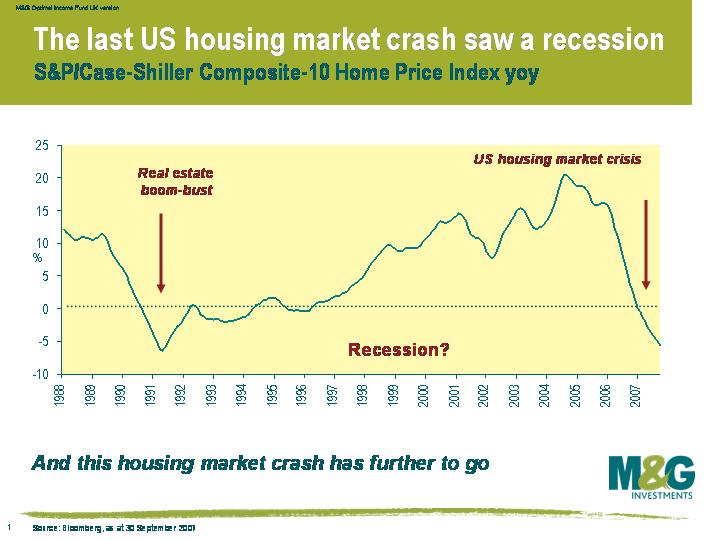
 US house prices fell by 5.5% in the year to the end of September, according to the S&P Case-Shiller Composite-10 Index (see opposite chart). The pace of decline is quickening – prices fell by the most in at least 20 years during the third quarter, a very painful event for the US home owner.
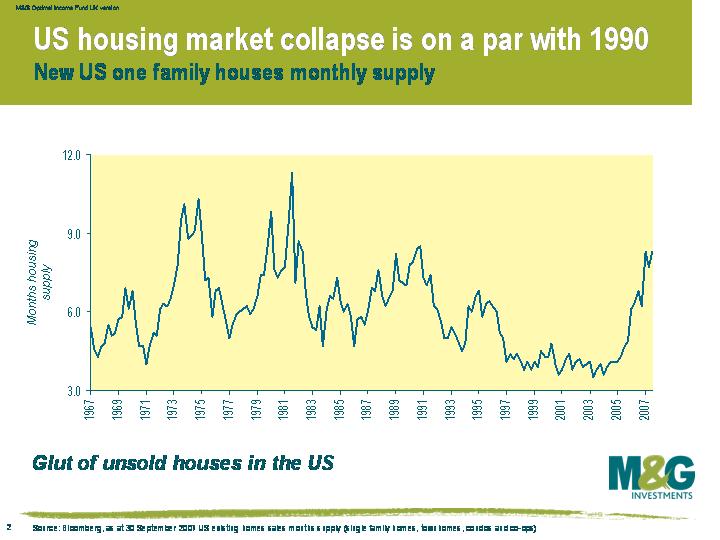
 Prices will need to continue falling until the huge excess supply on the market is cleared. This chart shows the monthly supply of houses in the US, which is a commonly used indicator of how long it will take to take sell all the houses on the market at the current sales pace. The total supply of houses on the market is now at levels last seen in the housing slump of 1991-92.
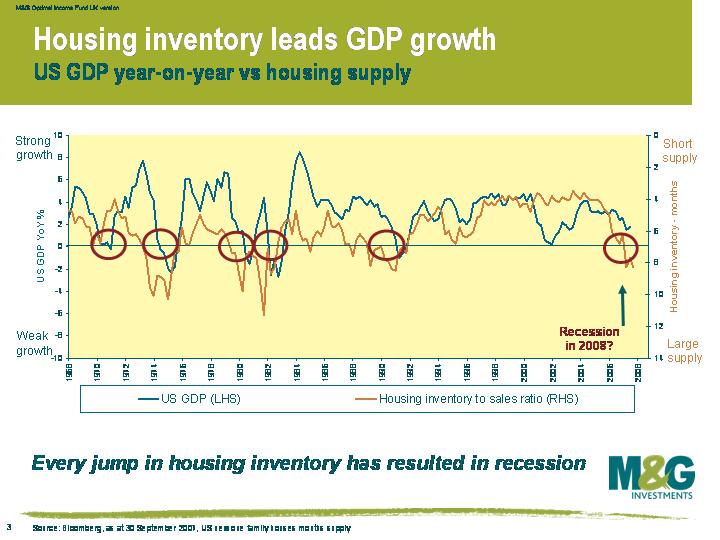
 What does a surge in housing supply mean for US growth? See this chart – the housing supply is on the right hand axis and inverted, and US economic growth is on the left hand axis. Data going back to 1968 shows that the five previous times that housing inventory has jumped, recession has followed about a year later. The monthly supply broke above 7 months in the first quarter of 2007, which has historically been about the level that tips the economy into recession.
Even though the US bond market has been suggesting a US recession for a while (see previous yield curve blog), economists generally seem to be much more positive, with this month’s survey of 70 economists by Bloomberg predicting growth next year of 2.4% on average. However, the current housing market dynamics paint a gloomier picture than suggested by the economists’ crystal balls.
The value of investments will fluctuate, which will cause prices to fall as well as rise and you may not get back the original amount you invested. Past performance is not a guide to future performance.


18 years of comment
Discover historical blogs from our extensive archive with our Blast from the past feature. View the most popular blogs posted this month - 5, 10 or 15 years ago!


Bond Vigilantes
Get Bond Vigilantes updates straight to your inbox


