


A monetarist view on inflation

Back in the 1960s, monetary economist Milton Friedman famously said: “Inflation is always and everywhere a monetary phenomenon”. While his theories became very popular during the inflation shock of the 1970s, they lost momentum since then and particularly after large operations of quantitative easing failed to result in higher inflation. Today, however, inflation and Friedman’s theories are once again back on the table.
In this blog I want to revisit what Friedman actually said about inflation and why a return to more “normal” inflation is highly unlikely at this stage.
In order to understand Freidman’s thinking around inflation fully we need to start with his famous equation, which he also had printed on his license plate. It is MV=PY, where:
M = Money supply
V = Velocity of money
P = Price level
Y = Real GDP.

What Friedman is saying with this equation is that inflation is effectively a function of only three things:
Let’s examine these three components more closely in order to understand the likely future path of inflation.
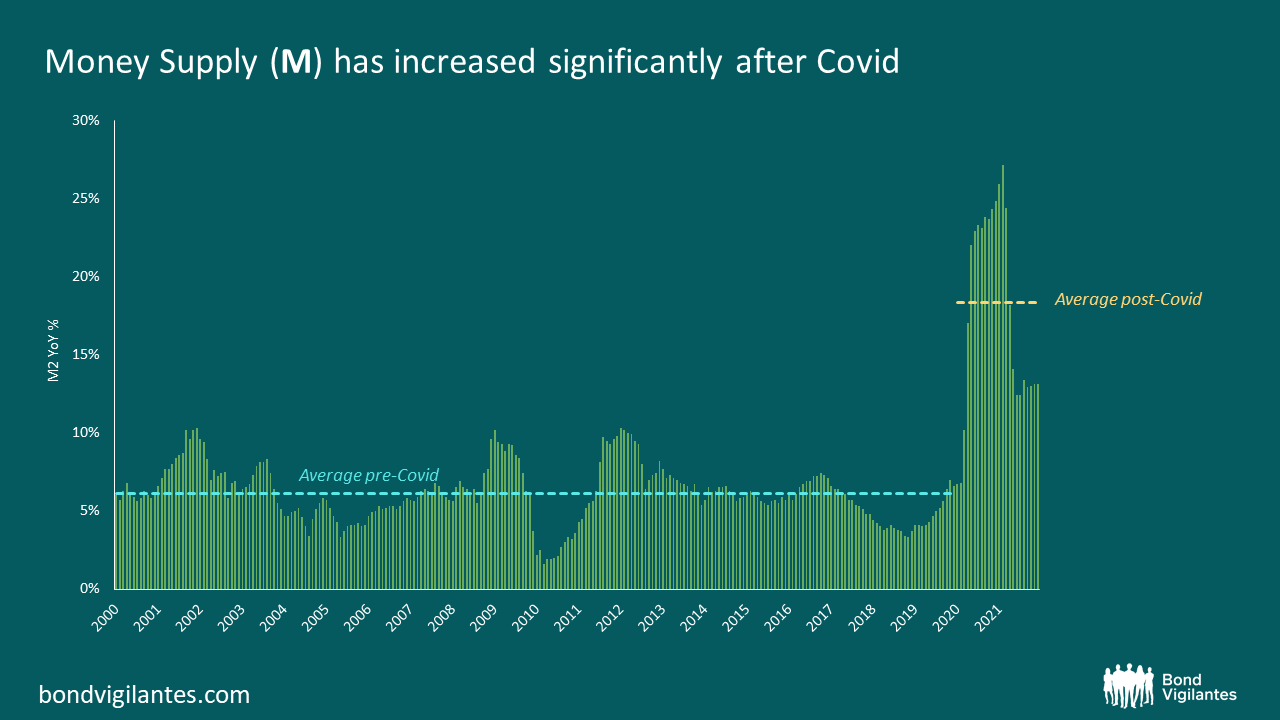
1. M = Money supply
I’ll start with money supply (M) as this has been the real game changer since the pandemic began. Pre-Covid, money supply was growing fairly steadily at c. 6% annualized. Since the pandemic hit the economy, there has been an unprecedented injection of money into the system in order to support companies and households. Since then, M has been growing on average by 18%: three times what we were used to.
While this unprecedented increase in M was initially justified by an unprecedented episode (Covid), the fact that M is still growing north of 10% is a worrying signal. We don’t need such a large supply of money in the system anymore but central banks don’t seem to be in any rush to reduce the amount of money in circulation, arguably as they don’t want to destabilize financial markets.
2. V = Velocity
The second driver of inflation is velocity (V). Velocity represents the number of times a dollar gets spent. But you can think about velocity also as the inverse of demand for money, and this definition is actually more useful to understand the future path of velocity. If you don’t want all the money you have, you will increase spending (hence higher V); conversely, if you want to accumulate money, you will decrease spending (hence lower V).
So what makes consumers want to reduce their cash balances and therefore increase spending (and velocity)?
Here are three factors:
- Greater confidence: the greater people’s confidence about the future, the higher their propensity to spend. Vice versa, if uncertainty about the future is high, propensity to consume will be less. It’s no coincidence that during time of crisis, velocity usually drops significantly as uncertainty about the future increases.
- Higher inflation expectations: higher inflation expectations put pressure on consumers, pushing them to do something with their money as they see the real value of their cash balances falling.
- Higher rates: as rates move higher, people respond to the opportunity to earn some interest and reduce their cash balance by putting money to work (hence velocity increases). Vice versa, the lower interest rates are, the more cash people are willing to keep (hence velocity decreases).
The last two factors played a key role in pushing money velocity to extremely low levels. As you can see from the chart below, money velocity has been on a steady downward trend for some time. This trend has been further accentuated by the Covid crisis: as uncertainty increased, rates went all the way down to zero and people had limited opportunities to spend due to lockdowns.
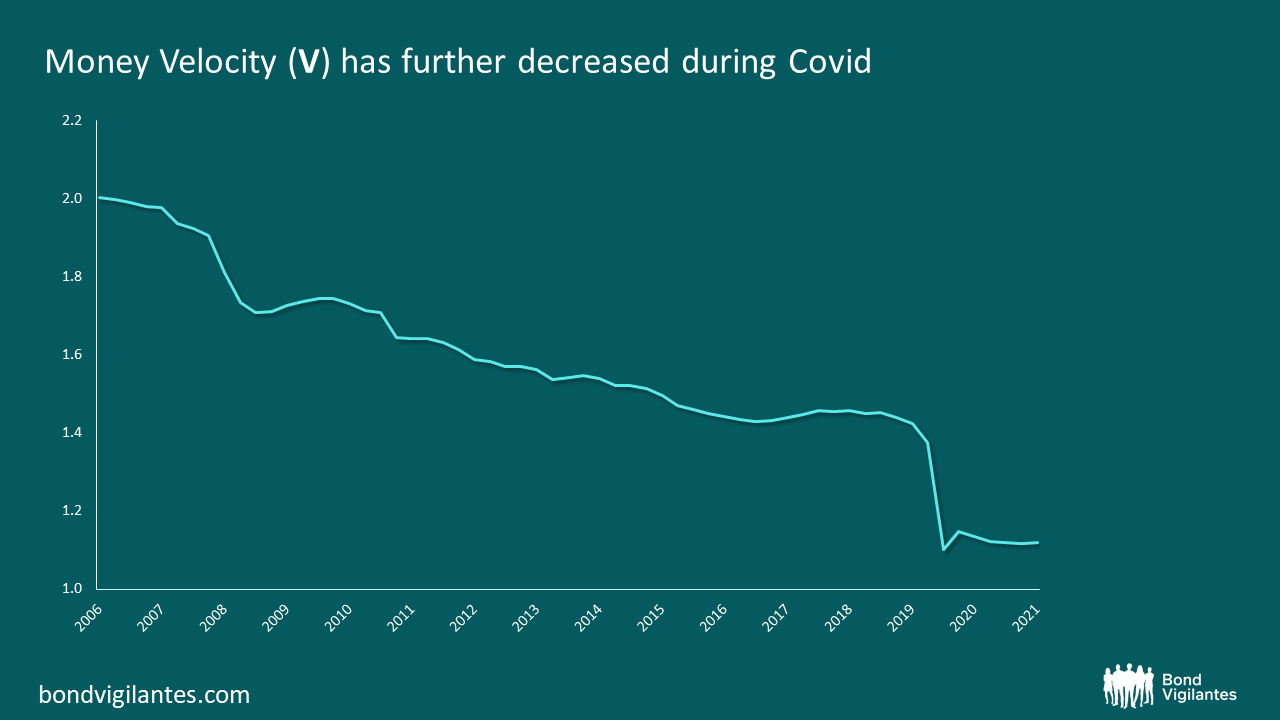
Things are changing though. We are currently in an environment in which confidence is high as the labour market is exceptionally strong and vaccines have restored optimism about the future. Inflation expectations among consumers and companies have increased significantly, resulting in strong pressure for households and companies to put their money to work. On top of this, rates are starting to rise and this will place further pressure on the liquidity currently sitting in bank accounts. Finally, economies are gradually reopening, allowing people to spend their money freely.
While it is impossible to predict where exactly velocity will go, it would be reasonable to assume that in the current environment velocity has a high probability of increasing going forward.
3. Y = Real GDP
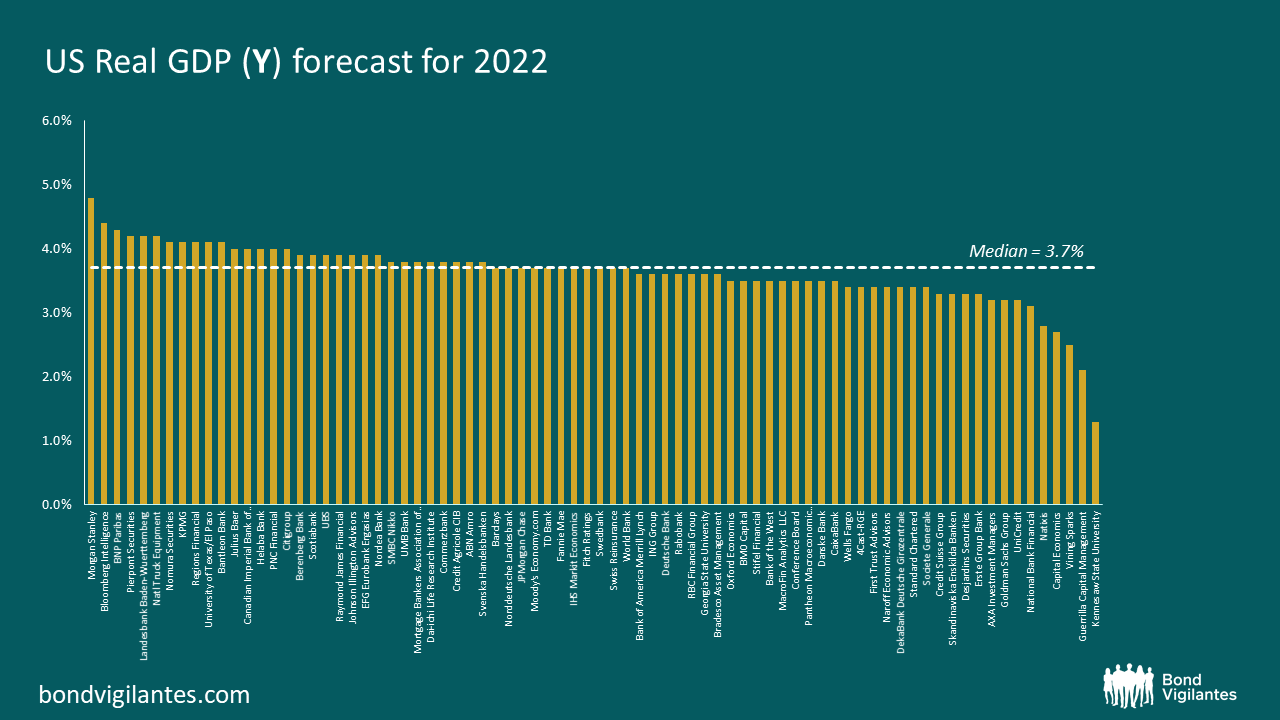
Finally, let’s examine real GDP (Y). This is the economy’s capacity to absorb demand. If the economy is able to produce enough goods and services to meet demand, then prices should remain fairly stable.
Below is a chart showing all recent forecasts for 2022 real GDP in the US. The median is 3.7% with a maximum of 4.8% (Morgan Stanley) and a minimum forecast of 1.3% (Kennesaw State University). To put these numbers into context, over the last 20 years or so, the US economy has grown by c. 2% annually in real terms.
Let’s bring this all together in order to assess the likely path of inflation going forward.
Friedman’s formula in practice
In the table below I run different inflation scenarios using Friedman’s formula. I assume a marginal increase in velocity (V) of +0.5%. As explained above, velocity is likely to pick up again and potentially will go above even a modest 0.5% increase.
For real GDP (Y) I used the current median consensus (3.7%) as a base scenario, but I added some numbers around that (from 3.0% to 4.4%) to give more outcomes.
Finally, for money supply (M) I used the current number (13%) as the central scenario but, as with GDP, I added a range numbers to allow for different results.
The first thing that stands out from the table below is that there is lots of red (high inflation) and not one single number below 2%. If nothing changes in terms of money supply, if we get a small 0.5% increase in velocity and if the market is correct with its 3.7% real GDP prediction, then we will end 2022 with an inflation close to double digits. This is unlikely but not impossible, and much depends on where money supply will go. You can expect it to trend lower, but how aggressively? If central banks remain slow to react, chances are that inflation might even peak soon, but won’t decrease much from where it currently sits.
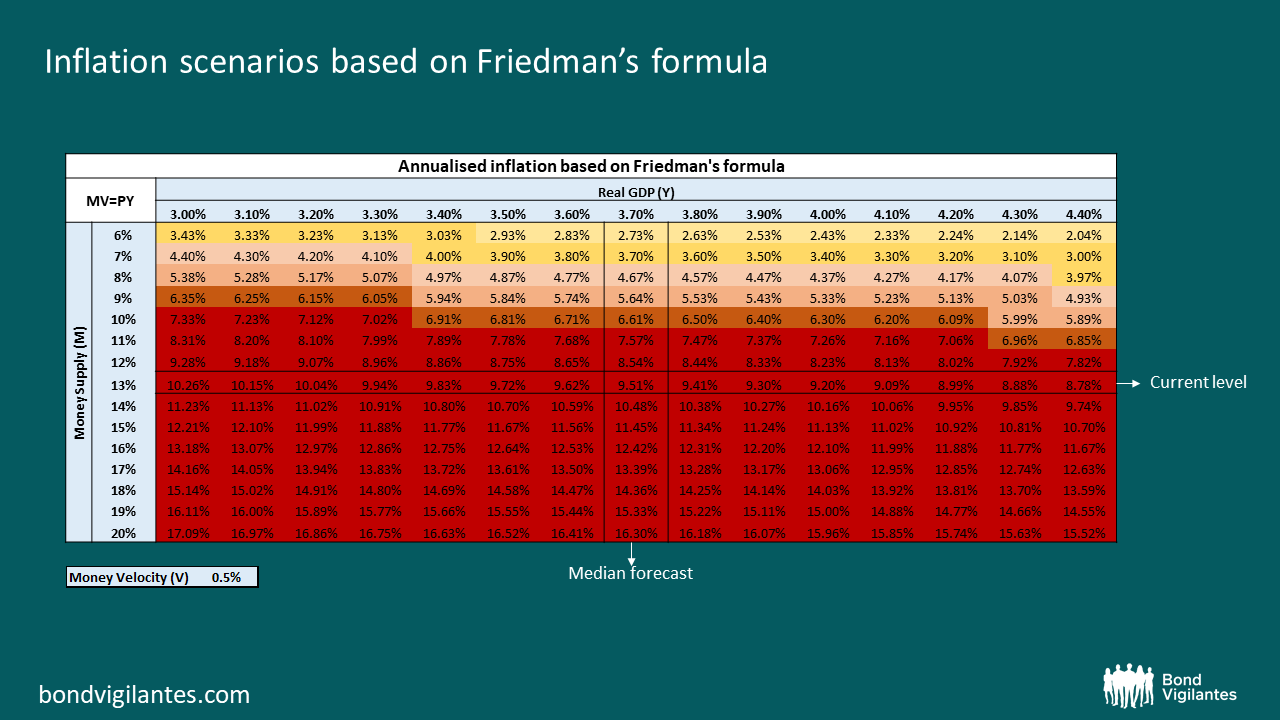
We live in an environment where liquidity is abundant, propensity to spend is high (particularly as economies reopen) and capacity to absorb higher demand (real GDP) doesn’t seem sufficient. This is the perfect recipe to get sharp increases in price. Last year used car prices spiked – this year it might be something else. Some argue that the “base effect” will bring inflation down. While I sympathize with the view that inflation is likely about to peak, I would caution that the base effect argument was also used last year. And we know how that ended.
Right now, our best chance to return to a normal inflation environment would be to reduce money supply drastically. But a large reduction in money supply doesn’t seem on the table for now.
The value of investments will fluctuate, which will cause prices to fall as well as rise and you may not get back the original amount you invested. Past performance is not a guide to future performance.

