
Capital Structure Gymnastics: valuing the equity of stressed credits using option maths
“It’s option value” – A frequent refrain by credit analysts explaining why the market ascribes varying levels of equity value to companies with debt trading at severely stressed levels. Cryptocurrency exchange Coinbase, for example, has unsecured debt trading close to 50% (c.$3.7bn outstanding), yet still has a market cap of $8.8bn; outdoor advertiser Clear Channel Outdoors has unsecured debt around 70% (c.$7.17bn outstanding), yet has a market cap of just $580mn.
Intuitively, it makes sense that the market will ascribe much greater optionality to Coinbase, whose success or failure is tied to especially volatile assets, versus Clear Channel, whose assets are generally stable and earn predictable income. But, as evident in the above example, the discrepancy between these can be so large that its helpful to put some maths around the intuition. In that vein, below, I detail the usefulness of an options based perspective of capital structures (as originally developed by Robert Merton in 1974) to ascribe logic and help discern what that option value is really worth for a topical stressed credit – Community Health Systems.
Community Health Systems (CYH) is a rural US hospital chain with 83 hospitals throughout the Midwest, South and Southeast. Despite a largely successful 2+ year period of revamping its capital structure, 2022 pushed the company’s investors to the edge. Thanks to lower admissions and higher costs, CYH was forced to lower its full year 2022 EBITDA guidance from an initial midpoint of $1.9bn to $1.35bn, a drastic 40% revision over a short period of time, pushing its debt into clear stress territory. It has $12.5bn of debt, divvied up into three tranches, now all trading at substantial discounts to par (e.g. second lien bonds are trading in the mid-50s at around 20% yield). And to top it off, the equity market cap is just $650mn, or approximately 5% of the total enterprise value.
Interestingly, while these depressed prices imply a near unanimous investor expectation of a near-term default, you’d be hard pressed to find an analysis that shows CYH running into a liquidity short-fall until early 2026 – when their first secured bonds mature ($2.1bn outstanding). Though it’s not inconceivable that the 14 analysts publishing on Bloomberg are completely off base, for discussion purposes, assume estimates are generally representative of the investor community’s views and are reasonable.
Simplifying and reframing the situation, it’s fair to say that in 2026, if the company’s enterprise value is not worth more than the total value of debt ($12.5bn), the company will not be able to refinance its large 2026 maturity and will be forced into Chapter 11 or similar restructuring.
Said differently, if the company is worth less than $12.5bn in 2026, the equity is worthless (and turned over to creditors); and if the company is worth more than $12.5bn, the equity lives to see another day. Borrowing a key takeaway from Merton’s structural model for credit risk, from this perspective, CYH equity is analogous to a call option on CYH’s assets – with the strike being the total debt, underlying being the asset value, and expiration being the nearest large maturity.
Visualizing this, I find two graphs helpful. First the probability of default visualization derived from the Merton KMV model, showing that asset values move in a normal distribution and can be priced off distance to default. Importantly, even if the asset value is largely oscillating around the default/debt line before time T, there is still a probability it will end up above the default/debt line at T.
Probability of Default Visualisation

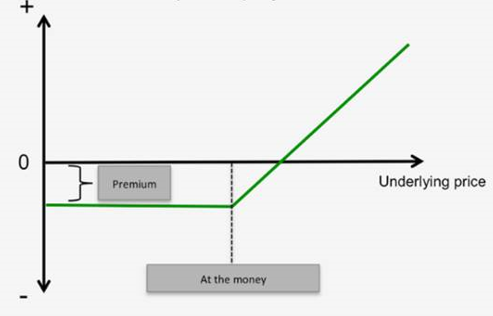
The second graph I find helpful is a simple call option expiration diagram. In the below, I depict that the payoff of buying the equity today at the $650mn market cap, which represents the option premium paid. If the company is not worth more than the strike at expiration, the investor loses the $650mn; if worth more, the option holder benefits in a linear fashion with the enterprise value.
Option pay out
So what’s that option premium worth? The Black-Scholes model can help us out, but first we need to go through the key inputs – strike, expiration, underlying price, dividends, volatility, and the risk-free rate.
Strike: $12.5bn.
This is the total value of debt, and represents the minimum enterprise value needed to refinancing the 2026 maturity.
Expiration: 15 Mar 2026 or 3.2 years.
This is the maturity date of the $2.1bn 2026 secured notes, the first major debt maturity in the capital structure.
Underlying price: $10.275bn.
This is the creation enterprise value implied by the market prices for the second lien debt, which appears to be pricing as the fulcrum. As this is less than the $12.5bn of debt, creditors are implying this structure is already underwater. While savvy analysts can derive their own enterprise value here, for this exercise, taking the market information suffices.
Dividends: 7.4%/year.
This is not dividends to equity, but rather the total interest paid to the debt until option expiration. In this sense, this is value leakage from the enterprise value that does not accrue to the equity option we are valuing. This effectively brings the underlying lower as time moves toward expiration.
Volatility: 40.
Because we are after the volatility of the entire asset or enterprise value, we cannot look to the implied vol from the CYH equity (93!) since it represents a small, very levered and very volatile slice of the CYH capital structure. Instead, we look to a comparable conservatively capitalized asset, HCA, as this should move more in line with what we’d expect for an unlevered CYH.
Risk-free rate: 4%, the 3 year treasury rate.
Matches the expiration.
Inputting this into a few Black-Scholes calculators I found on Google, calculating the equity price as if it were a call option on the firm’s asset implies a market cap of $1.4bn. Further, the distribution of asset prices implied by the above characteristics equates to a 37% probability the underlying finishes in-the-money.
This means that today, despite an implied valuation that is significantly underwater and value leakage below the equity in the form of interest (analogous to dividends in a standard equity option model), option value alone puts the equity’s worth much higher than the $650mn market cap. Importantly, because you cannot dynamically hedge this as you could with standard options, it’s tough to hang your hat on this as true investible value. That said, it’s incredibly helpful to assess the potential upside (and downside) of all parts of the capital structure when investing in stressed credits.
The value of investments will fluctuate, which will cause prices to fall as well as rise and you may not get back the original amount you invested. Past performance is not a guide to future performance.

