
Inflation in the US: Does 2023 have any nasty surprises in store for markets?

The February CPI print came in hotter than survey expectations at 6.4% YoY, throwing inflation rates off the path back to the 2% target. Is this just a small outlier, or is this an early warning sign for what’s to come in 2023?
Where does US inflation stand now?
The past two years have been a wild ride for inflation; headline inflation has soared from 1.4% in January 2021 to 9.1% in June 2022, and currently sits at 6.4%. This rapid growth has been easing following the Fed’s aggressive rate hikes in the second half of 2022, along with more hikes expected to be on the way in 2023. Will this be enough to lower inflation to 2%? Markets are currently pricing in some strong disinflation, even with a possibility of rate cuts in the latter half of 2023 in case of a hard landing.
However, before we start getting too comfortable, there are a few things worth looking out for that could end up being surprise pitfalls if we’re not careful enough.
Breaking down the inflation rate

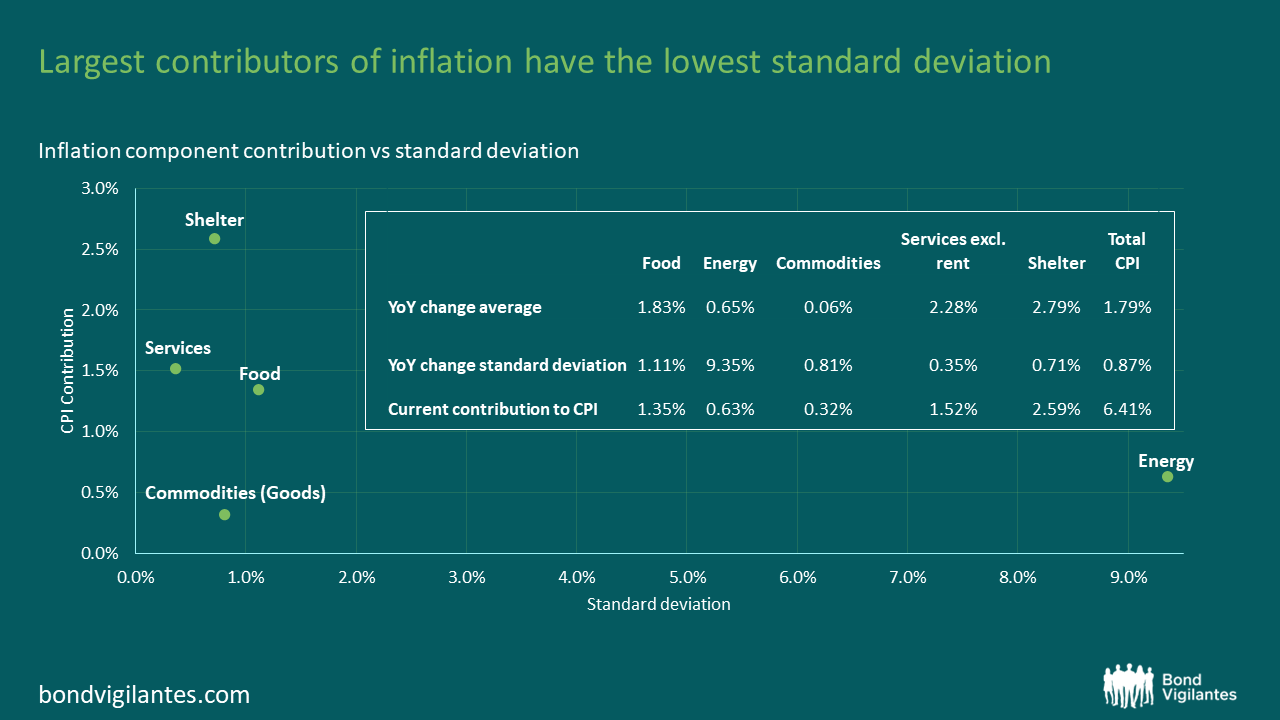
I’ve split the YoY inflation rate to five different components for data dating back to January 2021: Shelter (Rent), Commodities (Goods), Food, Energy and Services (excluding rent). We can see that the initial rise in inflation rate came from an increase in all the components, with no single component being a standalone driver. This dynamic has however changed in the past few months, where the drop in inflation rates have been attributed mostly to decreasing Energy and Commodity prices. Shelter and Services inflation remain strong contributors, now accounting for over 68% of the overall inflation rate.
What can we infer from this divergence?
Taking a more numerical view on inflation
Now that we know the current drivers of inflation, are they here to stay, and how sticky are they? Shelter and Services are known to be more sticky, but we can pull some further insights on this with some additional calculations. Taking the YoY changes in inflation of each component from 2009 to 2020 (pre-Covid), we can gauge how sticky or variable they are by calculating their standard deviations, which act as a proxy for volatility. Here are the results from the calculation:
Shelter and Services
With the data above, we can confirm that the current largest contributors, Shelter and Services, tend to be the components with the lowest volatility; will this stickiness have an effect on 2023 inflation? Even if we assume that the variable components will go all the way back down to 0%, Shelter and Services contributions still add up to 4.53% and will have a long way to go to get back down to 2%.
Looking at the Zillow Rent index, a leading indicator of rent growth, the data actually supports the idea of rent inflation rates peaking this year. However, this is somewhat mitigated by current labour market conditions with unemployment rates at a 50-year low, along with jobs and wages still growing consistently (especially with the surprisingly strong non-farm payroll data release in Jan 2023).
I believe that the strong labour market will maintain upwards pressure on rent and service prices, further enhancing price stickiness via increased labour costs and purchasing power. House supply (Home sales inventory) sitting at historically low levels does not support the case for rent disinflation either.
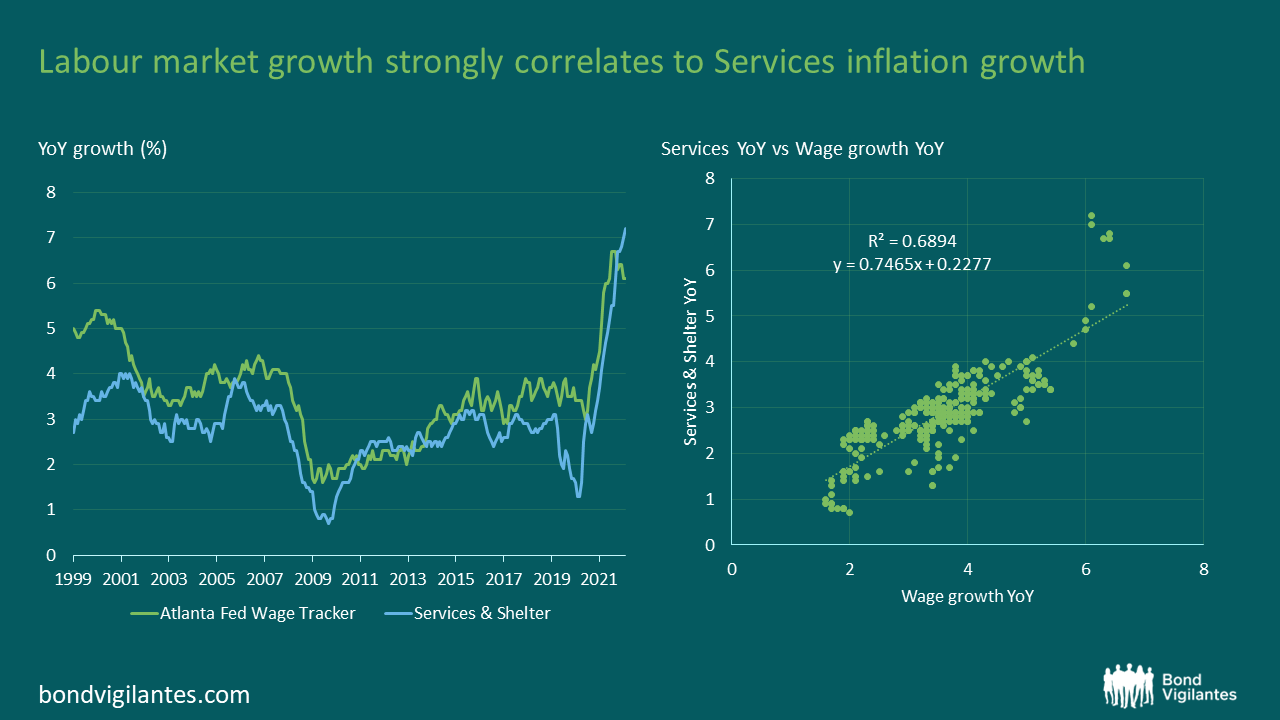
Shelter and Services growth will be hard to squash, so I see them staying as major positive components of CPI inflation, albeit at a slightly lower rate in the coming months.
Energy prices
Another interesting observation from the numerical breakdown is that Energy has a low average change and extremely high standard deviation, meaning that it tends to fluctuate frequently between positive and negative YoY change. Historically, energy prices have been a significant contributor to big swings in CPI rates (both upwards and downwards); and we should keep a look out for this happening again in 2023. A good visualisation of this effect is when we compare US inflation sensitivity to energy prices to the Eurozone, where energy contributions are less volatile (compare the two blue lines prior to 2021):

Some key Energy drivers this year
1) China’s U-turn reopening could spark an increase in oil demand as their economic activity picks back up, being the second largest importer of oil in the world.
2) The US Department of Energy plans to start refilling their Strategic Petroleum Reserves, which are at all-time low inventory levels. President Biden has set the plan to purchase crude oil when WTI crude oil prices are at or below $67 – $72 per barrel, potentially setting a price floor on oil. With prices currently sitting at $74 per barrel, this reduces the likelihood of oil prices dropping much further and causing deflationary pressures.
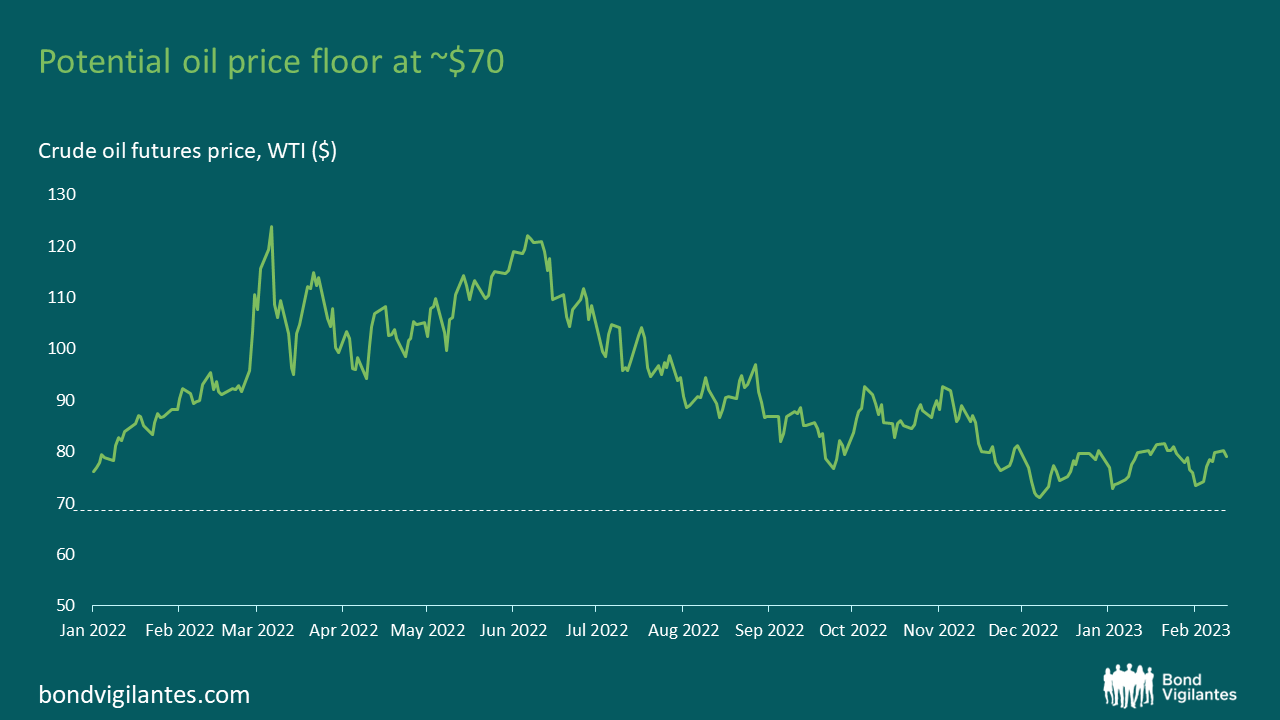
We would see some initial deflationary pressures from Energy prices in the first few months of 2023 due to the base effect from high prices in 2022, but this deflation may not be persistent and may even turn back into positive inflation the following months depending on the above factors.
Core Goods
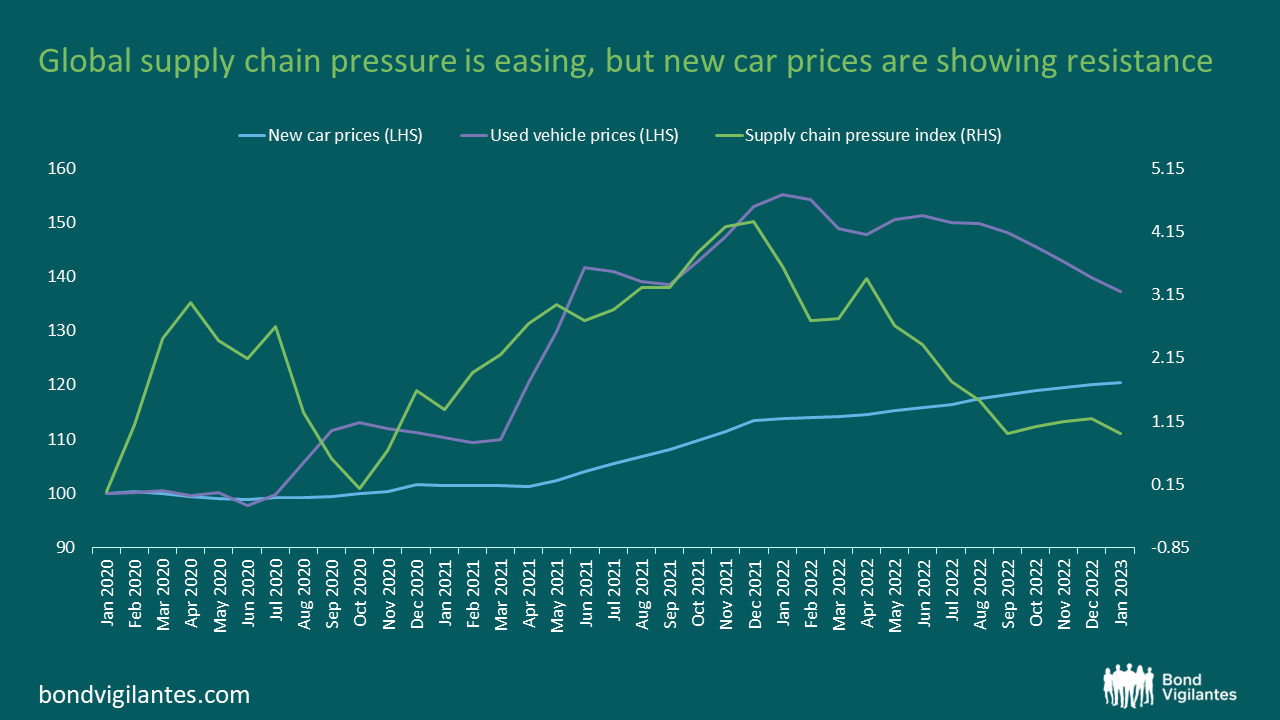
Commodities (Core Goods) are currently a top contributor to the slowdown in inflation rates, with vehicle prices being the key driver of this category. Vehicle prices actually have been showing some deflation the past 2 months, but again, it is always good practice to be cautious of outlier events.
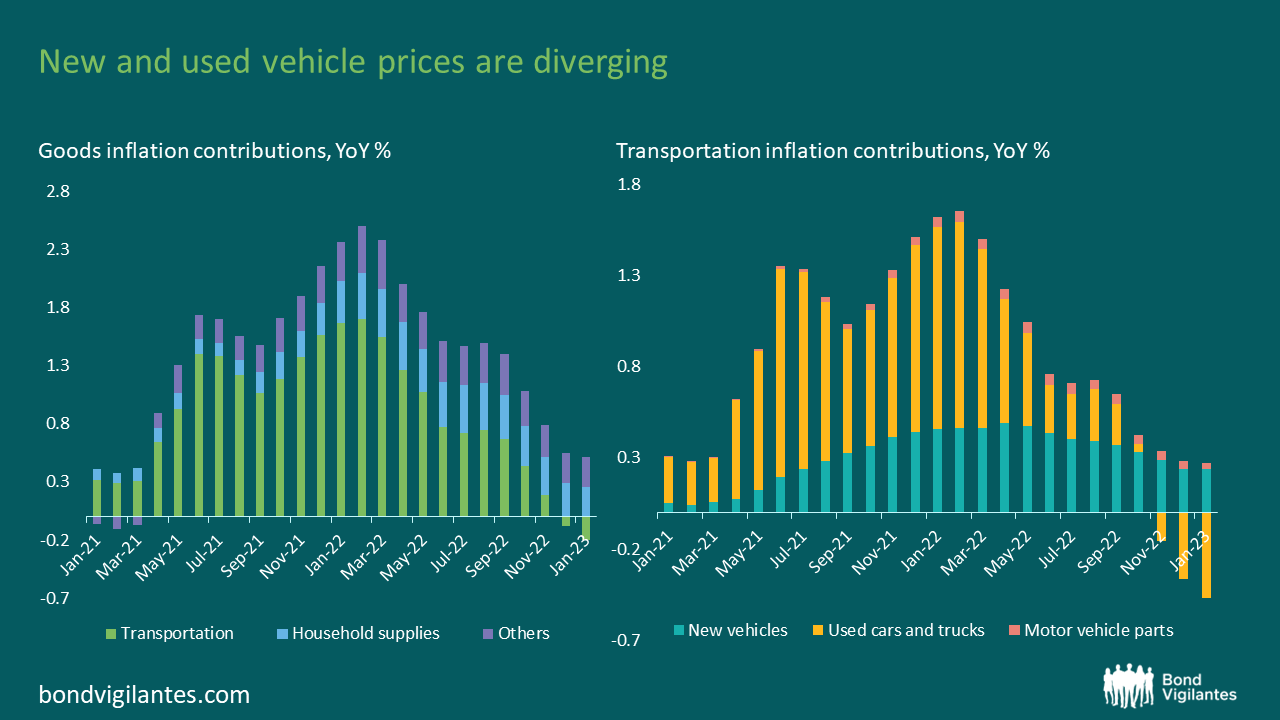
The initial price increases came from a combination of supply chain issues and increased raw material prices. Despite supply chain pressures now easing following the pandemic recovery, a shortage of car chips and semiconductors still pose a huge issue to the supply of new cars – executives from top car chip manufacturers such as Onsemi and Infineon have all shared similar comments on the tight shortage of car chips in 2023 with no certainty of recovery yet. This supply crunch could end up keeping new car prices at an elevated level with a low chance of falling sharply.
Thus, for transportation to continue to keep on this trend of deflation, it will have to be driven by the continued deflation of used car and truck prices, which comes from a combination of lower consumer demand and the base effect from when prices soared over 50% within 2 years. The demand for used vehicles has been dwindling the past year due to higher auto loan interest rates, so we will have to keep a look out of this trend continuing, stopping, or even reversing depending on where the Federal Reserve takes interest rates moving forward. It is also worth noting that used car loans tend to be higher than new car loans, so the effects of rate hikes will be more prominent in used car demand.
In conclusion
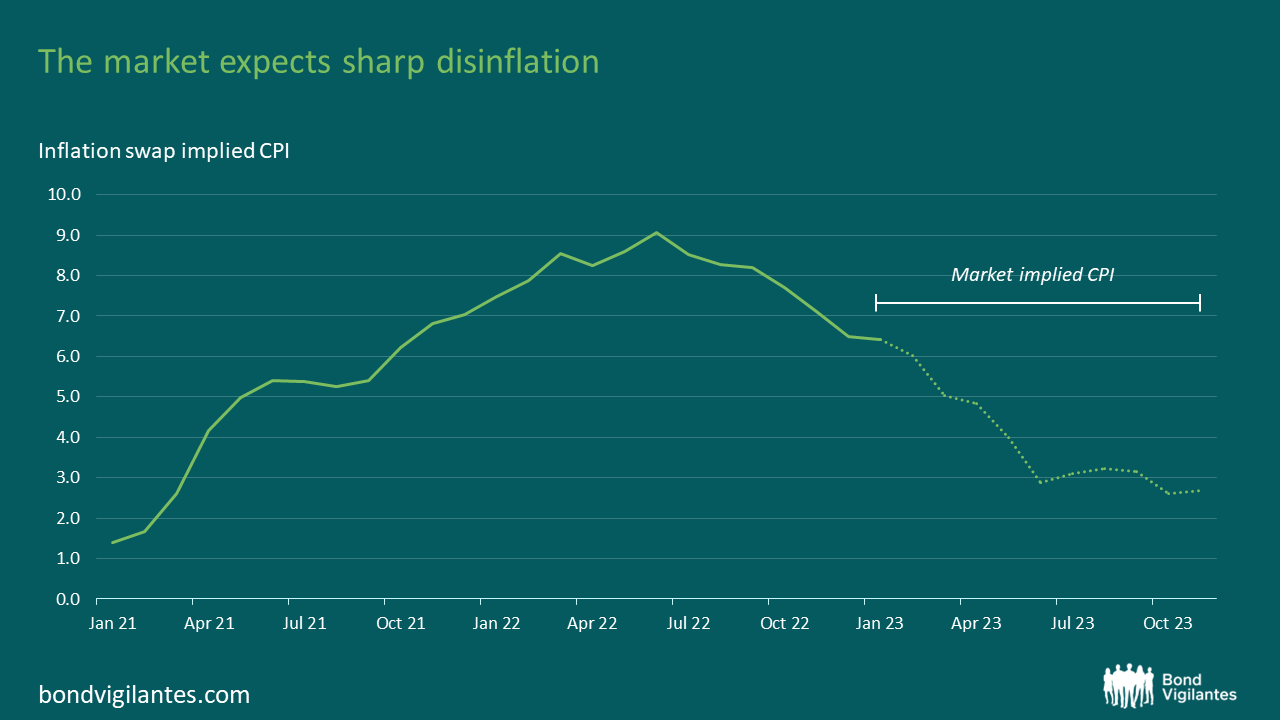
Inflation has likely already peaked in 2022, and it’s now a question of how long it takes to get back to our 2% target. The market implied CPI inflation rate, derived from Traded Inflation Swaps, currently shows that the market expects inflation to reach 2.8% by July 2023, and then lingering at around 3% for the rest of the year.
The market, especially in 2022, has often underestimated inflation rates, only for actual inflation rates to turn out higher than expected. I believe that 2023 is loaded with tail risk that the market is not reflecting, especially in energy, services, and rent; so although we may start off 2023 with some rapid decreases in the inflation rate and some further interest rate hikes, certain components of the inflation rate are still putting up a strong fight against this. We should be cautious of a scenario where the initial hope fades and reverses back into inflationary territory.
The value of investments will fluctuate, which will cause prices to fall as well as rise and you may not get back the original amount you invested. Past performance is not a guide to future performance.

