EM inflation is lower than UK inflation for the first time in 20 years
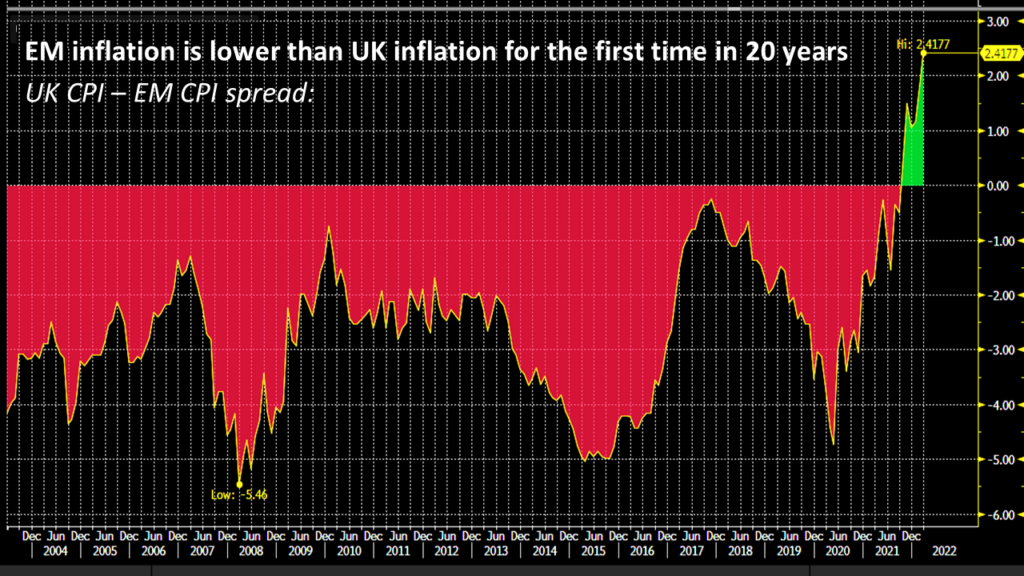
With concerns about sticky inflation in the UK and following the Bank of England’s surprise hike to 5% today (versus 4.75% expected), here’s a surprising chart: EM inflation is lower than UK inflation for the first time in 20 years.

Source: Bloomberg
Drivers on the EM side:
- Proactivity of EM Central Banks – some (e.g. in Latin America) have been hiking since 2021, well ahead of developed market central banks
- Less monetary overhang than DMs as there was less (or no) QE in most countries
- Caveat on the graph above: this is GDP-weighted, so approximately 40% of the EM weight is China, where inflation is currently at only 0.2%. China, and to some extent Asia, saw much lower levels of inflation than the rest of EM (and DM), as there has been less energy price pressure and fewer supply side bottlenecks. The region was operating below potential growth in some countries and/or had more scope for some fiscal subsidies or price controls than other countries
Drivers on the UK side:
- The index in the chart above includes food and energy, which have been under particular pressure in Europe
- Rental prices are also a factor and have been elevated
- Brexit-related factors influencing supply chains / labour market?
The value of investments will fluctuate, which will cause prices to fall as well as rise and you may not get back the original amount you invested. Past performance is not a guide to future performance.


