
Curvevolution – the fight against inversion

An inverted yield curve refers to a situation in which short-term interest rates are higher than long-term interest rates for government bonds of the same credit quality. Inversion is considered unusual because, under normal circumstances, longer-term bonds tend to have higher yields than shorter-term bonds.
An inverted yield curve is often seen as a potential warning sign of an economic downturn or recession. Here’s what it can potentially tell us:
1 . Expectations of Economic Slowdown: An inverted yield curve suggests that market participants have a pessimistic outlook for future economic conditions. Investors are willing to accept lower yields on long-term bonds because they anticipate weaker economic growth and lower interest rates in the future. Inverted yield curves have historically been good guides to recessions.
2 . Tightening Monetary Policy: An inverted yield curve can sometimes indicate that central banks are tightening monetary policy. The yield curve can be inverted when short-term interest rates rise due to tighter monetary policy. Central banks often raise rates to control inflation or prevent an overheating economy, but this tightening can dampen economic activity and potentially lead to a recession.
3 . Investor Flight to Safety: During uncertain times or periods of market stress, investors may seek the safety of longer-term bonds, driving their prices higher and yields lower. This increased demand for long-term bonds can contribute to an inversion of the yield curve.
We should look at two periods when curves were at similar levels of inversion to try to draw conclusions versus the current economic climate. The Great Moderation (mid 1980s – 2005) and the 1970s
The Great Moderation
The Great Moderation was a period of relative macroeconomic stability characterised by reduced volatility in economic indicators, including inflation and output growth, observed in many advanced economies. During this period, there was a decline in the frequency and severity of recessions, and inflation remained relatively low and stable. Economic growth was generally steady, and the business cycle appeared more subdued than in earlier periods.
Some key factors that contributed to the Great Moderation include:
Structural Changes: Structural changes in the economy, such as increased globalisation, technological advancements, and productivity improvements, which likely played a meaningful role in reducing output volatility. These factors contributed to more efficient production processes, increased trade, and greater resilience to economic shocks. I would argue this was the most important factor.
Supposedly improved Monetary Policy: Central banks adopted more effective and credible monetary policy strategies. They focused on maintaining price stability and controlling inflation expectations, using tools such as inflation targeting and forward guidance. This enhanced policy credibility helped to anchor inflation and stabilise the economy. I suspect central banks were lulled into a false sense of control due to the overarching impact of the above-mentioned structural changes.
Financial Innovation: The development and adoption of new financial instruments and practices, such as securitisation and risk management techniques, were believed to have contributed to greater financial stability and reduced the likelihood of financial crises. Once again, the overarching impact of the above-mentioned structural changes and the subsequent reduction in volatility allowed financial innovation to proliferate. The imbalances grew, finally coming to a head with the global financial crises in 2008 and bringing the Great Moderation to an abrupt end.
All of these factors have resulted in low and orderly inflation, which has increased the market’s faith in the central banks’ ability to keep inflation in check and on target. As a result, term premiums fell considerably, reducing long-end yields.
UK example
The UK is a fine example of how the yield curve was impacted due to the above global factors and two major idiosyncratic factors that we can look at.
In 1997, the Bank of England (BoE) was given operational independence from the Government. Ultimately, this allowed monetary policy to be set for economic reasons rather than political ones. This independence gave investors greater confidence in the BoE’s ability to meet inflation targets over the long term, resulting in a meaningful reduction in term premiums. At the same time, another significant piece of legislation was brought in, the minimum funding rate (MFR). This legislation required corporates to fund their pension schemes to a certain level and served to protect pension holders. This encouraged investment into long-dated Government bonds and facilitated hedging scheme liabilities. This was the birth of the liability-driven investment (LDI) industry.
Looking at a long-term yield curve, we can see how this played out. The below charts show a long-term 2yr vs 10y yield curve. In 1997 when the BoE was granted independence, the curve flattened meaningfully. Similarly, the 10s/30s curve flattened as long-term premiums were squashed, as a new buyer was in town, LDI. A clear observation from the chart below is that 2s/10s is currently at its flattest ever.
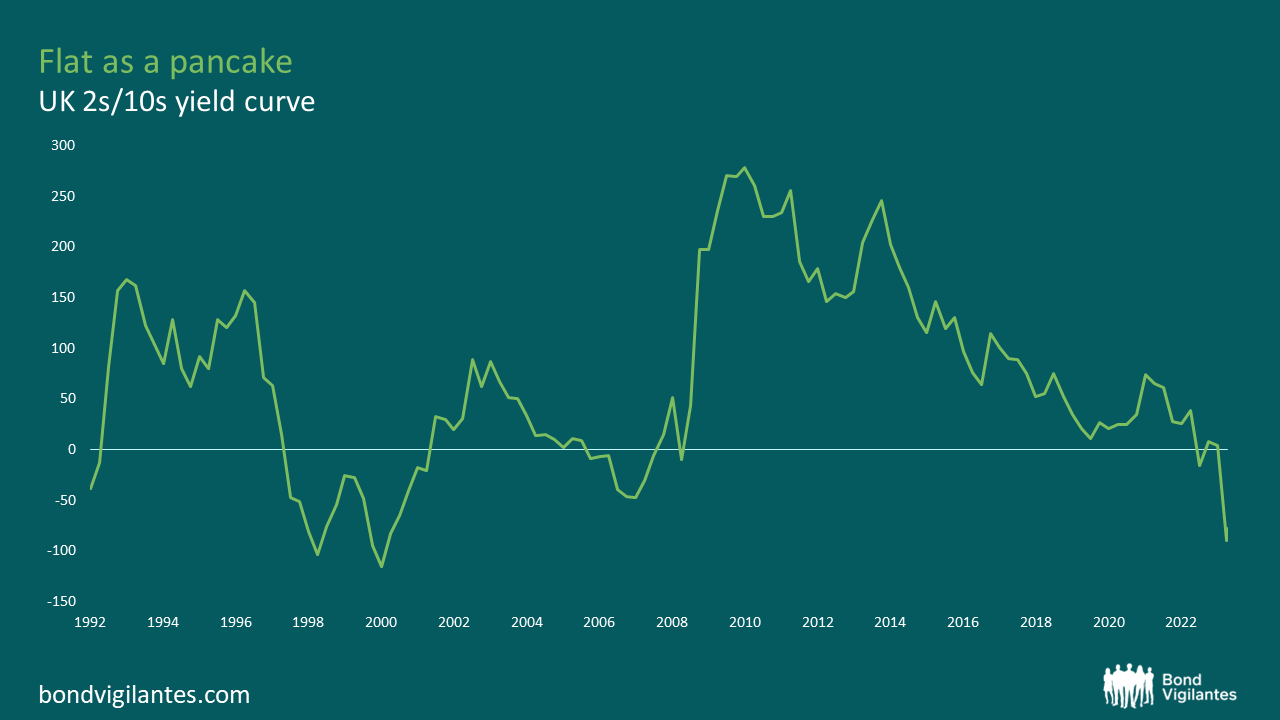
Source: Bloomberg (July 2023)
Stagflation shock
In the 1970s, the United Kingdom experienced a significant increase in inflation, often referred to as “stagflation”, due to the combination of high inflation and stagnant economic growth.
Several factors contributed to the inflationary pressures during that period:
Oil Price Shock: One of the primary drivers of inflation in the 1970s was the sharp increase in oil prices. The Organization of Petroleum Exporting Countries (OPEC) implemented oil embargoes and reduced oil production, leading to a significant surge in oil prices. As the UK heavily relied on oil imports, the higher energy costs substantially impacted production costs across various sectors, leading to higher prices for goods and services.
Wage-Price Spiral: The 1970s witnessed a wage-price spiral, where rising wages and increased labour market power resulted in higher production costs for businesses. Strong labour unions negotiated higher wages, and companies, in turn, passed on these increased costs to consumers through higher prices. This cycle of rising wages leading to higher prices, which further fuelled demands for wage increases, contributed to inflationary pressures.
Loose Monetary Policy: Expansionary monetary policies pursued by the UK government and the Bank of England also contributed to inflation. Monetary authorities increased the money supply and pursued accommodative monetary policies to stimulate economic growth and reduce unemployment. However, the increased money supply fuelled consumer demand without a corresponding increase in productive capacity, leading to higher prices.
Exchange Rate Movements: Currency devaluations also affected inflation during the 1970s. The UK experienced several significant currency devaluations, reducing the value of the British pound relative to other currencies. Devaluations made imports more expensive, including oil, leading to higher business costs and ultimately contributing to inflation.
Supply-Side Shocks: The 1970s saw supply-side shocks, such as disruptions in global food supplies and rising agricultural prices. These factors increased food costs and other essential commodities, increasing prices.
The combination of these factors created an inflationary environment characterised by rising prices, reduced purchasing power, and slower economic growth. The UK and other advanced economies struggled to manage inflation effectively during that period, leading to significant economic challenges and policy shifts in subsequent years to combat inflationary pressures. As a result, interest rates were increased meaningfully to combat inflation at the expense of growth. This caused a significant inversion of the yield curve.
These two examples both led to a flattening of the curve for very different reasons. The period we find ourselves in is more like the 1970s, with the curve at extremes of inversion due to the central bank’s response of increasing interest rates. I use the below 2/10s US curve to illustrate the point. The 1970s saw an extreme flattening of the curve, and we can see that we are currently close to those extremes.
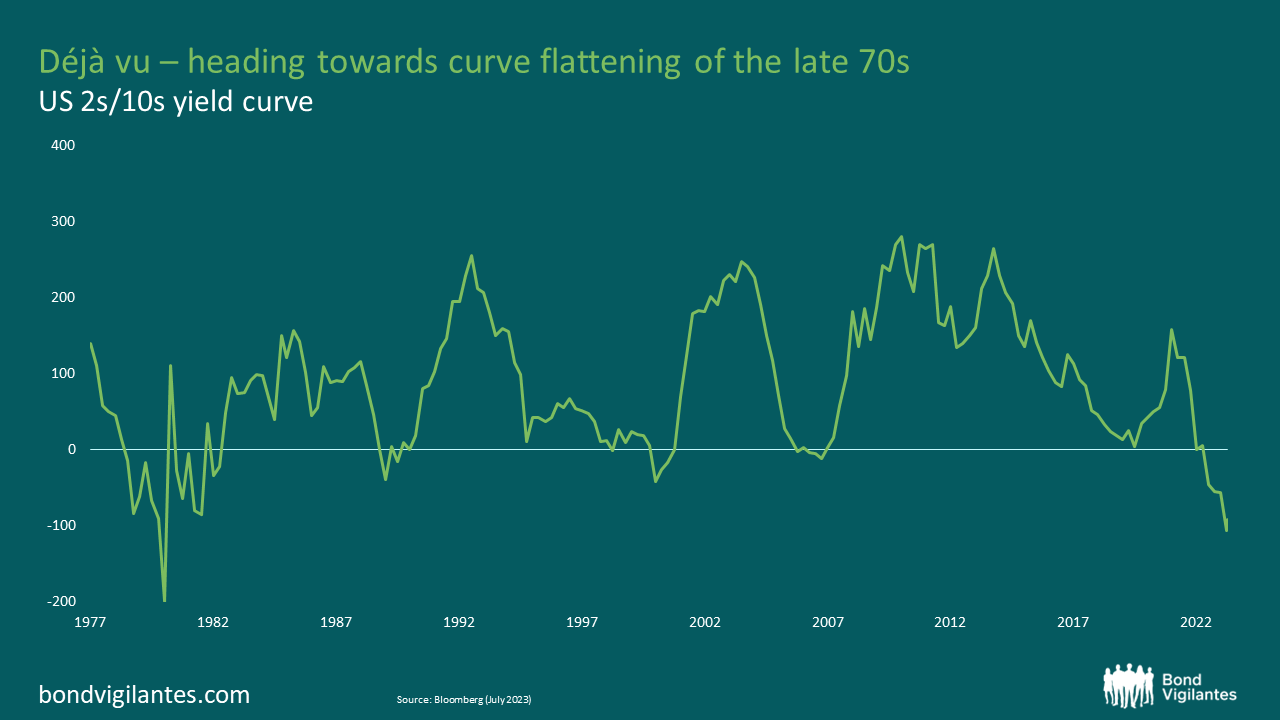
Source: Bloomberg (July 2023)
What is market pricing telling us, and should curves steepen from here?
It’s clear why the curve has flattened/inverted. The data has continued to come in stronger than expected. The BoE has hiked rates aggressively in response to engineer a slowdown and squash inflationary pressures; two-year interest rates have moved meaningfully higher and are now materially more elevated than the Kwarteng/Truss era.
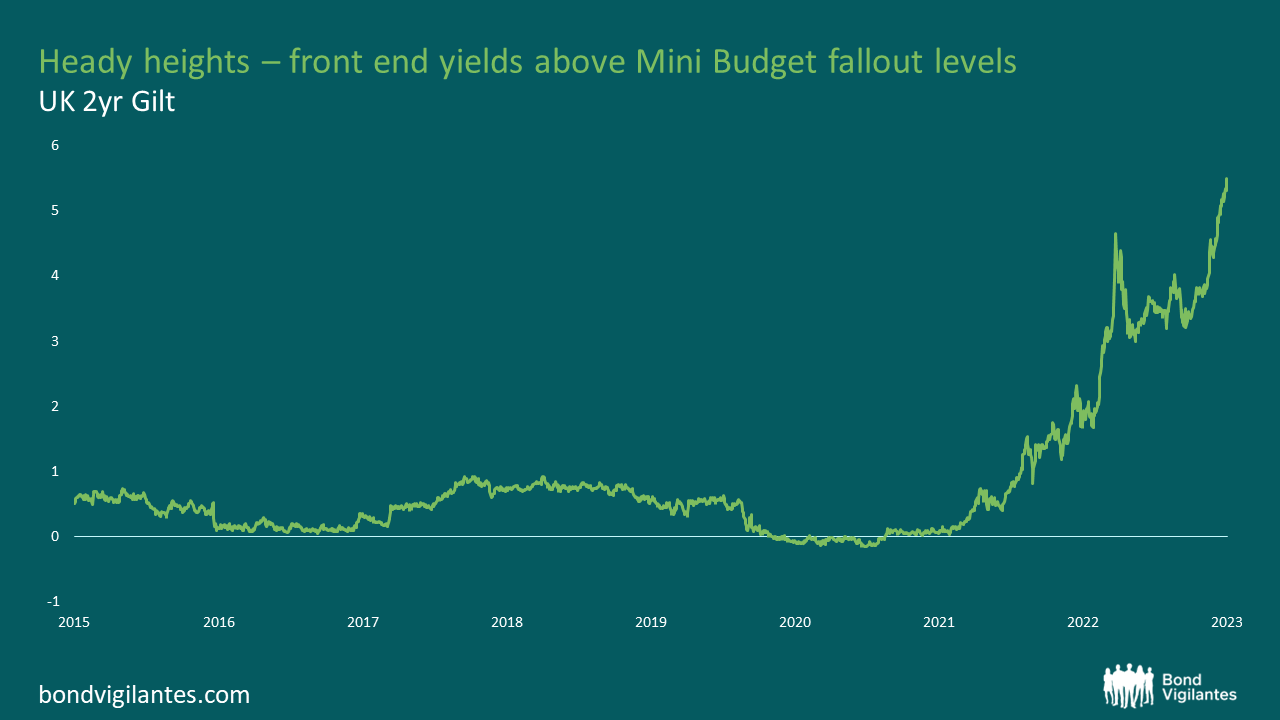
Source: Bloomberg (July 2023)
The bond market is telling us that the current level of rate hikes is sufficient to bring inflation under control over the short to medium term and that cuts to interest rates are to follow to support the economy as it likely slows. The bond market conclusion is that there is faith in the Bank to bring inflation under control. As previously mentioned, an inverted yield curve is often a precursor to a recession, and the current inversion suggests a nasty recession is on the horizon. The equity market, however, is telling us a somewhat different story. Prices remain resilient, and corporate earnings are seemingly holding up for now. Are the two asset classes telling a conflicting story? Perhaps what we should take from the view of the two markets is that a soft landing is expected.
If the yield curve is correct, it’s only a matter of time until inflation is tamed and the pressure to keep rates high abates, with the possibility of rate cuts, then the curve should steepen back up. However, from a structural standpoint, there are several reasons which themselves would pressure the curve steeper; the fact that they are all leaning in the same direction at the same time is a powerful force indeed. Firstly, the BoE has begun unwinding its enormous balance sheet with QT, which is biased toward longer-dated securities. Secondly, LDI, which has long been the marginal buyer of long-dated gilts, is buying less as schemes have fully moved to a fully funded position. The fiscal arithmetic looks challenging in the UK. The UK expects to issue £1.1 trillion worth of gilts over the course of five years. That’s approximately half of its entire outstanding debt stock in five years. These factors suggest curves should be steeper.
The forward-looking period has been coined the ‘Turbulent Twenties’, essentially the opposite of the Great Moderation. It’s a period that is expected to be significantly more volatile on the back of heightened geopolitical tensions, the reversal of globalisation, higher debt levels which limit fiscal manoeuvring, climate change and the associated costs which come with it. This reversal of the Great Moderation means that term premiums should be added back into the curve, pressuring longer-dated rates from their relative lows.
In conclusion, curves are too inverted, and the steepening pressure is too great to keep these curves at these levels for too much longer. The risk-reward has to be for steeper curves with bonds ten years and out offering little value relative to shorter-dated bonds.
The value of investments will fluctuate, which will cause prices to fall as well as rise and you may not get back the original amount you invested. Past performance is not a guide to future performance.

