“We Were Inverted”
The Wall Street Journal published a piece on the inverted yield curve as a recession indicator1 a few weeks back, mulling over why this reliable indicator seemed to be broken. The piece is very good and is worth the read, not least because they’ve blown their web budget on dynamic graphs. To solve the mystery, it’s helpful to revisit the life and works of the Canadian asset allocation guru, Campbell Harvey.
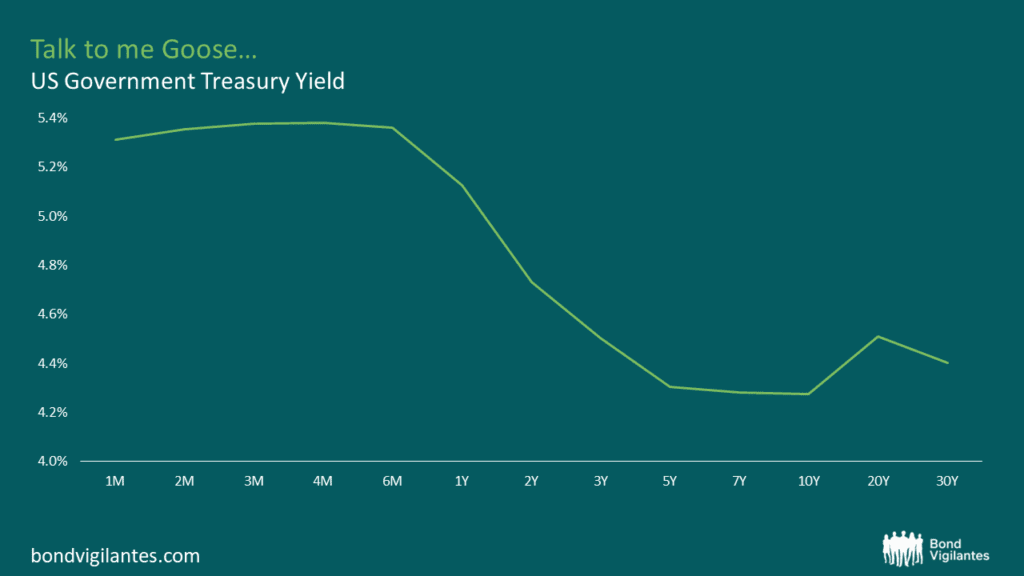
In May 1986, the young Canadian was still a student at the University of Chicago, and campuses were in a frenzy at the release of the original Top Gun film starring Tom Cruise as ‘Maverick’. In the opening scene, Maverick and Goose stun the world with their upside down aerial acrobatics leading to a comical debriefing scene with Kelly McGillis where Cruise utters the line, “I was inverted”. Though I have no proof that Maverick had an influence on a young Harvey, it is striking to discover that seven months later, he published his seminal dissertation which proposed that inverted yield curves (where long term interest rates are lower than their shorter-dated counterparts) are harbingers of recession. Even if Maverick doesn’t appear in the dissertation footnotes (he doesn’t; I checked), Harvey’s inversion is certainly more dangerous than Maverick’s. Though Maverick can still fly all these years later, Harvey’s theory may need to be grounded.

Source: M&G, Bloomberg as at July 2024
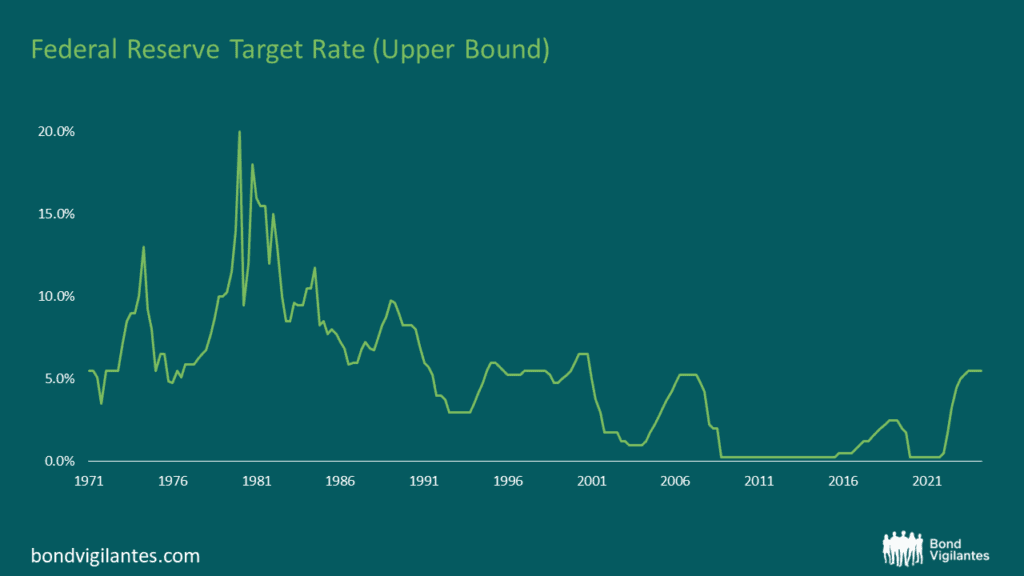
To explain why, first we need some context. The paper was published in December 1986 and had a revision two years later2, with the underlying data relating to the US treasury yields considering the years from 1900 through to 1984. Harvey noted in his introduction that the predictive power of the indicator improved in the last 20 years of his sample period (1964-1984). This is important as it clearly responded to the ‘Stop-Go’ monetary policy of the Miller and Volcker-era Federal Reserve. This was a period when rates were on average higher than they are now, and little was known about what the Fed was going to do next as this was the era prior to forward guidance.

Source: M&G, Bloomberg as at July 2024
Between 1986 and today, there has been a renaissance in understanding consumer behaviour. This is important in its own right as Harvey used contemporary consumer behaviour theory to explain future purchasing decisions. This sort of behavioural concept was the norm in 1986 when consumers were assumed to be rational and, for example, their consumption patterns were assumed to add up to zero (meaning that income must equate to total expenditure). For the economists in the room, Harvey was using so-called “Homo Economicus” as his consumer in the model, signifying a Ricardian Vice (which claims that a mathematical formula can solve an essentially human problem). This style of consumer theory was synonymous with the University of Chicago, where he was writing. Kahneman & Tversky had not yet come into vogue with their influential papers on Behavioural Economics 3, and so this was the accepted norm in terms of consumption functions for economic papers. Today, we know that consumer habits and consumption patterns have evolved and they definitely don’t sum to zero as it was once assumed (think: buy-now-pay-later platforms), and preferences are more dynamic than they were once thought to be. These new patterns of behaviour were shaped as the global economy evolved through the Great Moderation up to the Global Financial Crisis in 2007, and up to the present. This brings Harvey’s paper into question as he goes to great lengths to impute consumer behaviour into his methodology to establish reasons for yield spread differences.
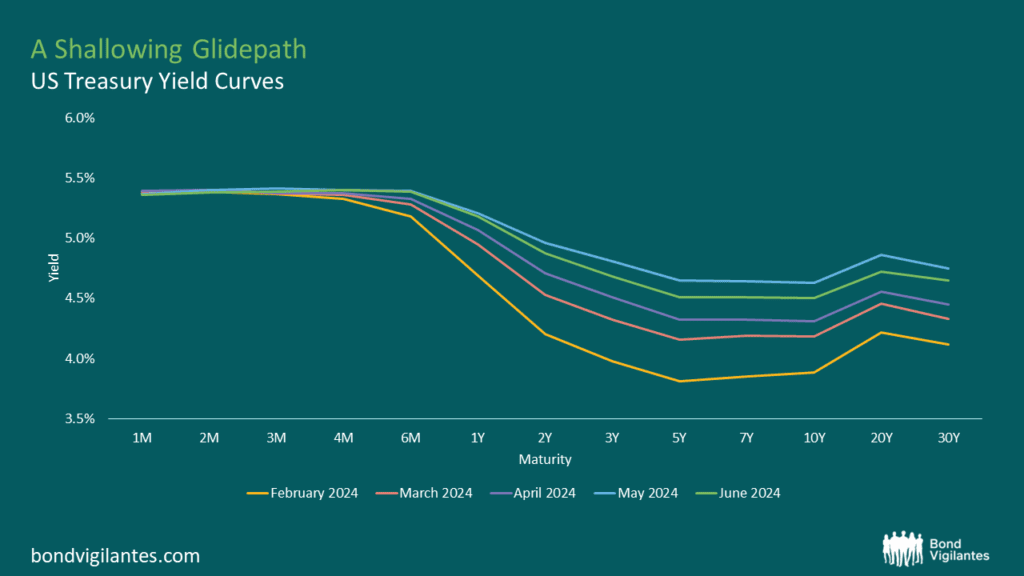
Crucially, the paper pre-dates the forward guidance of Alan Greenspan at the Federal Reserve (2/2/2000) which is critical in this instance. In 2000, Chairman Greenspan began to regularly include a form of forward guidance in the form of the ‘Assessment of the Balance of Risks Facing the Economy’ within the Fed’s press releases. By deploying forward guidance, monetary policy makers in effect tied down too much of the yield curve, thus limiting its ability to invert. By switching from free market forces to the central bankers attempting to control the curve, we end up with a much smaller group of individuals in control of the information that is represented by the yield spread. Through time, this position has also become the norm as the Bank of England4 and the Bank of Japan5 have followed suit. This was not the case in 1986, and so was not captured in the data that Harvey used in his paper. Since the publication of Harvey’s research, we have had a total rethinking of consumer behaviour as well as a reshaping of Federal Reserve policy which reduced the number of variables that the yield spread has to take into account. As a result, this may be a reason why we haven’t seen a US recession yet: the correlation between the two may be broken, leading us to see the longest inversion period in recent history. Although this doesn’t mean the indicator doesn’t work anymore, it may simply signify that it takes longer for the effect to take place. Discerning Bond Vigilantes readers will recall Andrew Eve’s 2023 Halloween piece6 highlighting that it’s not the inversion that’s the worry, it’s the steepness of the yield curve that you should fret over. To this end, we have seen a steady reversion of yields over the past few months to a more subdued level, which suggests that the anticipated recession has bugged out (as Maverick might say).

Source: M&G, Bloomberg as at July 2024
Between 1986 and the arrival of Greenspan, the theory has worked fine and has indeed predicted several recessions with accuracy. The argument here is that, given the length of time that has lapsed since the yield curve’s most recent inversion, plus the evolution of changes to central bank policy and consumer theory, the inversion indicator isn’t as accurate as it once was, and should therefore be treated with caution.
It’s either that or we really should all be singing “Highway to the Danger Zone”…
2 https://people.duke.edu/~charvey/Research/Published_Papers/P1_The_real_term.pdf
4 https://www.bankofengland.co.uk/-/media/boe/files/speech/2013/forward-guidance-and-its-effects
5 https://www.boj.or.jp/en/mopo/mpmsche_minu/minu_1999/g990409.htm
The value of investments will fluctuate, which will cause prices to fall as well as rise and you may not get back the original amount you invested. Past performance is not a guide to future performance.


