The UAE, the USA, and the value of rules based engagement
It’s only been two months since he took office, but Trump’s policy agenda has taken the world by storm. The new US administration has upended a lot of the norms, standards, institutions, alliances, and indeed most rules of engagement, that we have come to take for granted. The speed, breadth and scale of the attempt to re-orient America’s institutional architecture is unprecedented.
Whether intended to be strategic or not, such changeability in policy frameworks is uncommon for developed markets. History would suggest that if the events in the US were happening in Emerging Markets (EM), the downgrades from rating agencies would have likely been swift to follow. But the US, which still has one AAA rating, gets more leeway for its greater (albeit eroding) institutional strengths, and, more pertinently, the ‘exorbitant privilege’ [1] afforded to it by the dollar’s status as the world’s premier reserve currency.
Separately, in late February 2025, JP Morgan reclassified Qatar and Kuwait as developed markets given that their “cost of living” has exceeded the (JPM defined) EM threshold for 3 consecutive years.[2] As a result, both countries will exit the EMBI over a 6-month period. The UAE will almost certainly follow suit in 2026. Seeing as the GCC states were only inducted into the EMBI in 2019, this is a remarkable turnaround.
It is in the context of the above occurrences that I began to wonder whether the gap in the creditworthiness between the US (Aaa/AA+/AA+) and the UAE (Aa2/AA-) was still warranted. On the one hand, you have a wealthy, but aging and therefore slowing democracy where the uncertainty in economic policymaking is approaching crisis levels (see chart). The economic damage from this is likely to be lasting, and the consequences global. On the other, you have a rapidly-growing and (very) wealthy monarchy that is increasingly considered investor friendly, given its focus on securing the wealth of its future generations but isn’t a “free” society.
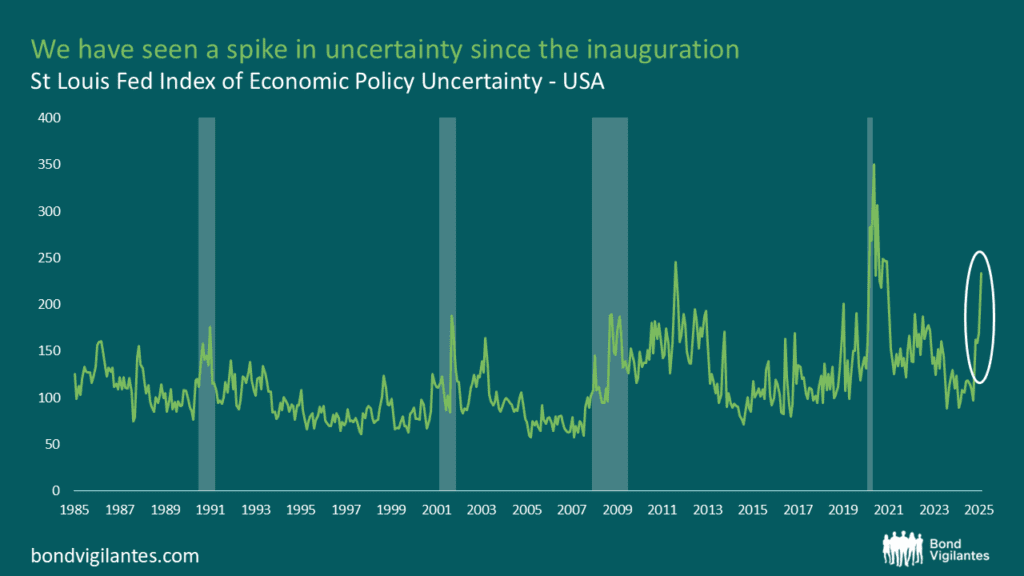
Source: St Louis Fed (February 2025)
In a previous life, as a rookie sovereign analyst during the Global Financial Crisis, I was called upon mid-tumult in 2008 to defend the AAA rating of the US. I also had ringside seats to the internal debate about what a “AAA” rating means, or indeed should mean.[3] So I do have some inkling of what the criteria for high grade sovereigns are and how they are applied.
Given that ratings are relative rankings, rather than absolute ones, the first step is to pick the appropriate peer group. For the purposes of this blog, I picked three members from the high-grade club that I thought were the most relevant/interesting:
- The US (Aaa (Neg)/AA+u/AA+u/Stable): Because it was for the longest time the ‘gold standard’ of ratings, the sovereign that ‘pegged’ the scale. As two downgrades to AA+ attest, the shine has come off somewhat, but the premier reserve currency status of the USD still matters
- Germany (Aaau/AAAu/AAAu/Stable): Because as a large, populous economy with reserve currency status, it is a sense check for the US
- Singapore (Aaa/AAAu/AAAu/Stable): Because it is the only ‘non-western’ sovereign in the AAA club, while also being one that Freedom House[4] classifies as only “partly free”.
In the main, creditworthiness is a measure of both the ability to pay, which is gauged by economic and financial indicators, and the willingness to pay, which is proxied by political and institutional indicators. However, in practice a handful of indicators have a lot of weight in determining where a rating lands. For example, in Fitch’s rating model World Bank Governance indicators (22%), GDP per capita (11.8%), nominal GDP as a % of world GDP (14.3%), gross general government debt to GDP (9%), general government interest/revenue (4.6%), real GDP growth volatility (4.5%), real GDP growth (1.8%) and sovereign net foreign assets as a % of GDP (7.5%) together explain 75% of the rating.[5] Reserve currency flexibility explains another 7.2%, but applies to very few sovereigns. Given that ratings more often than not tend to cluster around the same level, other rating agencies’ criteria are most likely pretty similar. So let’s explore each in turn.
GDP per capita: This is one of the most important economic criteria determining any rating level because it is the definitive measure of how much scope a sovereign has to raise revenues by taxing its constituency, and by extension, to pay its dues. The wealthier a populous, the higher this ability is. As the charts below show, in nominal USD terms, the UAE population is approximately about 2/3 as wealthy as that of the US and Singapore, and in line with that of Germany, so it certainly holds its own. However, when measured on a PPP basis, relative to the US, it fares even better.
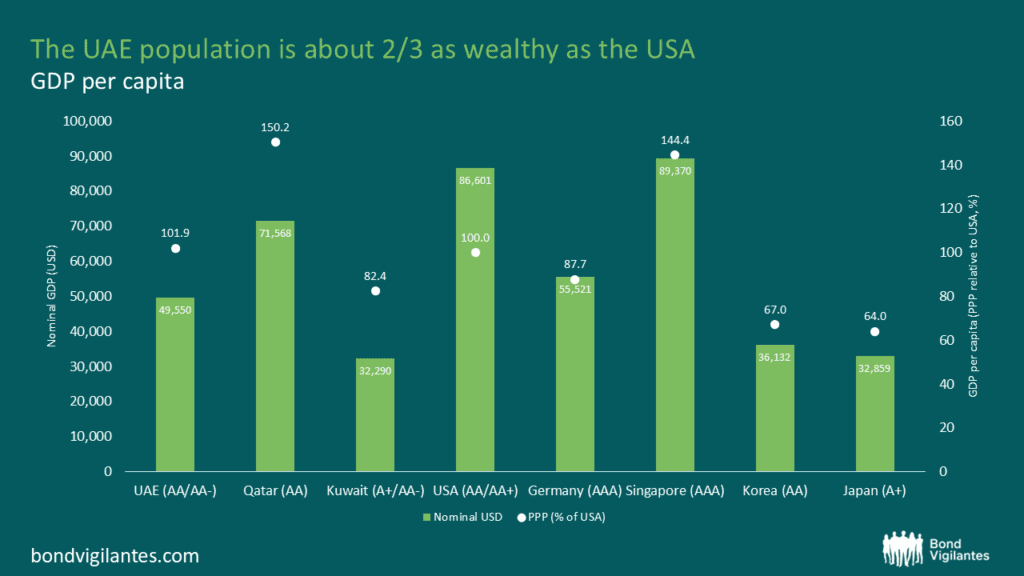
Source: Bloomberg, Fitch, M&G (31 December 2024)
GDP as a % of World GDP: Size matters. The bigger a country’s economy is, the better able it is to withstand shocks. However, while this variable is important, it isn’t a barrier to getting to the top of the scale. Take Luxembourg ($89bn), for example. There are quite a few high grade sovereigns that aren’t terribly different in size to the UAE ($536bn in 2024), like Denmark ($426bn), Norway ($496bn), and Singapore ($538bn).
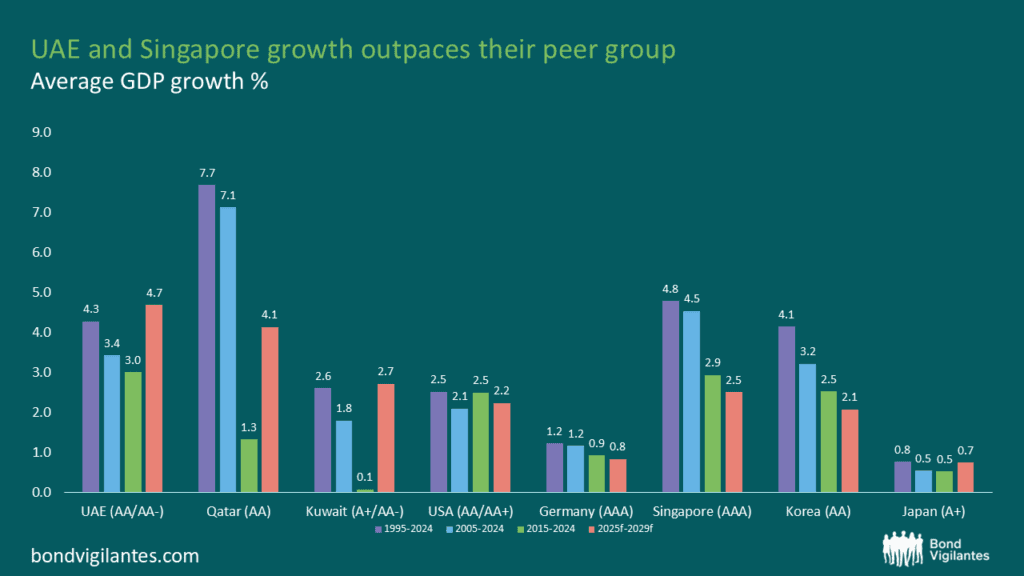
Growth: The usual path to a high level (stock) of GDP or GDP per capita is via a high pace of growth (flow). Another, is via substantial natural resource endowments that can be successfully developed. However, to accrete wealth, the sovereign also has to be able to maintain good growth performance for a sustained period of time, so it is important to take a look at long term averages.
Source: IMF, Bloomberg (31 December 2024)
Over the last decade, the UAE and Singapore outperform all the AAA peers. What’s more relevant is that, going forward, trend growth in the AAA cohort, including the US, is on a downward trajectory due to aging populations. The UAE is not burdened by this dynamic. In fact, quite the opposite: the UAE is seeing a rapid increase in population, 90% of whom are expats that are voting with their feet. This suggests that, ceteris paribus, its outperformance vs DM peers should not only persist, but increase going forward. Indeed, this is what the IMF’s forecasts for 2025-2029 reflect.
Source: Morgan Stanley (31 December 2023)
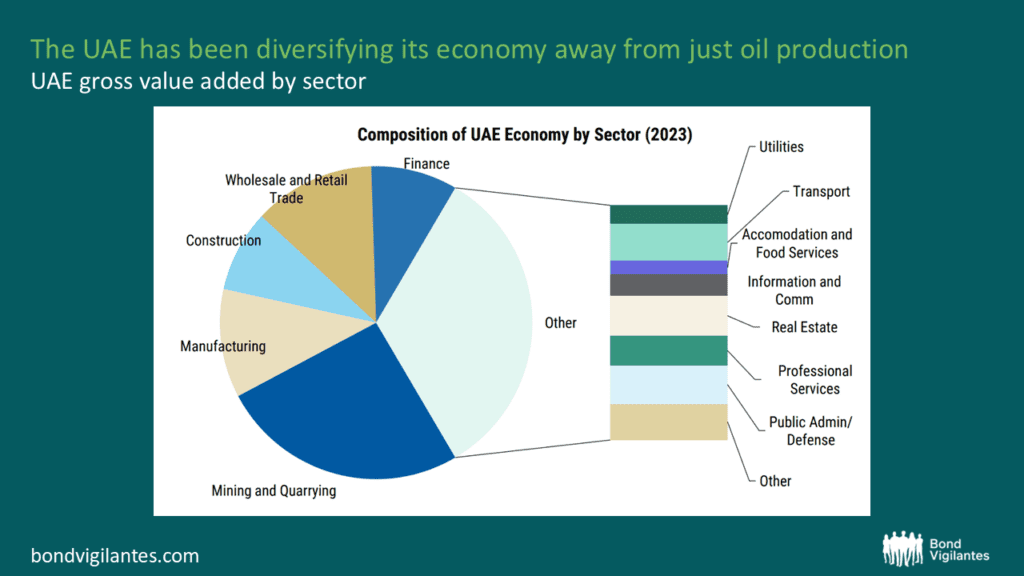
Growth volatility: A pre-condition for low growth volatility is that an economy is reasonably diversified so as to be able to withstand sector-specific/idiosyncratic shocks. Rating agencies often cite the “higher growth volatility” associated with the oil sector as a factor that detracts from the UAE’s creditworthiness, but the chart of long term rolling growth volatility shows the UAE to be in line with that of Singapore for the last 25 years. This is because the UAE has been diversifying. Non-oil GDP now comprises 75% of GDP vs 10% over 50 years ago and the non-oil sector has clocked higher growth rates than the oil sector for some time, driven particularly by finance and construction. Indeed, non-oil exports exceeded oil exports, in volume terms, for the first time in 2024. Based on current government plans, this diversification drive looks set to continue apace. Geopolitical risks to its economy, arising from its neighbourhood are also factors negatively towards the UAE’s rating. So it is noteworthy that the UAE’s growth performance has been sustained throughout periods of uncertainty in the broader region.
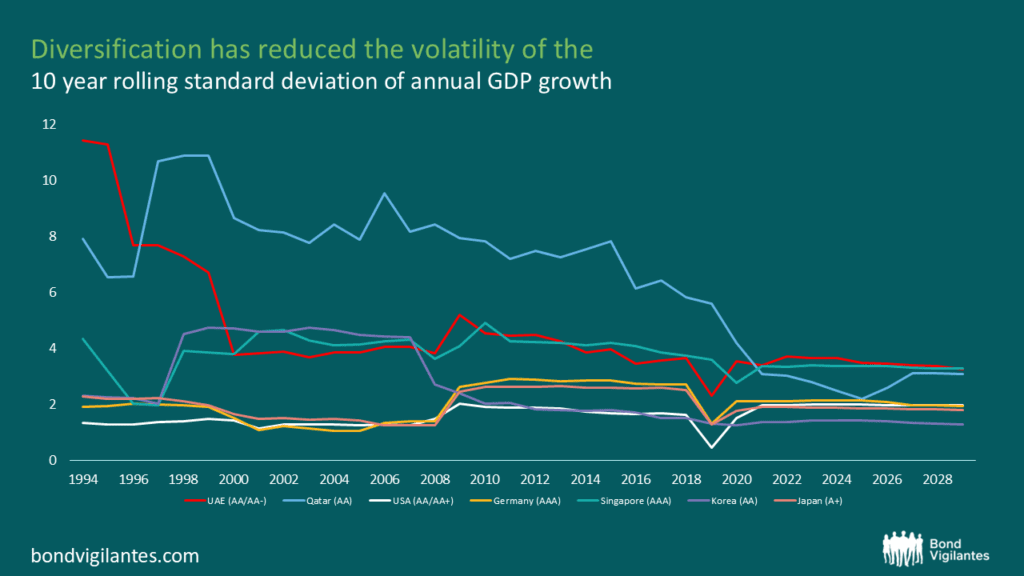
Source: IMF, Bloomberg, M&G (31 December 2024)
Debt to GDP: Lower debt is advantageous because in a pinch the state has the room to lever up if it needs to. By contrast, the larger a country’s debt stock, the lower the room for error/ability to absorb a large shock. Paradoxically, the higher rated a sovereign is, the higher its debt levels often tend to be. Why? Because people are more comfortable lending you money cheaply when they think you’re highly likely to pay it back. The UAE performs rather well on this metric as its leverage is low. This is because the UAE runs a tight ship. At the federal level, it is required by law to balance its current budget and has limits on debt issuance. By contrast, the US has shown little appetite for consolidation and has steadily been levering up from 55% of GDP in 2000 to and 120% of GDP in 2024. As a result, its debt levels are now more than 2x the AAA median.
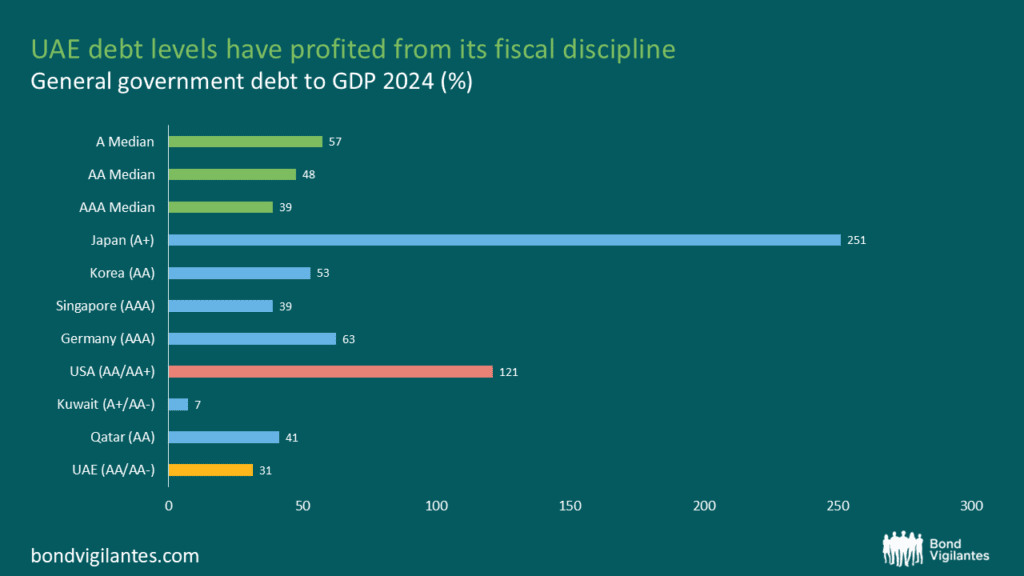
Source: IMF, Bloomberg, Fitch (31 December 2024)
Interest to Revenue ratio: While indebtedness is undoubtedly important to track, the cost of debt and debt affordability are especially relevant. The higher the interest bill as a proportion of revenues, the more constrained a sovereign’s fiscal space – EMs know this well. Although they have high debt levels, high-grade sovereigns can usually borrow fairly cheaply. But despite having the deepest and cheapest pool of capital available to it amongst sovereigns globally, the US’s interest to revenue ratio is a staggering 13.2% or 6x that of the UAE’s 2.3%!
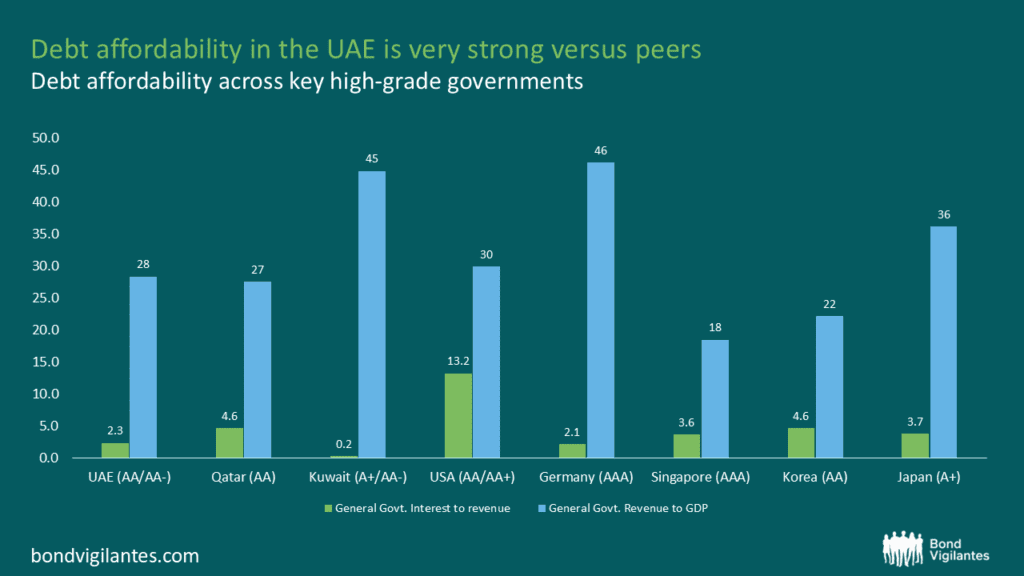
Source: Bloomberg, IMF, Fitch (31 December 2024)
For context, I’ve compiled a chart of all the sovereigns across the rating spectrum where the interest to revenue ratio is 13%-16%, as well the median interest to revenue ratio of each rating category. What the chart shows is that the US spends more servicing its interest bill than even the average B rated sovereign! Exorbitant privilege or just exorbitant?
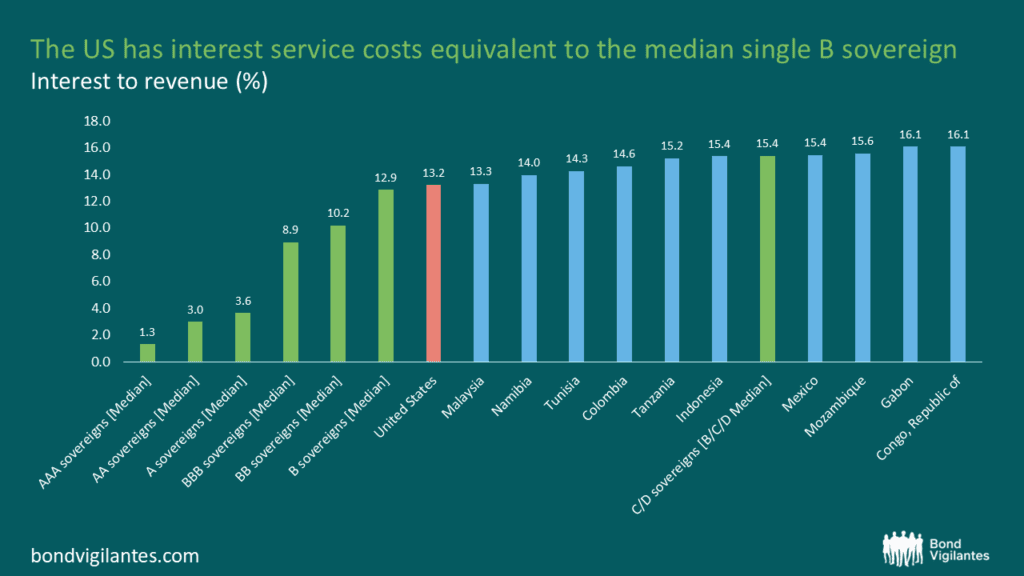
Source: Fitch (31 December 2024)
Sovereign Net Financial Assets (SNFA) as a % of GDP: SNFAs are official FX reserves plus other sovereign external assets, less sovereign external debt. Most high-grade sovereigns can typically meet most of their borrowing needs in their own, usually freely floating currencies, via deep pools of local capital that are readily available to them and don’t need to or tend to stash away a lot of cash at their central banks. However, those sovereigns that don’t have access to sizeable local pools of capital like Singapore, or those like the GCC who are also pegged to the USD, do. Fiscally prudent and/or resource rich sovereigns often also squirrel away their surpluses in sovereign wealth funds (SWFs). SWFs are fiscal assets that are frequently invested abroad.
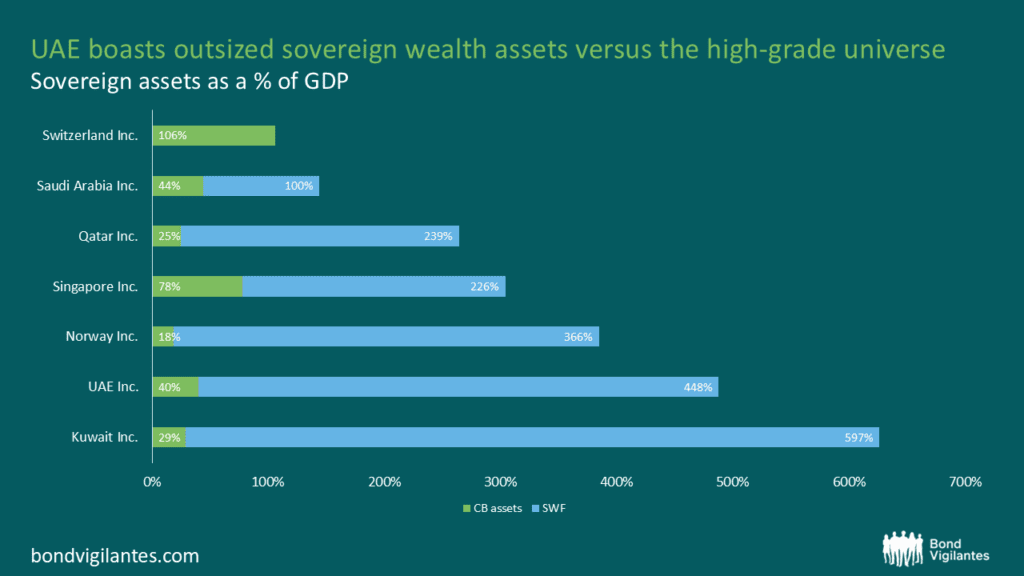
When accounting for SWFs, rating agencies often use a narrower measure of foreign assets, focussed on liquid assets that are well documented, especially in the case of GCC sovereigns where data is hard to come by. However, even measured conservatively, Fitch’s calculations of SNFA put the UAE at a 153% of GDP vs. 79.4% for Singapore, 90% for Switzerland, -5% for Germany and -32.3% for the USA (a negative sign indicates a country is a net international debtor). If I use a less conservative data source (Global SWF) the UAE’s financial heft vs its other high-grade peers is even more apparent, both in absolute terms and as a percentage of GDP. Meanwhile, the US is a net external debtor, but its status as the world’s pre-eminent reserve currency (55% of global reserve assets are currently held in USD, although this share has been falling)[6] earns it an uplift in rating terms. However, a large part of the US’s currency advantage accrues from the demand for USD assets that results from the growing wealth of the likes of the UAE. In other words, it is the outsized savings of sovereigns like the UAE that allows the US to feed its debt habit.
Source: Global SWF, (31 December 2023)
So far, so good. Where then, is the UAE falling short? This brings me to the sticking point for the UAE rating, namely governance, the factor with the highest weighting in the sovereign rating model.
World Bank Governance indicators (WBGI): While it might be possible for a fast growing upstart to catch up with the rich world in wealth, it is the strength of a sovereign’s institutions that determine its ability to sustain that wealth. Broadly speaking, institutional strength is a measure of the clarity, consistency and predictability of the rules of engagement in a society/economy. The clearer and more dependable the rules are, the easier it is to attract and retain businesses (capital) and workers (labour)- the key determinants of growth and wealth accumulation. Resilient societies and economies typically all display some common characteristics that are best quantified by the six WBGIs – the most widely used standardised measure of institutional quality and strength.
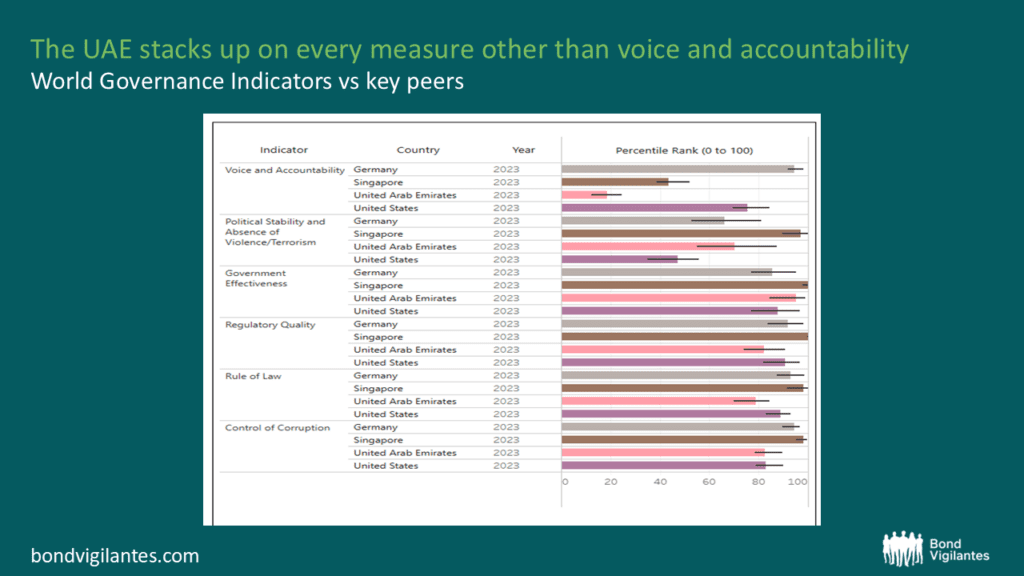
In purely numerical terms, the UAE doesn’t look out of whack. Its average score of all 6 indicators is 71.2 percentile vs 78.8 for the US, 87.6 for Germany and 89.5 for Singapore. Additionally, the UAE’s overall score has improved from 65.1 in 2011 to 71.2 in 2023, whereas the US’s score has fallen from 85 percentile to 78.8 over the same period. In fact on 5 of the 6 WB indicators, the UAE scores quite highly. What particularly drags its score down is one indicator – voice and accountability, essentially a measure of democracy and the freedom to oppose government, where it ranks amongst the bottom 20 percentile of countries globally.
However, it is interesting to note that Singapore doesn’t fare particularly well for a high-grade sovereign on this front either. While its current score is 43.6 percentile, this score has been as low as 34 percentile (2006), during the lifespan of its AAA status. Indeed, its score deteriorated to the bottom third percentile from >51 percentile at the time of upgrade (2002/2003) and yet this did not affect its rating. So while the lack of political freedoms and civil liberties clearly weighs against the UAE, given the trajectory for Singapore, there does appear to be some room for manoeuvre/discretion.
Source: Worldwide Governance Indicators (31 December 2023)
There are other similarities with Singapore too. In preparation for a post oil economy, the UAE is trying to position itself as a financial centre, a manufacturing hub, and a locus for trade and logistics – all of which it is well placed to do given its impressive infrastructure, cheap and plentiful energy supply, geographical proximity to large markets in the both the East and West, and recent capital markets reforms. Manufacturing already accounts for 11% of the UAE’s economy (vs 18% for Singapore), while Jebel Ali port in Dubai, is one of the only 3 non-Chinese ports in the 10 largest ports globally (the other two being Singapore and Busan). Meanwhile, recent capital market reforms have helped drive Dubai to 16th place in the rankings of financial centres globally (Singapore ranks 4th), an improvement of 4 places in 2024 alone.[7] Furthermore, recent visa reforms in the UAE that are designed to create a more stable workforce have led to an influx of professionals. High population growth (3% per annum, vs <1% in Singapore) will remain a vital driver of growth and an important barometer of reforms.
The UAE’s commitment to this structural transformation has also governed its pragmatic approach to geopolitics. It was the first of the GCC powers to seek better relations with its biggest regional threat, Iran, in a move that pre-dated the latest regional conflagration. This is something the Saudis are now finding beneficial to emulate, given uncertainty about the US’s intended approach to Iran going forward. It has also kept itself to the background on international issues, managing to steer clear of any confrontations with the US. Indeed, it has largely kept its head down and focused on enriching itself while trying to learn from previous mistakes (i.e. Dubai 2009).
It appears to me that, on the whole, the UAE compares favourably to the AAA cohort- from a credit risk point of view it’s vast wealth offsets other shortfalls. By contrast, the US compares unfavourably to a lot of its high-grade peers. Indeed, in the final analysis, a lot seems to hang on the Dollar’s status as the world’s pre-eminent reserve currency. But here’s the thing about the dollar, and currencies in general: at its core, money is a social contract. And social contracts are underpinned by adherence to rules, norms and standards that serve to build trust . Money (the dollar) only has value (premier reserve currency status) as long as enough people think it has value (premier reserve currency status). Trust is the true currency that financial markets intermediate, and trust is the very thing the current departure in American policy is struggling to inspire.
[1] Over the postwar period, the US has been able to borrow from abroad at low rates and invest abroad at higher rates (in terms of yields and returns); the difference is referred to as its “exorbitant privilege”, a term coined in the 1960s by Valéry Giscard d’Estaing, then the French Minister of Finance.
[2]Research – 2025 EM Sovereign Index Country Classification – J.P. Morgan Markets
[3] https://pro.fitchratings.com/entity/GRP_80442210/article/RPT_385922
[4] Freedom House is a non-profit non-governmental organization that conducts research and advocacy on democracy, political freedom, and human rights since its founding in 1941
[5] You can find more details on Fitch’s Sovereign Rating Criteria
[6] Dollar Dominance in the International Reserve System: An Update
The value of investments will fluctuate, which will cause prices to fall as well as rise and you may not get back the original amount you invested. Past performance is not a guide to future performance.


