
Seven scary charts to frighten investors this Halloween

Fixed Income investors may find themselves shutting the curtains and hiding under the sofa this Halloween. There is much to be fearful of – deterioration of developed market fundamentals, falling labour market confidence and slowdown indicated in shipping. And that’s just the beginning!
This pumpkin spiced latte season, we take a look at seven charts which look beyond the rally we have seen in risk assets. Perhaps its not all as rosy as it appears on the surface. Maybe it is best to check under the bed for market risks…
Happy Halloween!
- The EM-ification of DM? Investors find DM fiscal sustainability scary
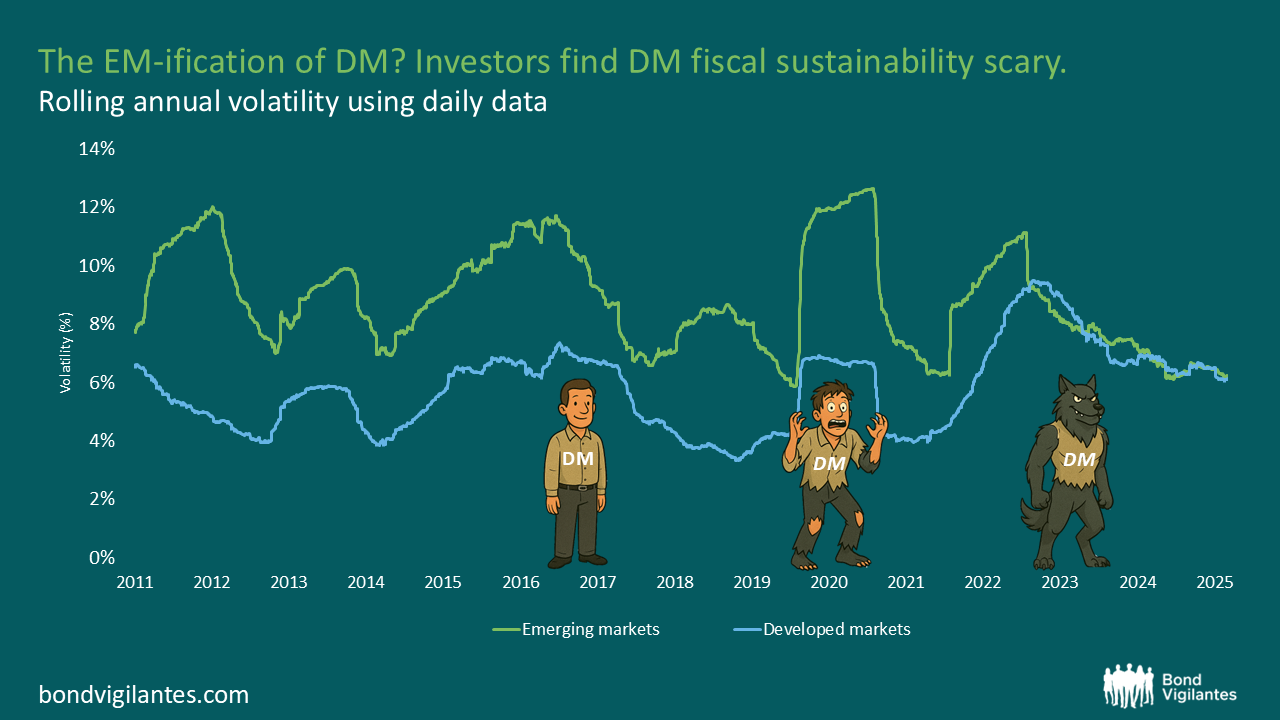
Source: Bloomberg and JP Morgan. As at 30 September 2025. Indices used: JP Morgan GBI-EM Global Diversified Composite – Gross Return (USD Unhedged), ICE BofA Developed Markets Sovereign Bond (USD Unhedged)
As developed market economies continue to carry historically very high levels of debt, and with government bond issuance at all time highs, there is increasing convergence in volatility between EM and DM. The fundamentals in EM look solid, but there has been a deterioration across DM. This werewolf type behaviour hasn’t gone unnoticed, and markets are starting to price this in.
The full moon has DM fundamentals howling
- Darkness approaching? Labour market confidence signalling recession?
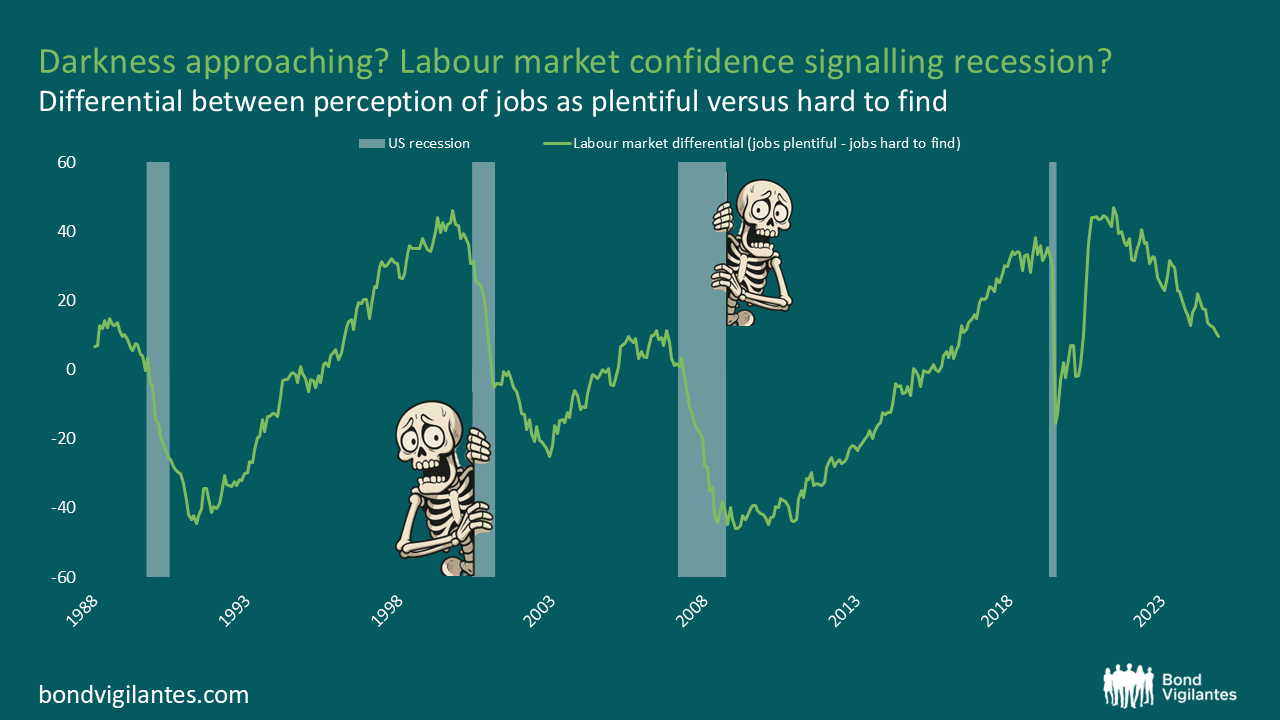
Source: Conference Board, Bloomberg (CONCLBDF Index), 31 August 2025
Strain in the labour market is a classic sign of a recession. The Conference Board Consumer Confidence Labor Differential is suggesting some significant deterioration in the availability of work. Spotting recession is easy in hindsight, but perhaps it has already made its way into the house hiding behind the door? The shape looks familiar to that of recessions gone by… could history be repeating itself?
Nightmare on Wall Street
- Interest expense taking the opportunity of better services away?
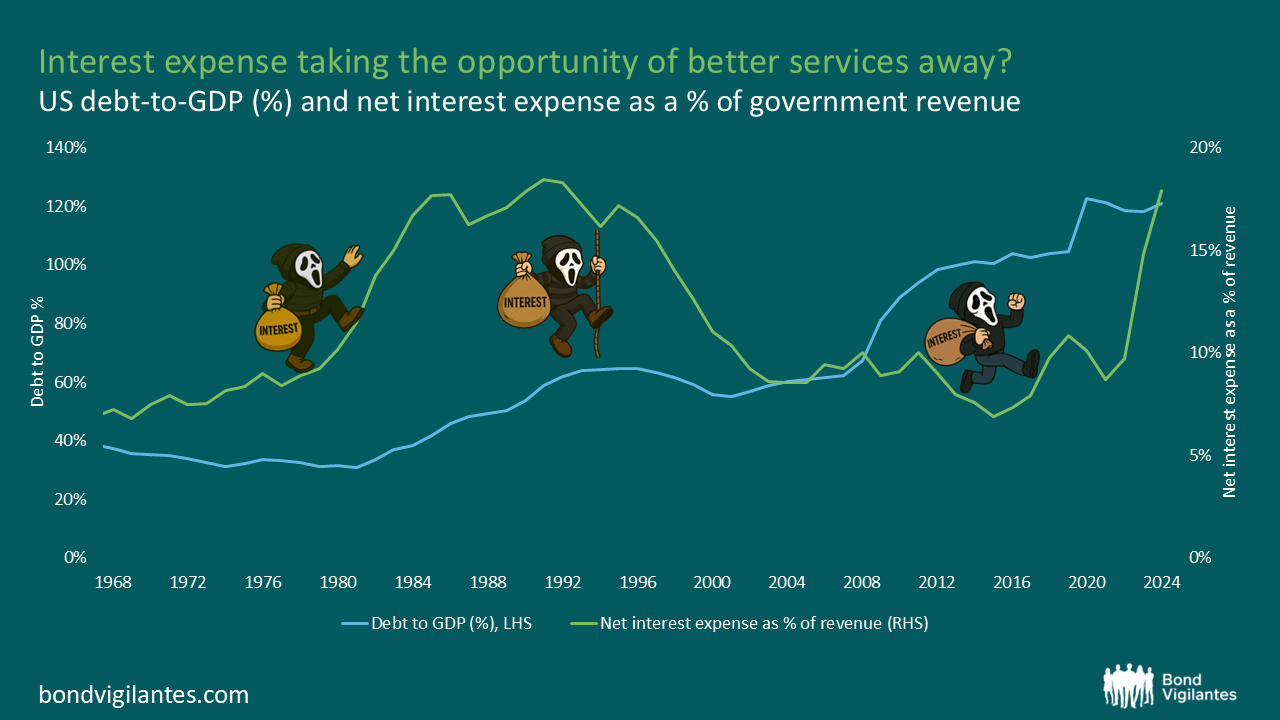
Source: Bloomberg, Congressional Budget Office (31 December 2024)
US government debt levels have been soaring in the last 10 years. We find ourselves in a situation where interest payments servicing US debt are well in excess of their defence budget ($800 billion)! With so much money being spent on interest, what are the consequences for citizens in terms of services, and what effect does this have on growth? Is this a downward spiral that is tricky to escape?
‘Do you like scary net interest expenses?’ Enough to make you SCREAM.
- A terrible fright in US freight – leading indicator for slowdown?
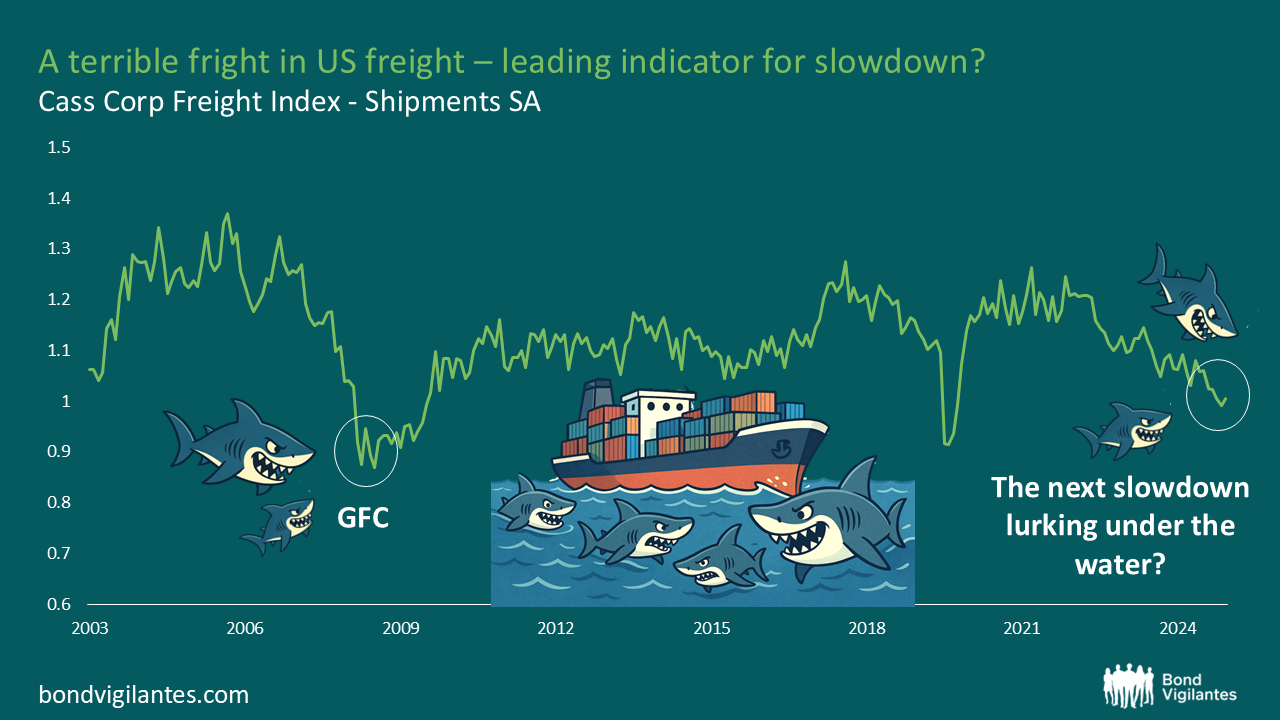
Source: Bloomberg (30 September 2025)
The Cass Freight Index is a measurement of monthly freight activity. A combination of restrictive monetary policy and a weakening consumer has led to a deterioration in the data, and the impact of tariffs are yet to be fully felt. We are approaching levels that we last saw during the Global Financial Crisis – serious slowdown in the economy. Perhaps this is indicating something more malicious lurking under the surface in the global economy? Are we yet to feel the full effects?
‘We’re gonna need a bigger boat!’ and more of them! Or the slowdown is upon us.
- A trick for equities, a treat for fixed income?
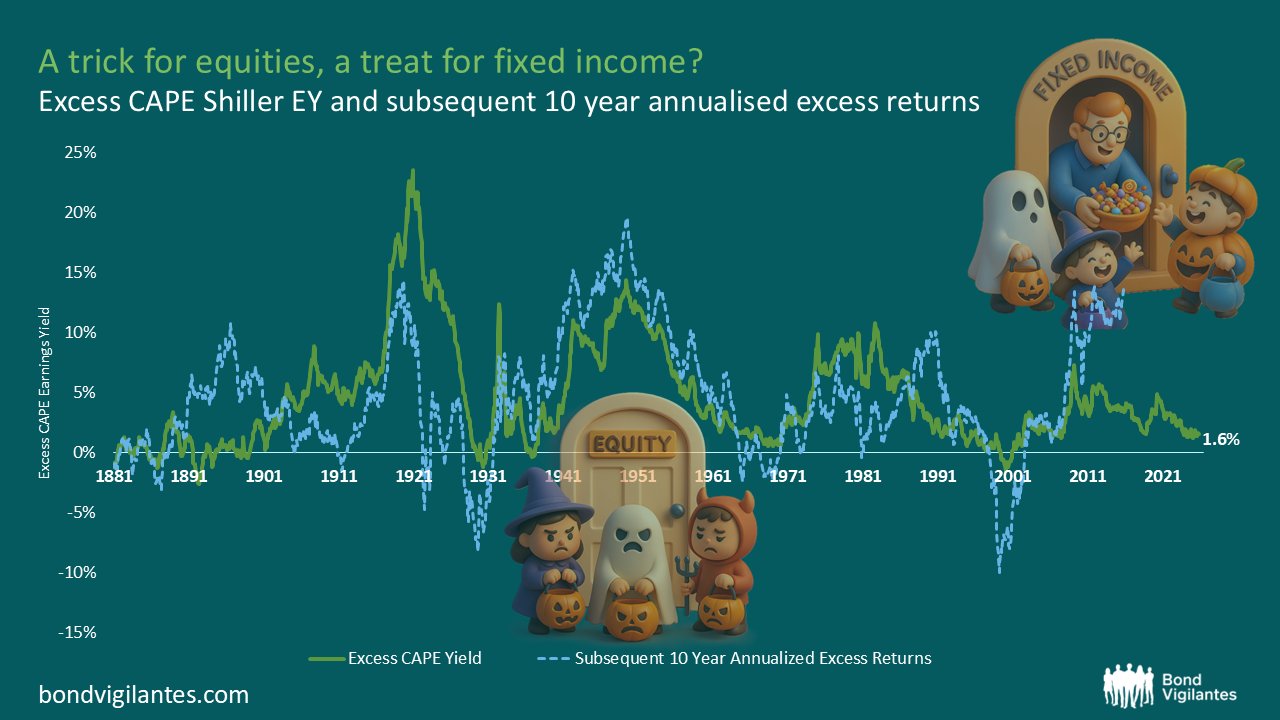
Source: Robert J Shiller, Irrational Exuberance (updated, October 2025)
During the 2010s there was no alternative but to invest in equities. However, this is no longer the case. Bonds are back! Back to 1881, the excess CAPE Shiller earnings yield has been a strong indicator of subsequent 10 year returns in equity markets. The 2010s produced supernormal returns, but valuations are becoming increasingly stretched. At current levels, the S&P 500 would return 1.6% in excess of bonds annualised over the next 10 years. With risk-free 10 year US Treasuries offering a return of 4%, and that lack of decent equity risk premium, bonds are considerably more attractive. All this before picking up the extra return on offer in credit markets, and potential outperformance from here with an active manager!
‘Who ya gonna call?’
‘Fixed Income!’
- The ghost of the GFC in London housing starts and sales?
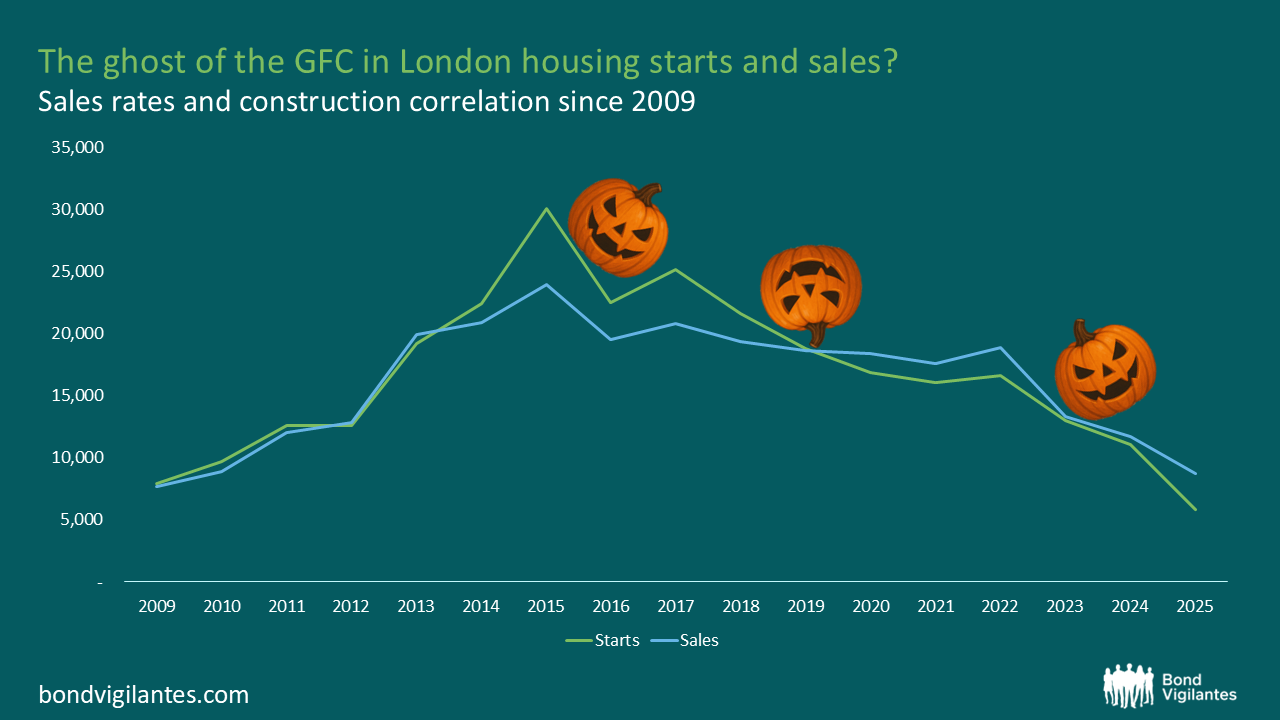
Source: Molior (30 September 2025)
The housing market can be a good temperature check for any economy. If the housing market is hot, this has multiplier effects to other sectors as home buyers purchase new furniture, carpets, appliances etc. London housing starts and sales are now down at GFC lows – a potential indicator of an economic slowdown when reflected on a national scale. There are moves afoot to boost the housing market and encourage further housebuilding through much needed planning reform in efforts to avert a slowdown. If there is a recession coming, will it be as deep as the GFC? We think not, although it may be ‘L shaped’.
Déjà Boo: housing starts and sales in London have a scary resemblance to 2008
- A Sixth Sense in the US auto loan market?
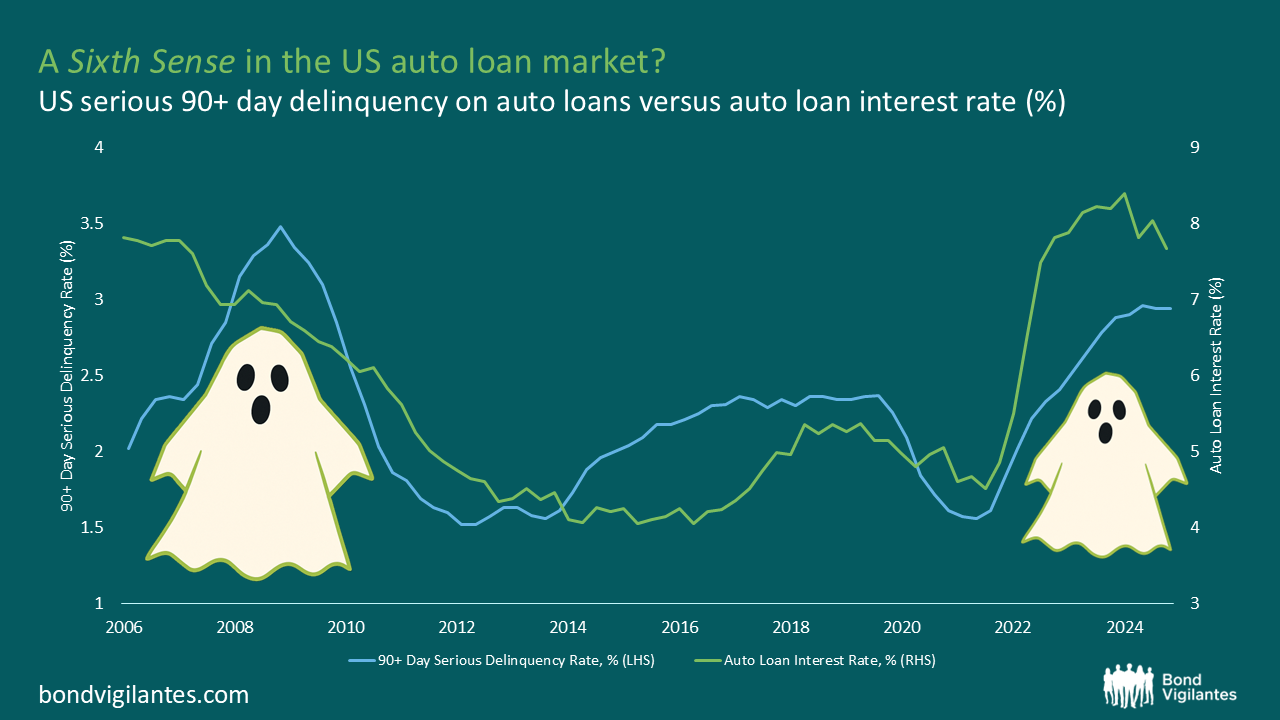
Source: M&G, Bloomberg, St Louis Fed (30 June 2025, latest available data)
There has been a strong uptick in serious auto loan delinquencies (defined as repayments 90 days+ past due) as the impact of the higher rates environment has been felt by consumers. We are now at levels approaching that of the GFC. Perhaps this shows us the weakness that is being felt by the consumer. Over the course of this chart, the total debt outstanding in auto loans has risen from $800 billion in 2008 to $1.65 trillion in 2025 (acknowledging inflation and the rise in car prices in this period, albeit many more cars are now on financing deals).
‘I see dead auto loans’ – are we seeing the weakness of consumer like in 2008?
The value of investments will fluctuate, which will cause prices to fall as well as rise and you may not get back the original amount you invested. Past performance is not a guide to future performance.

