World Cup
The Bond Vigilantes World Cup Model
By Joe Sullivan-Bissett
11 June 2026


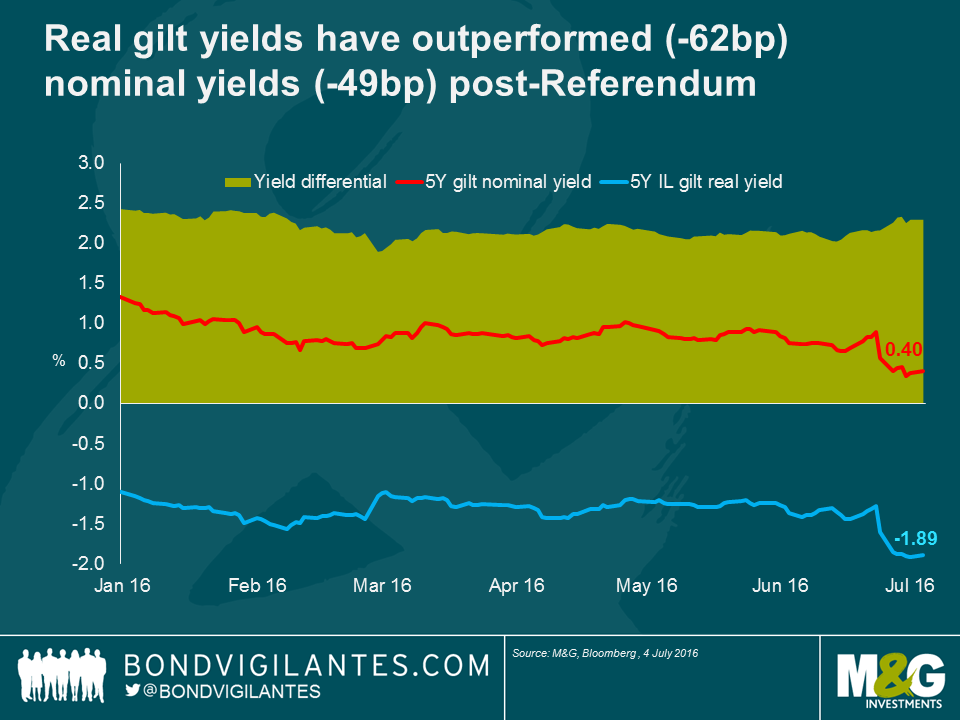
I wrote ahead of the UK referendum that I felt front end index-linked bonds were a good way to play the uncertainty surrounding the result, given the fact that they have crucial non-binary hedge characteristics. Since the result, breakevens (i.e. the market’s expectation of future inflation) have behaved exactly as expected, rallying. The chart below shows how nominal yields have collapsed to record lows but real yields have fallen even further, meaning that 5-year breakevens have rallied since the result was announced. This is exceptionally strong relative performance for index-linked gilts.
The major driver of this outperformance, which is all the more remarkable given it has occurred in an environment of falling nominal yields, has been an expectation of rising import inflation owing to sharp falls in sterling. On a trade-weighted basis, sterling is down around 9% since the referendum. The old rule of thumb that UK and Eurozone Economist at Scotiabank (aka inflation guru) Alan Clarke uses is that there is a 10:1 pass-through of sterling to inflation or, in other words, that a 10% fall in the pound will add 1% to inflation. When taken in light of this, the market’s response to the near 10% fall in the pound is not irrational, as a 20bp increase in inflation expectations in each of the next 5 years is pretty close to adding 1% to inflation compensation over that period of time.
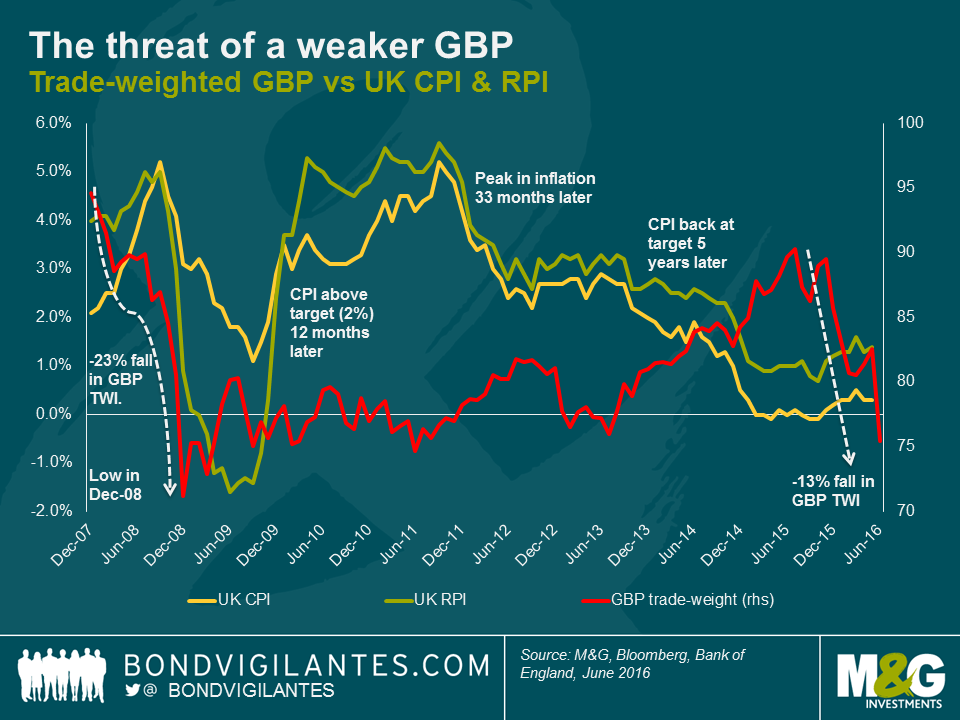
The above chart suggests that there is good reason for the market to look at the weakness of sterling and start to price in more inflation. Looking back at the global financial crisis, the pound weakened by 25% and, after a lag, RPI rose by more than 6%. This suggests that the scope for inflation expectations could have further to run.
Doing some simple calculations, a 6% inflation uplift after a 25% fall in sterling is closer to a 25% pass-through than to 10%. Indeed, Kristin Forbes of the Bank of England told markets last year that the BoE estimates a 20% to 30% pass-through from the exchange rate to CPI. This could mean that the 9% fall in the pound since the vote could bring a 2% increase in inflation over the short term. It is also important to point out that sterling has been on the slide for almost exactly 12 months now, over which time it has fallen by nearly 16%. Some of this weakness will start to show through in inflation imminently (given a 12 to 24 month time-lag). If we apply the experience following the financial crisis, and the Bank of England’s pass-through estimate, the UK might be on its way to seeing 3% to 5% higher inflation in the not too distant future.
At this point, it is important to acknowledge that there could be some downward pressure on UK inflation going forward. UK RPI includes around 15% to 20% of housing, made up of both house prices and mortgage interest payments. Mortgage interest payments now look even less likely to move upwards following the referendum, and you could convincingly argue they are more likely to fall now. House prices also look set for a fall, which means RPI will be dragged down. Perhaps more importantly, though, is that CPI does not contain these items, and so the wedge by which RPI is greater than CPI looks to me at this point to be set for a fall.
Besides the currency, there are other reasons that are making me positive on inflation-linked assets going into the second half of this year and into 2017. One is that we are nearing the point at which oil price moves will cease being a negative drag on inflation. January to April 2016 saw oil languishing below $40, so the first quarter of 2017 should see some strong positive contributions to inflation numbers, assuming commodity prices don’t plunge from current levels. In addition, the UK’s large and near record current account deficit could put further pressure on the already fragile pound. I expect these factors to outweigh and disinflationary impact from falling interest rates or house prices. As a result, even with the strong performance since the referendum result, I would continue to argue that there is still good value to be had in short dated index-linked bonds.
Over the last few days and weeks, as the odds of a vote to leave in the referendum have moved from a remote possibility to somewhat less so, market participants have spent more and more time wondering about how they are positioned going into the vote, relative to their benchmark, their peer group, or their risk budget. The significant moves that we have seen in recent trading sessions show pretty clearly that many were not content with their positions or risks going into the vote, as evidenced by a pretty clear period of volatility and risk aversion with selling of credit risk and a rally in government bonds.
Only a couple of weeks ago, the credit markets were frantically fighting to get hold of reasonable quantities of the significant amount of new issuance we were seeing from investment grade companies. A few weeks later, issuance has ceased and sellers of these much sought after bonds seem to be outnumbering buyers, given the back-up in credit spreads seen in recent sessions. The simple conclusion is that as the odds of Brexit rise, investors feel the need to reduce risk and are selling corporate bonds.
Playing devil’s advocate, let’s imagine that a portfolio manager has sold credit risk and raised cash ahead of next week’s vote. The portfolio manager is now feeling very satisfied at this moment in time as risk aversion has increased, resulting in a widening of credit spreads. However, the vote outcome is binary: either Britain votes to leave, or to remain. If the vote is to remain, then we can reasonably expect a significant retracement of the spread widening we have seen since fears of a leave vote rose.
If this proves correct then our imaginary portfolio manager is under-invested in credit and the credit risk that he or she sold will now need to be bought back, potentially at more expensive levels. Even if spreads did not rally in the event of a leave vote, then to replace the bonds that were sold, the portfolio manager will have to pay the prevailing bid-offer spread.
In other words, those selling credit risk now are predicting a vote to leave. This decision will benefit a bond portfolio as spreads rise, or as the leave probability increases, or if the leave vote were to occur (at least for a period of time, however long or short). But it does not work in the event of a vote to remain, and incurs costs on the bond portfolio.
Now let’s think about what to do with our duration positioning going into the vote. This, in my opinion, is an even harder call to make than with credit. Which way will gilt yields move in the event of a leave vote? On the one hand, the period of economic uncertainty that would result could see growth and inflation fall, which would argue clearly in favour of further falls in government bond yields. On the other, international investors currently own more than a third of the gilt market. What if these investors decide they no longer want to own sterling, or to own the same amount of sterling? Whilst my hunch is that the knee-jerk immediate response to Brexit would be for sterling to weaken and for gilt yields to rally further, how long would these moves last? Could we end the day with higher gilt yields and no change in the pound? Either way, the direction of travel of gilt yields is highly uncertain to me, which makes hedging or positioning duration for the referendum a very tricky call.
In my opinion, owning short dated breakevens is the most prudent way to go into the vote from the perspective of duration positioning. Firstly, if you believe that the currency is likely to weaken then you should own exposure to inflation linked bonds that will, especially at the front end, see higher inflation expectations from import inflation. This will support index linked valuations relative to nominal bonds. In other words, front end breakevens are likely to rise if sterling weakens. Secondly, putting the currency to one side for a moment, if yields rise (either on a leave vote as foreign sellers of gilts emerge or on a remain as risk appetite recovers and rate hikes are brought forward), then one would typically expect breakevens to rise. In this scenario, index linked bonds also outperform nominal bonds.
If yields fall on the other hand, a scenario most likely to happen in the event of a vote to leave due to risk aversion, then whilst typically breakevens fall, and so index linked bonds are underperforming nominal ones, at least owning breakevens means having a pretty decent link to nominal yields. It is difficult to create a scenario in which nominal yields rally strongly following a leave vote and index linked bonds fall in price (this scenario would be one in which inflation fears aggressively collapse, so it is not impossible, but it is unlikely).
So I believe that given the binary nature of the result, in which we are either in or out (what odds on 50:50, and what happens then?), the best way to be positioned in terms of duration ahead of the vote, outcome and aftermath is to own short-dated inflation linked bonds. It is not binary, as whilst owning breakevens means you are positioned for higher inflation, if breakevens fall following the vote and nominal yields fall, you are still linked to nominal yields and are likely to see the price of your bonds rise.
If the currency weakens after the election result, then import price inflation will lead to rising inflation expectations. And if the currency doesn’t weaken following the result, it has still been on a downward trajectory since last November which is yet to feed through into RPI, and the ugly current account deficit suggests on a medium term, fundamental basis, that there is more weakness ahead for sterling.
Finally, there are a number of reasons to choose front end index linked bonds. Firstly, front end breakevens are the cheapest on the curve. Secondly, the front end of the index linked curve is most likely to reflect inflation surprises and outcomes (such as oil base effects, sterling weakness, wage growth in the bonds’ prices); and lastly, because with gilt yields at all-time lows, it is prudent to keep interest rate risk at a relatively low level at this juncture.
2015 saw global inflation risk premia collapse, led by the developed world. US, UK and European annual inflation rates spent most of the year at or around zero with numerous dips into negative territory. Short dated breakevens correspondingly fell to levels that we last saw during the financial crisis (well, to be fair, they went far lower back then, but we are still at crisis levels today), and bond valuations in large parts of the world were supported by the lowflation and secular stagnation conditions that prevailed.
Looking back, three months of inflation releases ago (October 2015) US CPI was 0.1% year over year, the PCE deflator (i.e. the rate the Fed actually tries to target at 2% – see my recent blog) was at 0.2% and fears of deflation were rife on the back of ongoing energy and commodity price collapses, concerns of a Chinese hard landing, the coming interest rate hiking cycle and (related) strong US dollar. The start of 2016 came with a new list of deflationary forces to panic about: a renewed collapse in oil (where the second year halving in price we had once written off suddenly became much more likely), concerns of further Chinese devaluation, and growing fears that the US might even be entering a full blown recession. As a result of such deflationary noise, 5y breakevens hit post-crisis lows of 0.95% in early February.
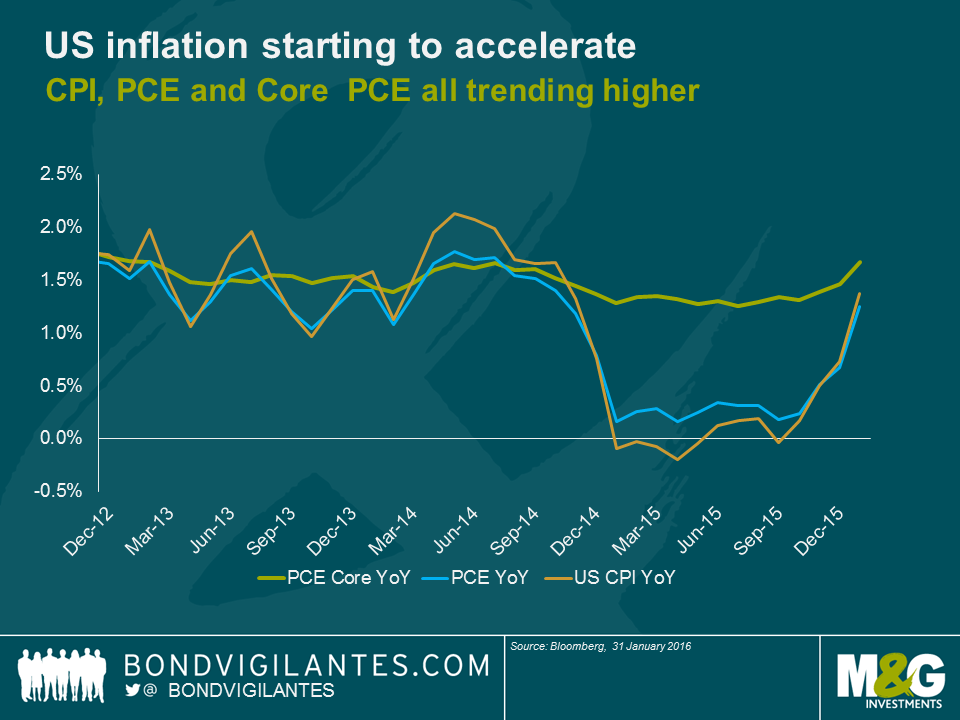
But the inflation picture looks to have changed over the past few months. CPI is now 1.4% and Core PCE is at 1.7%, not far off the desired 2% and already above the level the Fed had it peaking at at the end of 2016.
Inflationary forces are broadening and accelerating, and it is happening fast. Recent data has shown that goods prices, in spite of the strong dollar, are now rising. Furthermore, ‘sticky’ components of inflation, the major part of which is services, are seeing price rises pick up too, currently running at 2.5%. Rental costs continue to be a source of rising prices and, interestingly, medical costs are now showing signs of life after a period of stagnation early in Obamacare’s life.
It’s true that energy costs remain a drag (and February will be a more negative month for energy contribution than January was), but in a few months’ time (provided the oil price stabilises around current levels) the negative base effects will progressively fade away. When this happens, the rebound in US inflation will exceed that seen in Europe or the UK. In addition the US labour market is tighter than anywhere else and wages are starting to behave as though the NAIRU has been reached.
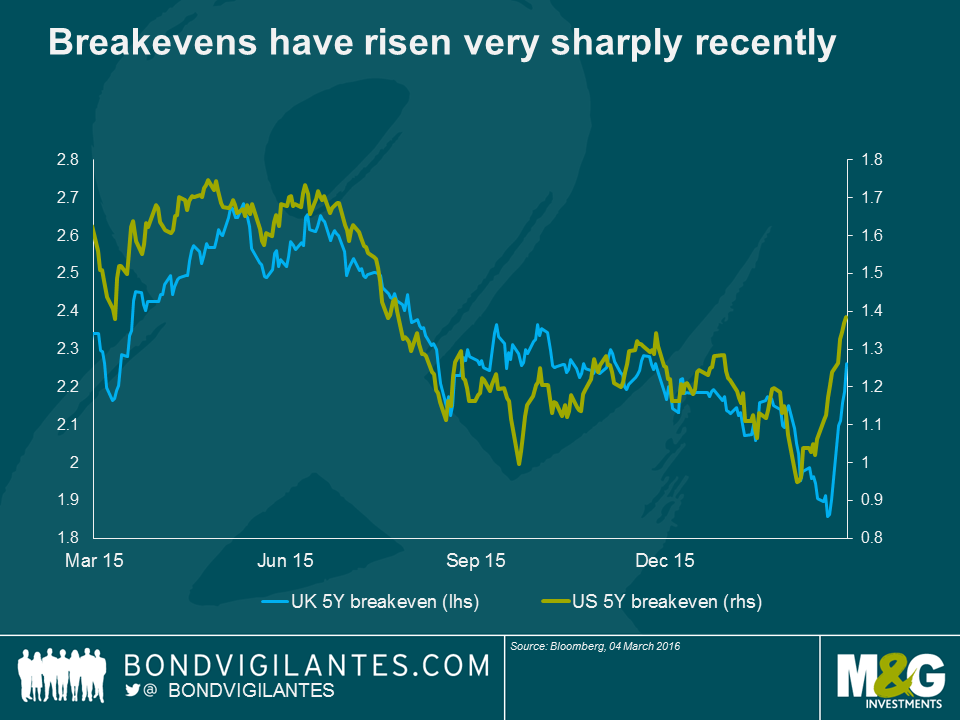
Three months ago inflation was closer to zero than to target. Today it is closer to target than to zero, and is trending higher. The bond market is clearly taking notice. As the chart above shows, US 5 year breakevens are up around 40 basis points over the past three weeks, and UK 5 year breakevens are up a similar amount. A lot depends on the oil price in the near term, but if inflation numbers continue to repair back towards target, then it seems likely to me that breakevens can go further than they have done so far; perhaps significantly so.
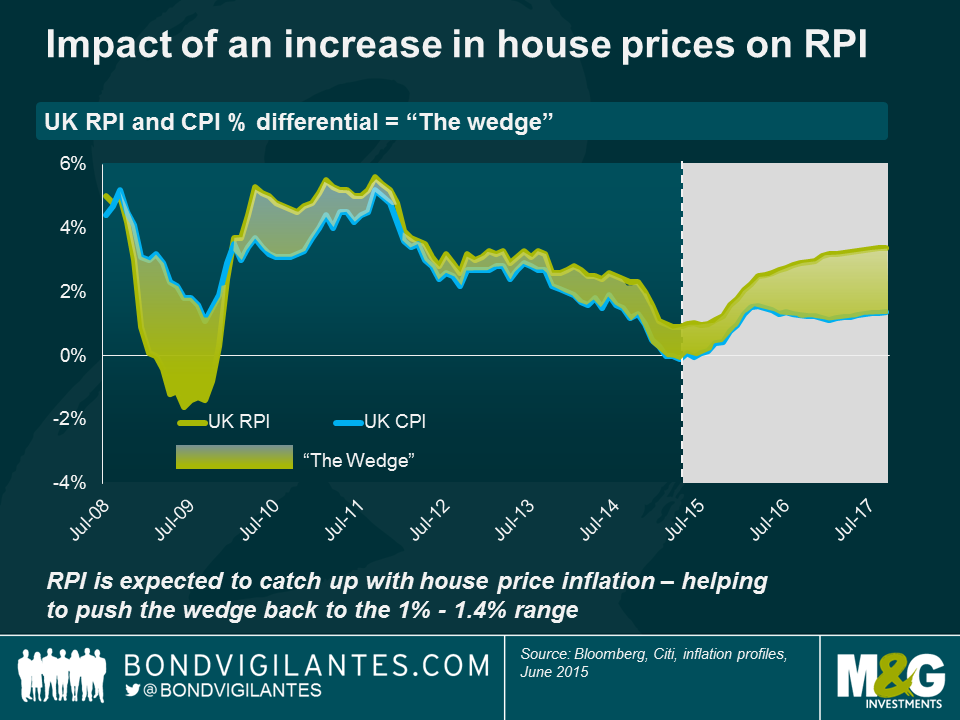
There has long been a well-known ‘wedge’ in the UK index linked bond market, since the bonds pay RPI and the Bank of England targets CPI. The wedge is the difference between these two price indices, and over the long term is thought to be approximately 1%. So over the long term, and with all sorts of caveats, RPI will be around 1% higher than CPI. The reasons for the wedge are essentially that they are different baskets of goods and services, calculated differently. It is worth pointing out in passing, though, that given the significantly higher proportion of housing related costs in RPI (both prices and mortgage interest payments), the wedge should perhaps be expected to go higher still if house prices continue to rise and / or if interest rate rises do indeed ever come.
In the US, there is the similar risk of a wedge developing. This owes to the same feature of the UK market, namely that TIPS pay CPI as the inflation compensation index, and yet monetary policy makers target 2% not in CPI, but in PCE. Once again, these are different baskets, calculated differently, with different weights, and so they will seldom give you the same inflation number. Historically, the wedge has been approximately a quarter of a percent. It is worth keeping in mind that PCE measures spending by and on behalf of the personal sector, whilst CPI attempts to measure out of pocket spending by households.
Housing costs and medical care costs look set to see the wedge between CPI and PCE rise above today’s 0.1% in the not-too-distant future. These relate in part to the formula effect, but also to the differences in weights in the two indices. Housing makes up 42% of CPI and 27% of PCE. Thus, when the housing market is strong and vacancies are low, CPI should be expected to increase at a faster pace than PCE. Medical care costs (6% of CPI and 22% of PCE) are also going to drive the wedge upwards, but in a different way. Medical inflation is set to be kept extremely low for at least the next 10 years given the prices being fixed for these costs by the government with regards to Medicare and Medicaid. CPI medical costs are not being state administered and so will not be held so low.
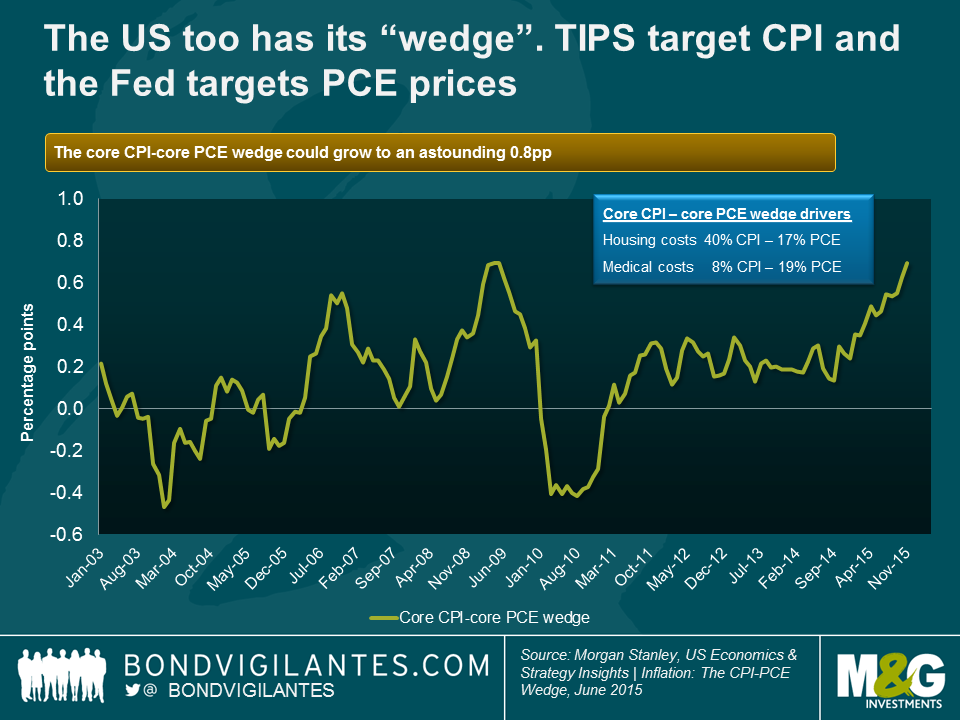
The chart shows how significant the wedge could become in terms of core prices, where it looks like the wedge could reach 0.8% and possibly go further. But as bond investors, we are most interested in the headline numbers as they define our inflation compensation in TIPS and the inflation target the Fed is striving towards. Morgan Stanley estimates that the headline wedge could become 0.5%, on account of the housing and medical cost differences. So if you believe, as I do, that the Fed is serious about its inflation target, then if PCE is 2%, CPI could be 2.5%. As a holder of TIPS, that extra 25% inflation compensation is only a good thing.
The labour market appears to be tighter in the US than in the UK or Europe at the moment, with less spare capacity and a greater likelihood of wage growth coming through this year. That is one reason an investor could prefer TIPS to index linked gilts or European linkers. Another reason for preferring TIPS is that the base effects from oil have been more severe on the way down in prices in the US than in the UK and Europe, and so will be more positive if the oil price stabilises or even rises. To these two positive reasons for investing in TIPS we can now add a third, that for the Fed to hit its 2% inflation target, CPI is going to be significantly higher.
It has been a while since we last uploaded a video from one of our U.S. research trips. The question we asked in March as to whether the Fed would hike interest rates this year or not has still not been conclusively answered. Although a 2015 hike is not completely off the table, as we are entering the final two months of the year it seems a lot less likely than it did back then. Nonetheless, from a macro-economic point of view, the U.S. economy has since continued to recover. We are particularly focused on the labour market at this point in time, which is painting a more benign picture of the U.S. economy than many other areas. On the credit side, USD denominated investment grade corporate bonds as whole now offer distinctly more attractive credit spread levels than in the first quarter of the year.
This morning CPI in the UK has fallen from 0.1% in July to 0% in August, both in year-over-year terms. Continuing deflationary trends observed in transport (largely petrol) and food (supermarket price wars), which have together taken 0.7% off CPI over the last year, were dragged back up to the zero bound by alcohol and tobacco (these always go up!), education and restaurants and hotels, with smaller positive contributions from most other categories.
RPI, though, increased from 1.0% to 1.1%, and with CPI at 0%, this sees the ‘wedge’ increase to 1.1%, above the widely perceived fair value of 0.8% to 1%. UK index linked bonds pay inflation linked to RPI, and so holders of linkers are not experiencing noflation or deflation. In fact, several commentators are forecasting this wedge to grow to 1.5% next year, owing to the usual suspects of the formula effect (arithmetic vs geometric mean calculations), the constituent effect (the baskets contain different weights of different items), and in particular the housing market effect. RPI includes house prices and mortgage interest payments, which CPI does not. With house prices seemingly on the up, and with interests surely more likely to go up than down, these two factors could push the wedge beyond fair value, a positive for holders of UK linkers.
Over the last 12 months CPI has fallen by 1.5%, again largely driven by food, utility bills and transport. Core CPI has fallen by 0.6%, largely driven by used car prices and recreation and culture, particularly audio visual equipment. Essentially, headline CPI is being hit by energy and commodity prices (c.75%) as well as the strong pound (c.25%), whilst core CPI is being mainly dragged down by the strength of sterling. Core CPI strips out the volatile items of energy, commodities and food. But is the strength of sterling to be viewed as a non-transient and non-volatile driver of core inflation?
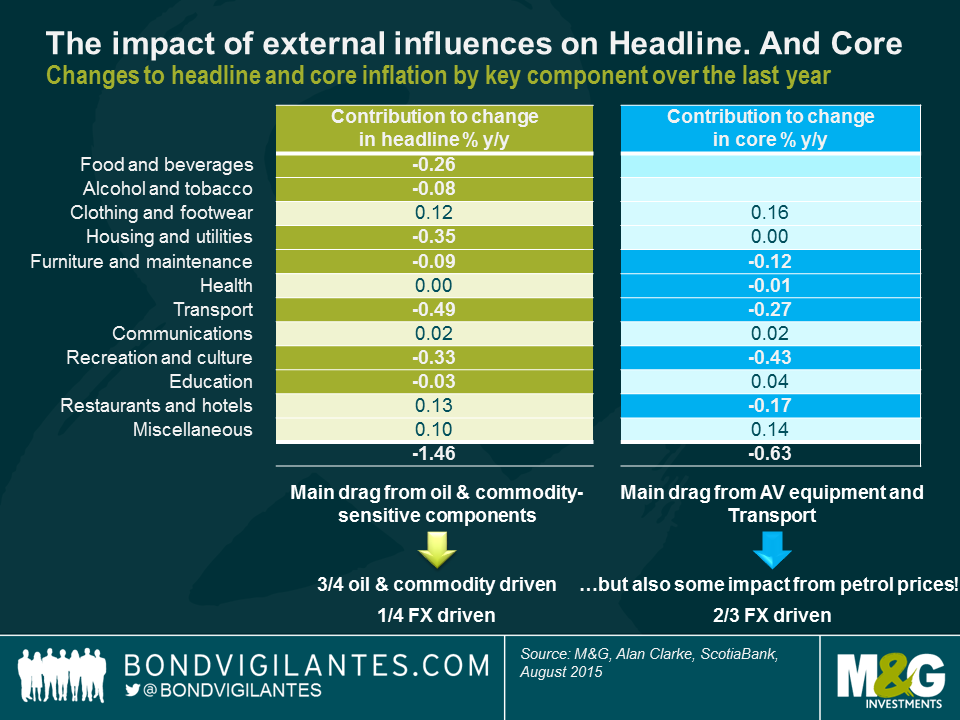
In actual fact, every good, wherever it’s made, needs to get from its point of manufacture to the shop shelf, so transport costs are going to be a major driver of the prices of goods that make it into core inflation numbers. In other words, core inflation is not as core as we may think. But on top of that, sterling’s 20% appreciation in trade weighted terms over the last two years has impacted the prices of the goods that we import. If you look at inflation numbers and trade weighted sterling since the on-set of the financial crisis, one could make a convincing argument that the currency is a volatile, non-core driver. Speaking to Alan Clarke of Scotiabank recently, he stated that there is a 10:1 passthrough from £ into CPI, so this has contributed -2% to CPI over the last 2 years.
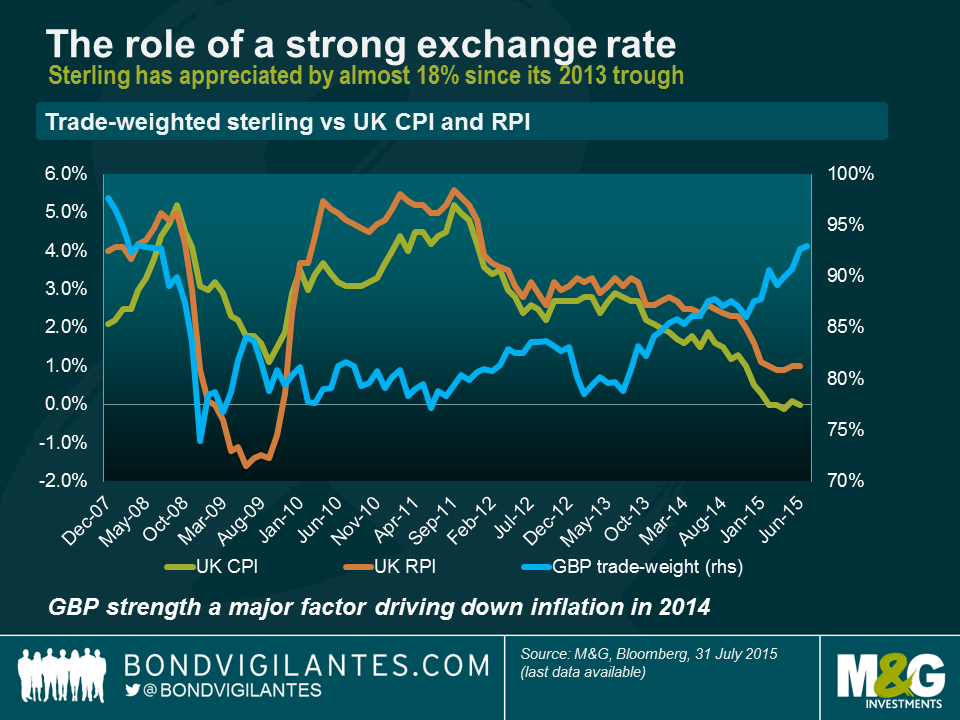
If, like me, you treat the currency with caution, then you could make the case that true core CPI has been meaningfully higher over the last two years. Goods make up c.50% of CPI, so perhaps core CPI today is closer to 2% than the 1% we saw in today’s numbers? If you disagree with the notion that the currency is a volatile non-core item, then perhaps you should ask yourself whether you think the pound is likely to remain as strong as it is today. The UK’s current account deficit is greater today than it was before the IMF bailout in the 1970s and before the exit of the ERM in the early 1990s. That’s worth thinking about, in my mind.
So, inflation numbers are being battered by global energy and commodity prices at the headline level, and by the strength of the pound, particularly in core terms. But perhaps core CPI is not truly stating the underlying, domestically generated inflation picture in the UK. Services inflation is running at 2.3%, and the UK is a services driven economy. The labour market has tightened significantly, and wages are showing solid signs of being on an upward path, albeit from a low base. Ultimately, the medium term outlook for UK inflation is going to be determined by the interplay between the negative and transient forces of food and energy prices on the one hand, against the improving backdrop for UK consumption that will be set by employment and wages. And for those that don’t think sterling is a volatile non-core driver of inflation, the outlook doesn’t look too rosy there anyway.
CPI in the UK today fell into negative territory for the first time, posting a 0.1% decline year-over-year. Airfares presented a meaningful drag on the April figures, owing to the timing of Easter compared to last year. Carriers increase their prices over Easter holidays, so when Easter moves between months this causes flight prices to move around, thereby affecting the headline inflation numbers. However, petrol prices were up slightly on the month which slightly offset some of this effect of flights.
The market expects that deflation will be short lived in the UK. By the end of 2015, on the assumption of oil’s stabilising here or hereabouts, CPI will be 0.8% to 1% higher than today’s numbers, as the negative drag of oil’s decline will fall out of the year over year comparisons.
Also noteworthy is that with RPI in April registering a gain of 0.9% year over year, the ‘wedge’ (the extent of the difference between RPI and CPI) has increased to 1%, which is slightly higher than the long-term average. Whilst most of this difference owes to different calculation methodologies (the formula effect), some of this also owes to RPI’s greater inclusion of housing than CPI. Indeed, following the election result and the early signs of a relief rally in the housing market, one should potentially be watchful for the wedge trending higher in the medium term. This is especially important for investors in UK inflation linked bonds, as RPI is the benchmark. In other words, holders of inflation linked bonds are a safe distance away from a deflationary outcome, and the aforementioned base effects should mean RPI moves higher towards the end of the year.
If anyone is looking for potential reasons to see upside inflation surprises, they should be mindful of real wage growth accelerating from here, as well as consumer confidence. Both of these indicators are suggestive of a benign disinflation in the UK at the moment rather than anything worse, with wages on the rise (and having just increased by 0.1% in real terms today), and with consumers indicating that they are more, not less, inclined to make major purchases at this point.
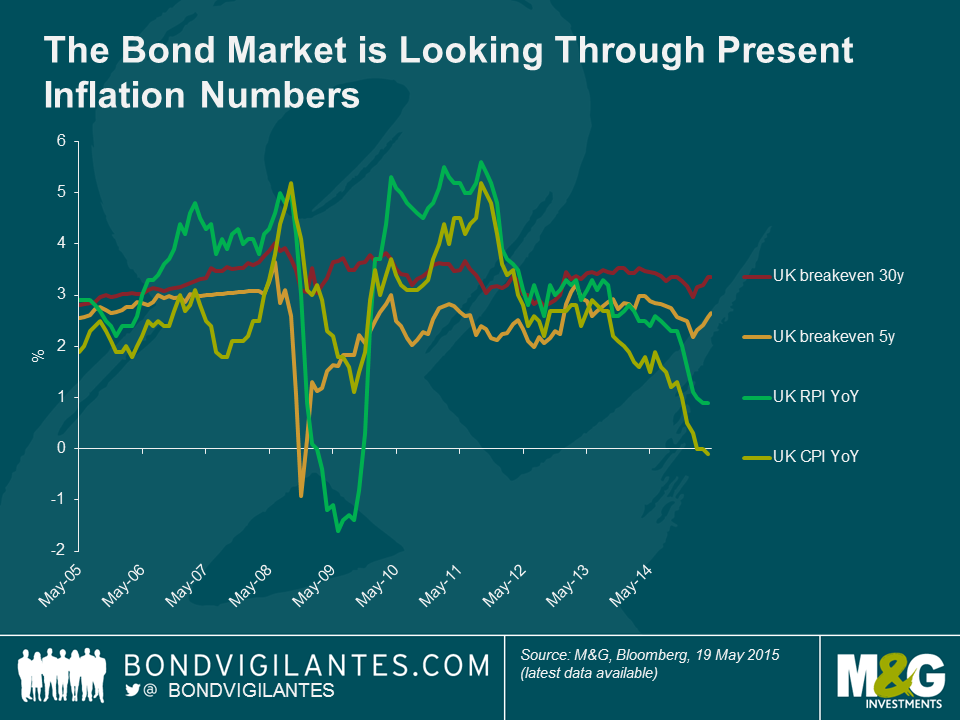
With 5yr breakevens in the UK at 2.65% today, it is very evident that the bond market is looking through the present headline inflation numbers to a more normal environment on average for the next 5 years. Whilst UK breakevens are not as cheap as they were at the turn of 2015, we still feel that the next 5yrs’ inflation outcomes are more likely than not to make an investment in inflation linked bonds a better one than in nominal bonds. Further illustration of the fact that the bond market is less than overly concerned with current low headline inflation numbers can be clearly seen from observing the 30yr, long term, inflation breakeven. At a cost of 3.35% for long term inflation protection, the fixed income market is paying more than the average price of the last 5yrs to protect against long-term inflation, at the very moment that CPI turns negative for the first time.
When in past years I have fielded calls from bankers faintly like Chad ‘Ace’ Jefferson III (A Brave New World: Zero Yield Corporate Bonds) requesting any potential interest in new index-linked corporate bond issues, I have often begun my feedback by pointing to an old maxim. This well-known dogma posits that an index-linked corporate bond should price 25 basis points or so wider than a comparable nominal corporate bond.
So, for instance, were I to have been shown an offer by Ace in the Heathrow 3.334% 2039 index-linked corporate bond at, for example, the beginning of 2012, I would have looked for a comparable Heathrow nominal corporate bond spread, and as a first step checked that we were being paid at least 25bps more for the linker. At this time, the comparison I would have looked at would have been Heathrow’s 5.875% 2041 nominal bond. The spread at this point in time was approximately 255 basis points over the gilt, and Ace was probably showing me the offer at around 270 basis points over for the Heathrow linker. At only a 15 basis point pick up into the linker, the conversation would very likely have ended there with no purchase made.
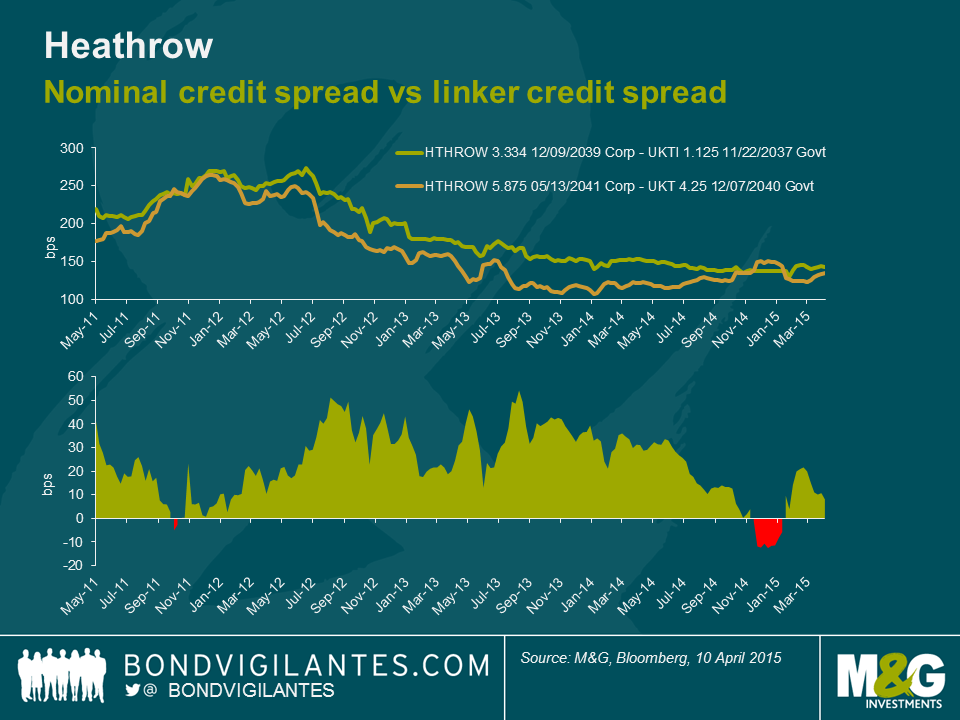
Had I got a subsequent offer in the same Heathrow linker at the end of 2013 though, on comparison of spreads between the same bonds I would have been offered the linker on a spread of 150 basis points, when the nominal 2041 bond was offered at about 110 basis points over the gilt. So I was being offered an additional 40 basis points of spread for owning the Heathrow linker versus the nominal. This time, through applying the mentioned dogmatic valuation framework, I would have been much more likely to buy the index linked bond.
Why might investors seek a higher credit spread for buying the linker over a corporate? First and foremost the additional spread compensates for the relative illiquidity of index-linked corporate bonds compared to nominal corporate bonds. Issue sizes tend to be smaller, owned by a more limited pool of investors, with the majority of corporate bond funds’ major investment types being nominal bonds rather than index-linked ones. It is this liquidity premium that gave rise to the desire to receive 25 basis points more than for nominal bonds when buying index-linked corporates, over the long term. Another important factor that could be cited could be that corporate linkers often carry greater default risk, or in particular loss given default risk (the probability of default of the Heathrow linker is identical to the nominal Heathrow bond). As inflation is accrued in the corporate bond, the price rises or the inflation compensation amount grows. But in a default, the investor’s claim is the same as a nominal corporate bond investor’s – a claim on par. This additional risk needs compensating through additional spread.
So, I am unlikely to buy linkers when I am not being compensated for the relative illiquidity compared to nominal bonds, and I am more likely to buy when the spread over nominal bonds is wider than 25 basis points, such as when the Heathrow linker was paying as much as 50 basis points more than the 2041 nominal. The above chart also shows, if the pricing history is to be believed, that earlier this year the linkers were trading with tighter spreads than the nominal. In episodes like this, we should be more inclined to sell. After all, investors were effectively paying a premium for illiquidity!
However, secondary factors can drive this premium up or down over time, such as inflation expectations and the related headline levels of inflation, and perhaps this explains the relative tightness in the comparison in early 2012 compared to the divergence in spreads in late 2013. After all, in early 2012 RPI was close to 4% and had only a few months earlier been close to 6%. Wind the clocks forward to late 2013 and RPI was back down to 2.7%, and investors were less concerned about the threat of inflation.
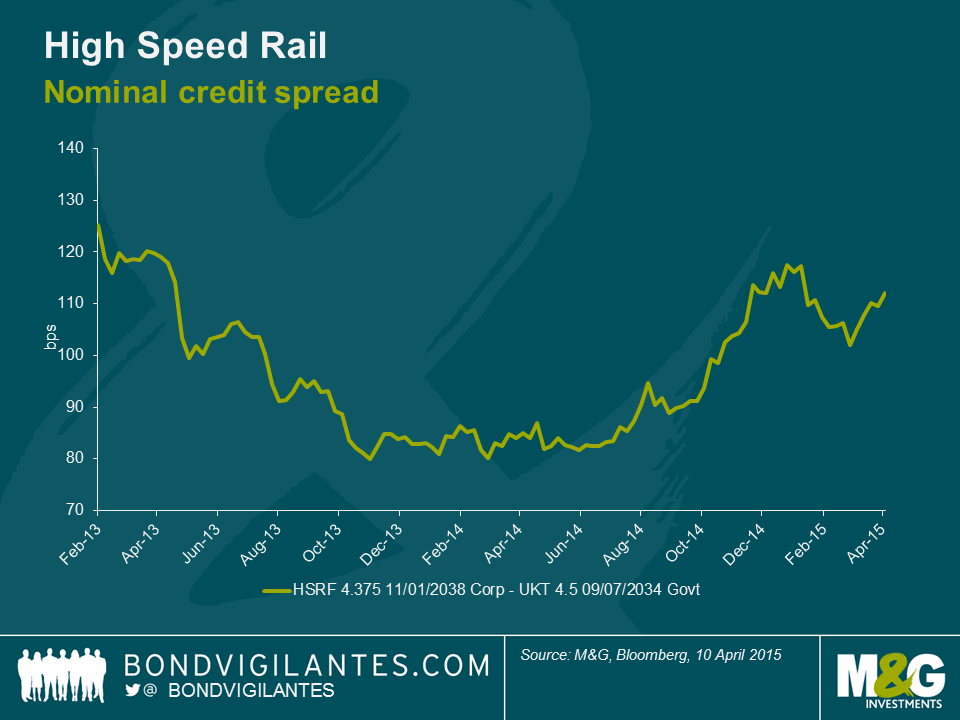
This week, on 14th April 2015, High Speed Rail Finance, which runs the concession on the high speed rail link between St Pancras and The Eurotunnel, brought a tap of its index-linked corporate bond. In February 2013 the entity issued its first corporate and index-linked corporate bonds. Its £610m nominal bond came at 150 basis points over the gilt, and its £150m index-linked bond came at 175 basis points over the index linked gilt. So, the linker was 25 basis points back of its larger nominal comparable: ring any bells? Yesterday’s tap, though, of the linker came at a credit spread of 107 basis points. And as the chart below shows, this is actually pretty much in line with the spread of the larger nominal bond, and so is close to the extreme tights of the linker-nominal relationship.
So what might we learn from all this?
Firstly, as the Heathrow chart showed, the spread pick up from selling nominal corporates into linker corporates has been coming down since the start of 2014. And yesterday’s tap also suggests that investors are eager to add long inflation protection. One could also cite record lows on long dated index-linked gilts as further evidence of strong demand for inflation protection, even at low yields. This could be driven by fears of higher inflation in the future, but it could also be driven by expectations that index-linked bonds will do better than nominal bonds, on a relative basis (or in other words, that UK breakevens are too low).
Secondly, it could also be that investors want to remove the uncertainty of higher inflation in the future: if you buy and hold the 30 year gilt linker until maturity, you will get RPI-1% (so you will receive CPI, near enough); whereas if you buy the 30 year gilt, your yield will worsen (improve) if inflation rises (falls) over the next 30 years.
Finally, it could be that investors have taken notice of significant reflation moves in breakevens in the US and in Europe so far in 2015, and are looking for UK linkers to stop lagging and play catch up. 5 year bund breakevens have rallied 100bps more and 5 year TIP breakevens have rallied 60bps more than UK RPI breakevens in 2015 so far.
One should mention the possibility that the strength of the inflation-linked bond market, across both gilts and corporates, could be being driven by liability driven investing strategies, who are relatively price insensitive. LDI is certainly playing a part in driving the inflation market in the UK. However, this just adds a technical tailwind to the already supportive arguments I have made. In my opinion, breakevens in the UK look relatively good value, and would justify the early evidence of improving demand for inflation protection.
There is a lot of analysis and conjecture about how much impact the financial crisis has had on the global economy and financial markets. There has been considerably less analysis around the impact of the crisis on bond fund managers. In a small attempt to quantify these impacts, we have dug out a few old photos of members of the M&G bond team pre and post-crisis. The photos show clearly where change has been bad.

There is, though, good change. In September there are changes taking place to bank CDS contracts that represent clearly positive progression.
The CDS rules and definitions of 2003 state that there are 3 different credit events that will trigger corporate and financial CDS contracts: 1. failure to pay 2. bankruptcy, and 3. restructuring (this means that a company can’t modify the conditions of debt obligations detrimentally as far as investors are concerned). If any of these are determined to have occurred, then buyers of protection receive par from sellers of protection (and sellers of protection pay out par minus the recovery value of the defaulted bonds, so are in the same situation as if they owned the defaulted bond). In the event of one of these events being triggered, buyers of protection are ‘insured’ against the losses incurred on the bonds.
However, whilst the above works well in most cases of corporate defaults, we have seen several examples in the last few years in terms of banks in which the outcomes have left buyers of protection in effectively defaulted bonds none the better off. For purposes of succinctness and relevance, I would like to mention two of the more recent such cases so as to bring out the flaws of the existing financial CDS contracts, and to highlight the improvements we will soon see.
In early 2013, the Dutch government expropriated the subordinated debt of SNS Bank, which had got into serious difficulties. Bondholders would therefore no longer receive coupons or principal, and so the determinations committee ruled, quite simply, that a restructuring event had occurred. However, the buyers of protection had to deliver defaulted bonds to the sellers, and there being no subordinated bonds left, had to deliver senior bonds, whose value was around 85p in the pound. This meant that they ‘owned’ bonds worth zero, and were being paid out 15p as a result of the protection they had bought!
The most recent example of subordinated CDS not working is still on-going, being the case of Banco Espirito Santo. This bank has seen all the good assets, deposits and senior debt transferred to a new, good, bank, and all the bad assets, subordinated debt and equity stay with the old, bad, bank. So subordinated debt will very likely get a very low recovery (the sub bonds are today trading at around 15 cents). Subordinated bank debt is now, in practical terms, able to take losses and be written down in European banks. Senior bank debt will also become write-down-able at the start of 2016, but as yet legislators and regulators are showing the continued desire to make senior good. In BES’ case, though, with all the deposits and senior debt moving to the good bank (and with a very thin layer of subordinated debt), more than 75% of the liabilities will go to the new entity. In CDS terms, this means that the contracts move to the new entity. So, again, buyers of subordinated protection in BES are left with significant losses on their bonds, but will have to deliver senior bonds which are trading close to and in some cases above par. Not the outcome that the owners of protection wanted or expected. And, frankly, not the right outcome.
So the existing rules around financial CDS are unfit for purpose. Starting in September, new rules will come into place that will vastly improve the economics of these contracts, and in simple terms will make them behave far more like senior and subordinated bonds, which after all is what they are meant to do. The major differences can be summarised into two: a new, fourth, credit event trigger called Government Intervention will be added; and the removal of the cross default provision. The Government Intervention trigger will mean that in instances such as SNS, when governmental authorities impair debt, CDS contracts will be triggered, and in the same case, owners of subordinated protection would have delivered a claim on the Dutch government that was worth zero, through the expropriation, and would have received par from sellers of protection. In terms of the second major reform to financial CDS contracts, current contracts mean that a credit event on subordinated CDS also results in a credit event on senior. This clause will be removed, meaning that in the Banco Espirito Santo on-going case, subordinated CDS contracts would travel with the subordinated bonds, and senior with senior. Unlike the changing faces of the Bond Vigilantes, the changes soon coming in CDS are ones we think are positive.
The ECB has already demonstrated an unusually, and perhaps worryingly, high tolerance of low inflation readings, with no additional action having been taken despite Eurozone HICP at 0.5% year-on-year as inflation continues to fall in many countries.
Why might this be? One reason might be that while it is very concerned about deflation, at this point in time the ECB does not have a clear idea of what the right tool is to relieve disinflationary pressure, or how to implement it. Another reason might be that it is not particularly concerned about the threat of disinflation and so is happy to wait for the numbers to rise.
With regards to the latter of these possibilities, Mario Draghi discussed the low inflation numbers in January in Davos as being part of a relative price adjustment between European economies, and as being an improvement in competitiveness. One implication from this argument has to be that the lowest inflation numbers are being seen only in the periphery, and that as a result the much needed price adjustment between periphery and core is starting to take place. The other implication from this argument is that the ECB is happy to let this adjustment happen.
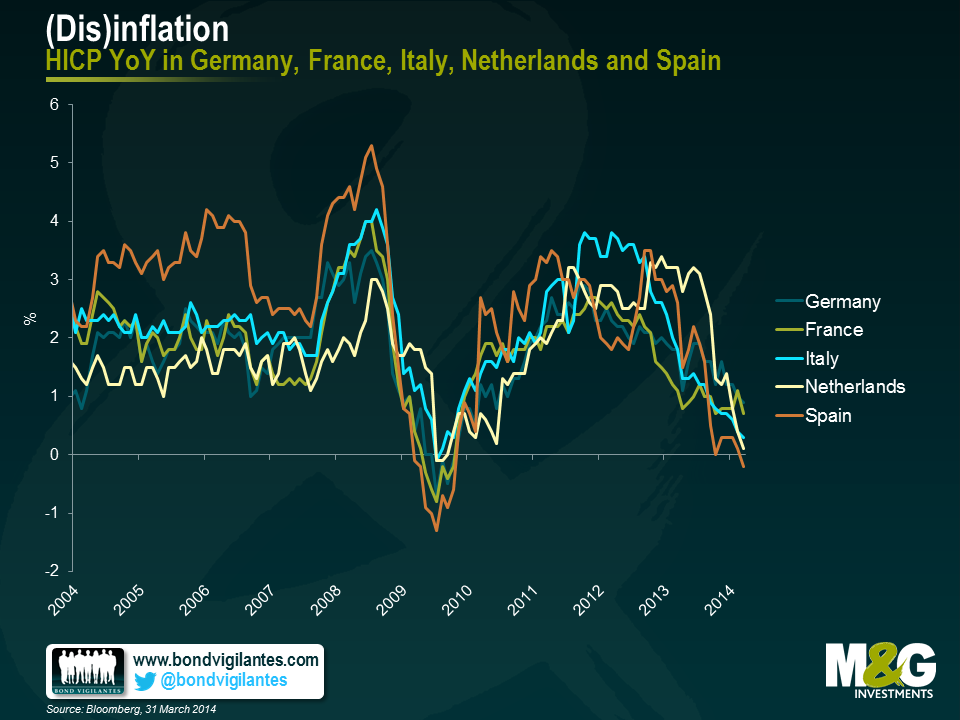
The chart below, however, shows inflation in Germany, France, the Netherlands, Spain and Italy (which together make up around 80% of Eurozone GDP) in terms of constant tax rates on a headline basis. This is important because fiscal reforms can have significant impacts on inflation numbers, when perhaps these should be stripped out as being temporary and artificial. The most obvious example of this would be a country implementing a hike in VAT, in which case inflation will jump upwards for a period until the base effect is removed some time later. This chart, alarmingly, shows that Spain, Italy and the Netherlands are now all experiencing deflation on a constant tax basis. It also shows that France is close to the precipice, with inflation on this basis at 0.2% year on year.
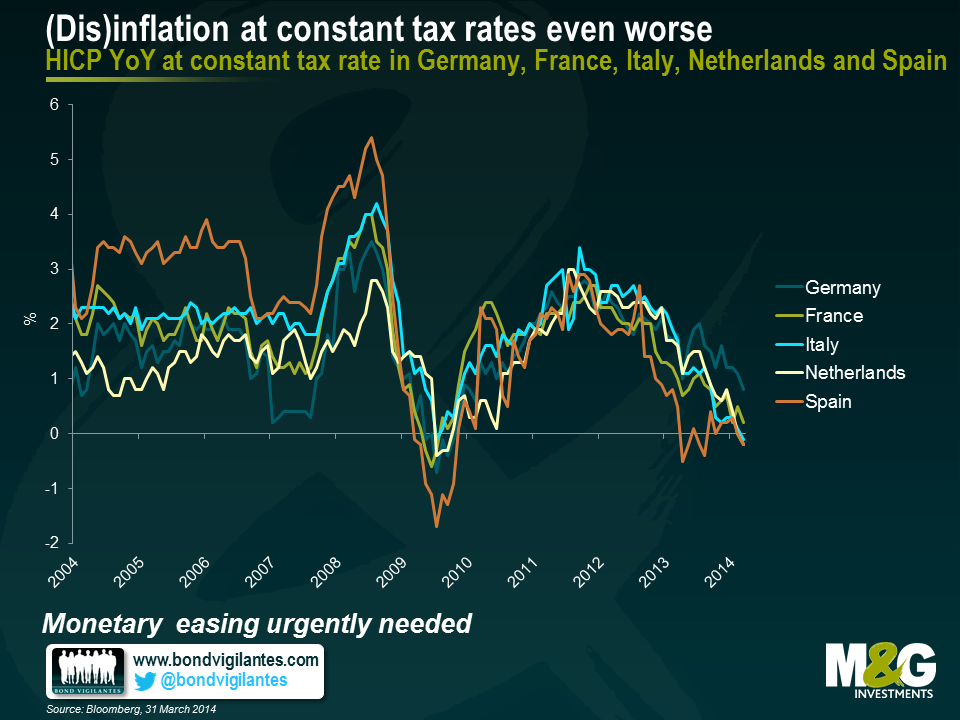
A further concern from the above two charts ties in to the ECB’s argument that the low inflation numbers in the periphery are a temporary phenomenon on a path to important and desirable internal adjustments to competitiveness. This argument might hold if the periphery is seeing low inflation, while the core is seeing stable, on-target or slightly above-target inflation that brings Eurozone inflation as a whole, to close to but below 2%. However, both the above charts show that the trend of disinflation is affecting more than just the periphery in isolation, and this calls Draghi’s competitiveness argument into serious question. The ECB might be well advised to get ahead of this worrying trend and act soon.


Sign up to the Bond Vigilantes mailing list to ensure you never miss a great article from our expert Bloggers. We will email all new articles to your inbox, meaning you can stay on top of the world of Bonds.
I confirm that I would like to receive information about Bond Vigilantes and products and services from M&G Securities Limited.
We will use the email address and personal data you have shared with us to send you this information. For existing customers, submitting your contact details and requesting to receive this information from us, will replace any earlier choices you have made in respect of marketing information.
You can unsubscribe from marketing at any time, at which point we will not send any further marketing information to you, by selecting the unsubscribe link in all communications.