high yield
Canary in the Credit Market: Are Euro Single-Bs Singing?
By David Fancourt
12 May 2026

Since Keith So joined us earlier this year as a quantitative analyst, I’ve been throwing all manner of questions at him and his python notebooks. The most recent was; “Is there an optimum place to invest on the yield curve to maximise the benefits of rolldown?”
Rolldown is the capital gain an investor captures as a bond’s maturity shortens and it moves to a lower-yielding point on the yield curve. Clearly this assumes an upwardly sloping yield curve, and the steeper the curve, the more rolldown one captures.
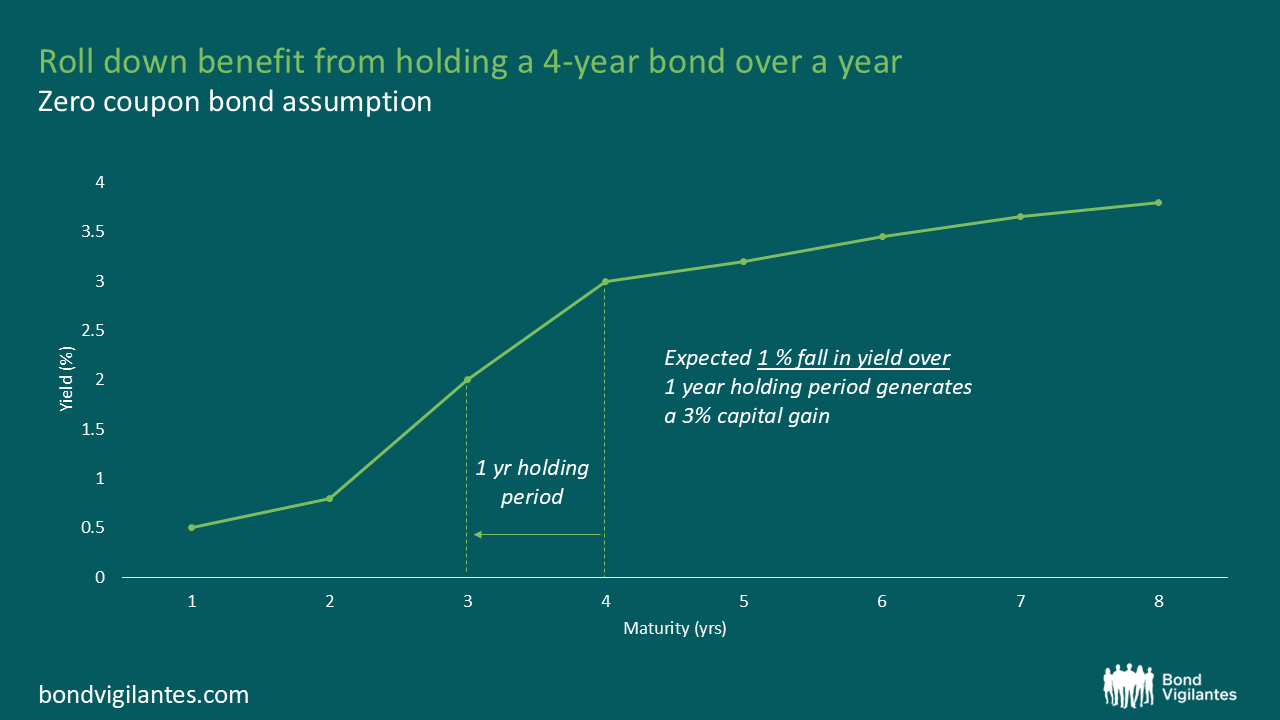
Graphic used for illustrative purposes only and it is not based on a particular security
To investigate this Keith pulled in over 20 years of government bond data, sliced it into maturity buckets, and analysed which buckets produced the greatest returns from rolldown over those 20 years.
The best performing bucket in Gilts and Treasuries was the 3-4yr, while in Bunds the 4-5yr bucket performed best. Whilst these short end buckets may have benefited from the greatest rolldown, in a secular falling yield environment, they (unsurprisingly) delivered lower total returns than the broader index and their longer-dated peers, due to being shorter duration. So far so unsurprising, but when we looked at the risk adjusted returns, things start to look more interesting. As you can see in the table summarising the results, once the volatility of returns is considered, the short-dated buckets show their value to an investor. The historic Sharpe Ratios (the return per unit of volatility) of the lower duration buckets is meaningfully higher than the competition.
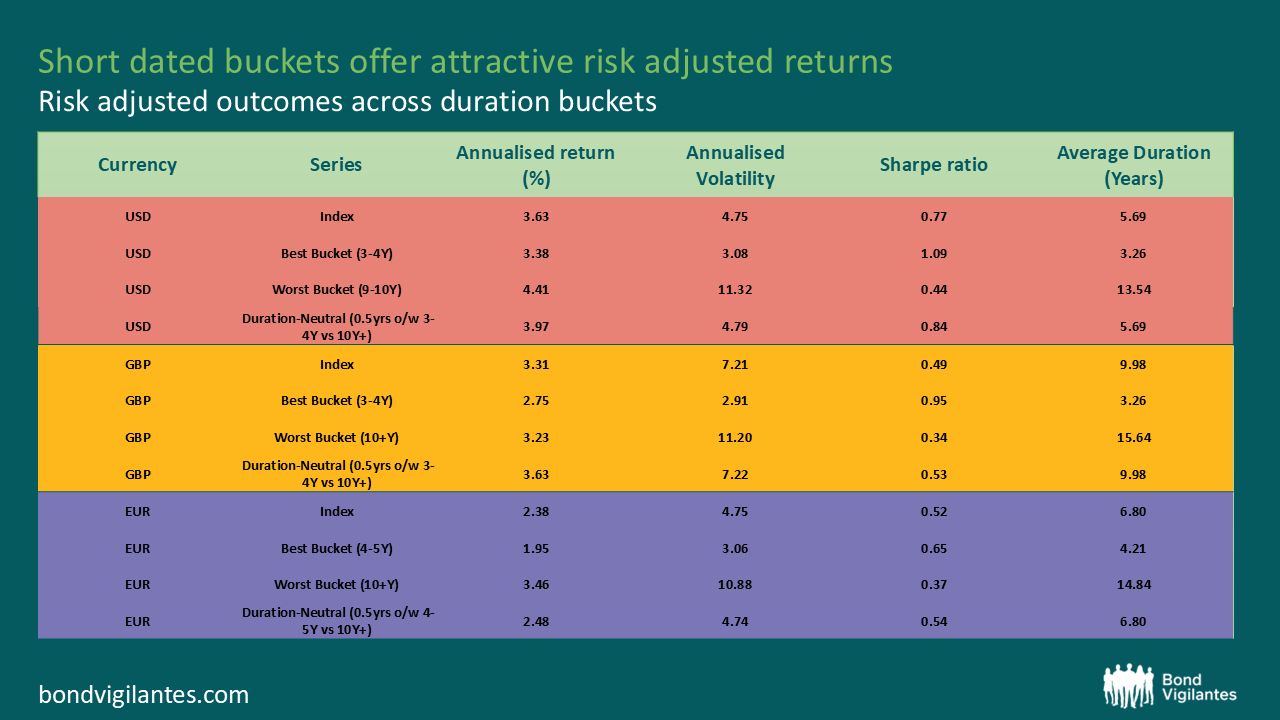
Source: Bloomberg, March 2026
So how can we, as bond investors, exploit these results?
Most obviously (especially coming from a short-dated corporate bond fund manager), we can buy more front end bonds to improve the risk-return characteristics of our portfolio. However, this would reduce the duration of our wider portfolio and leave us at risk of underperforming if yields were to fall over the next 20 years too.
What if we overweight the short-dated bucket and underweight the longer bucket, whilst maintaining a neutral duration across the portfolio? Well, that more or less matches (if not beats) the performance of the overall index and reduces the volatility meaningfully.
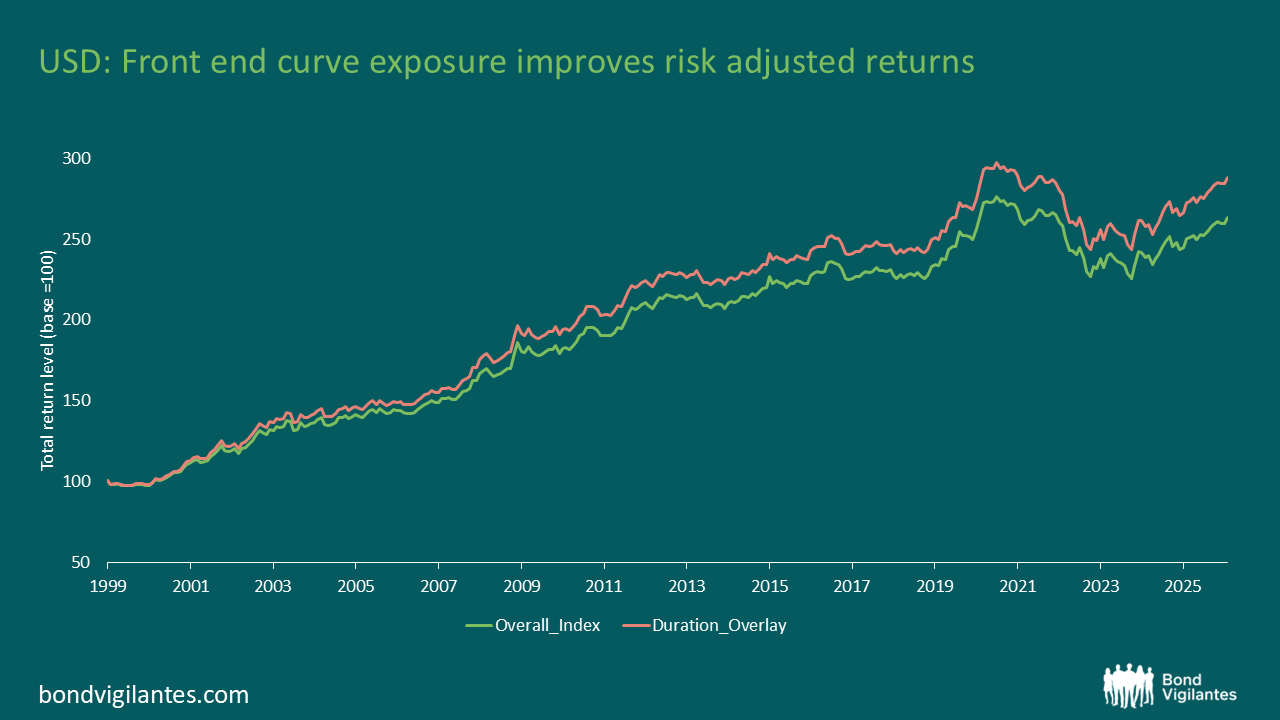
Source: M&G, Bloomberg, March 2026
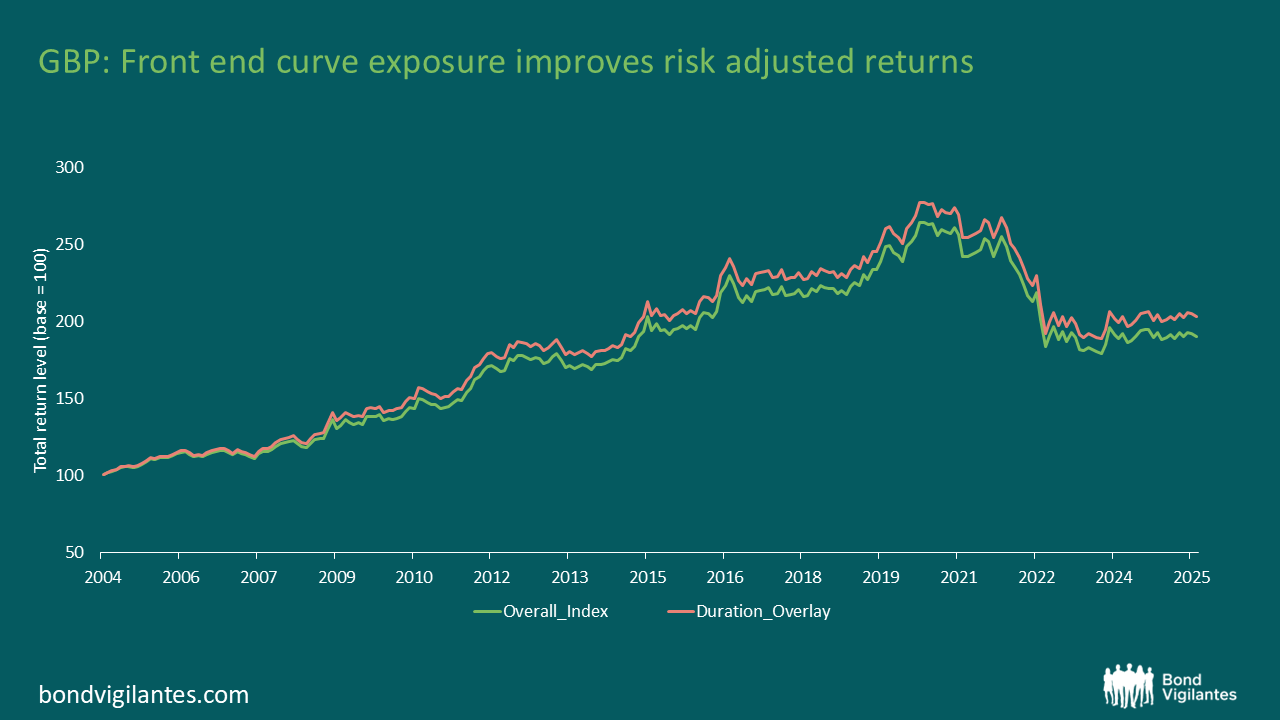
Source: M&G, Bloomberg, March 2026
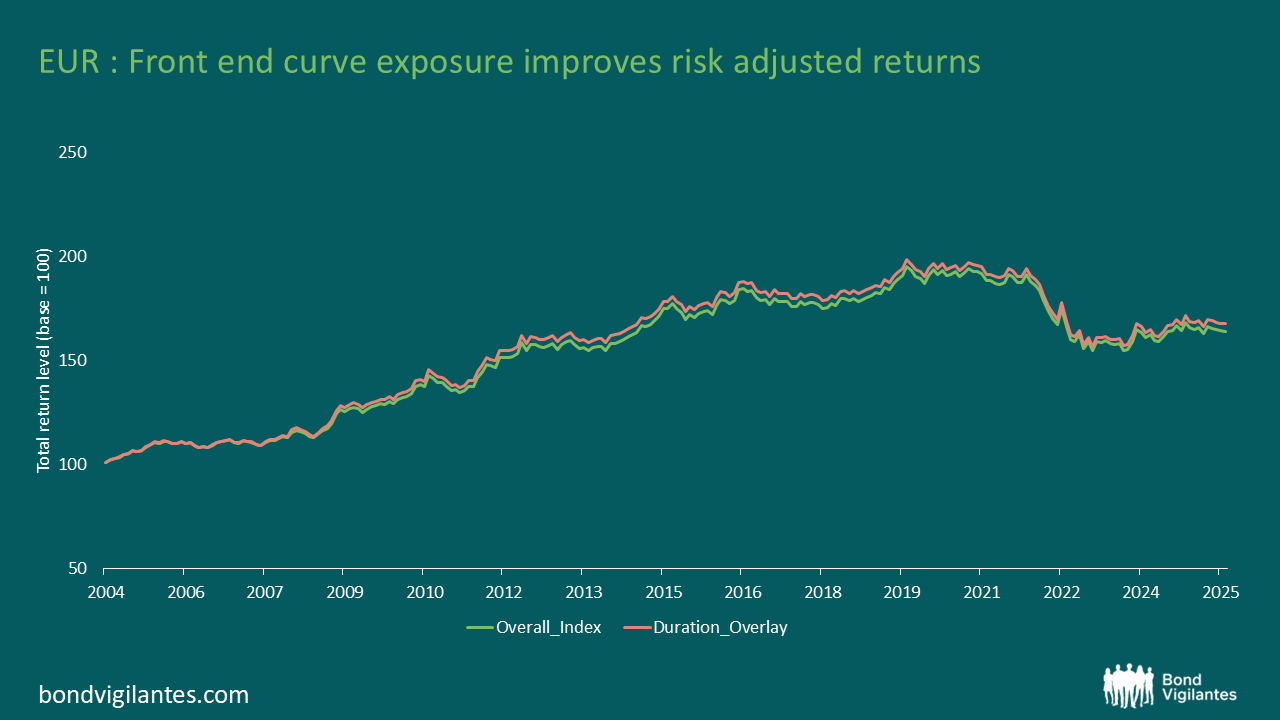
Source: M&G, Bloomberg, March 2026
The strength of outperformance clearly varies across £, € and $s, but in all cases having an overweight to the front end/steepest part of the yield curve generates better risk adjusted returns. Rolldown can contribute meaningfully to a bond investors performance, and harvesting this can assist in beating passive exposure to fixed income markets.
One of the well-known effects of inflation, albeit seemingly rarely discussed in recent times, is its ability to erode the value of debt. The (fixed or nominal) amount of money one has borrowed begins to shrink in comparison to one’s income as prices, wages, and earnings rise. A rising nominal income increases a borrower’s ability to pay.
The same is true of governments. All else being equal, higher prices, wages and earnings all result in higher tax receipts, and therefore should improve their fiscal position. However, all else isn’t equal. For reasons we know all too well, over the last few years government borrowing in Europe has been on the rise too.
So, the interesting question is where has that combination of higher borrowing and elevated inflation left government finances? I found some of the answers surprising.
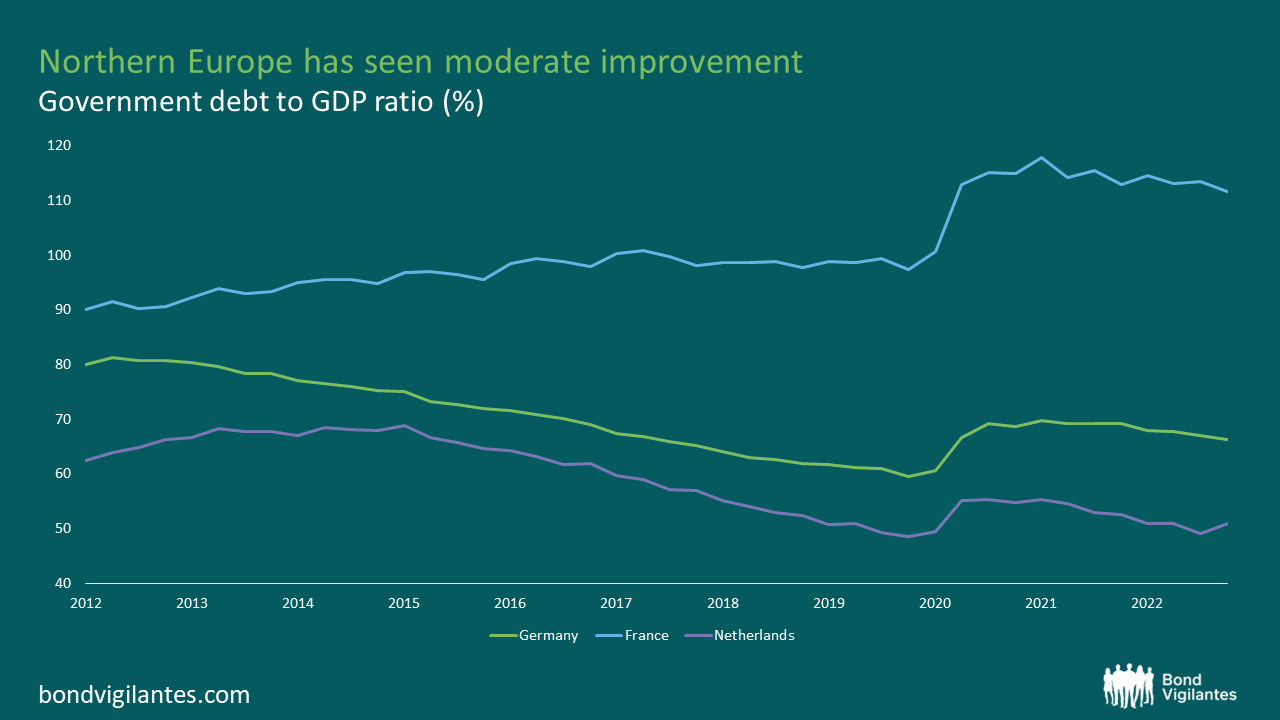
Let’s start with Northern Europe. Since the peak of debt/GDP in early 2021, the average improvement in this measure for Germany, France and The Netherlands has been 4.67%.
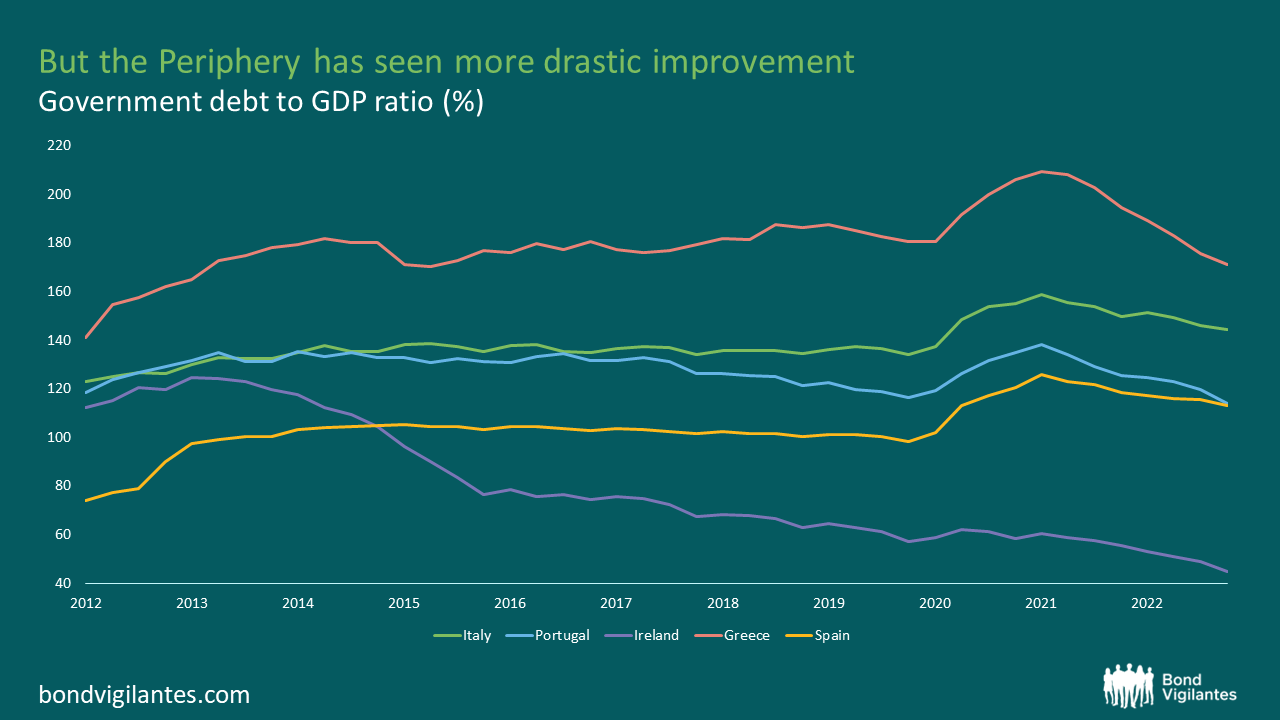
In the periphery, the average improvement has been a much more impressive 21.36%. A special mention to Greece, whose debt/GDP ratio has fallen by nearly 40% over the same period.
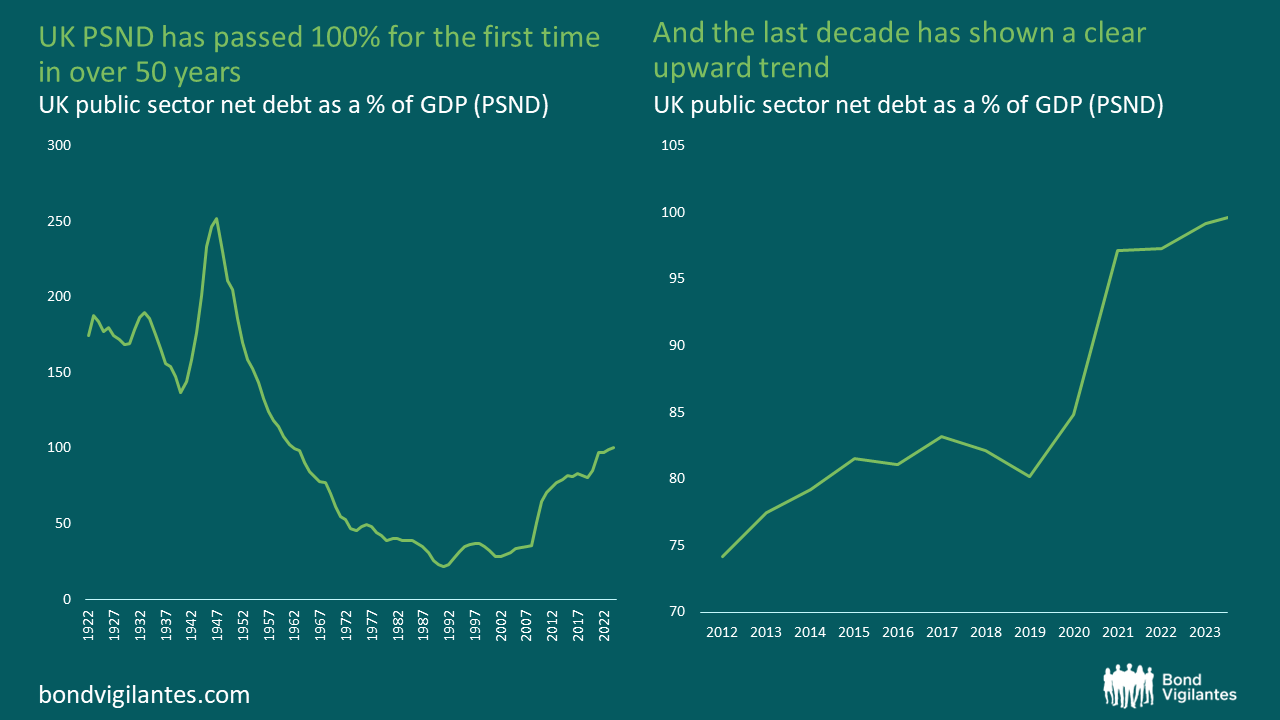
Sadly for our UK readers, there has been no improvement here. The situation has, in fact, worsened. The ONS recently announced that the debt/GDP ratio has (just) gone through 100% for the first time since the early 1960s. This despite the persistently higher levels of inflation we’ve been experiencing here compared to the rest of Europe.
Taking the analysis a step further, what are the implications for asset prices?
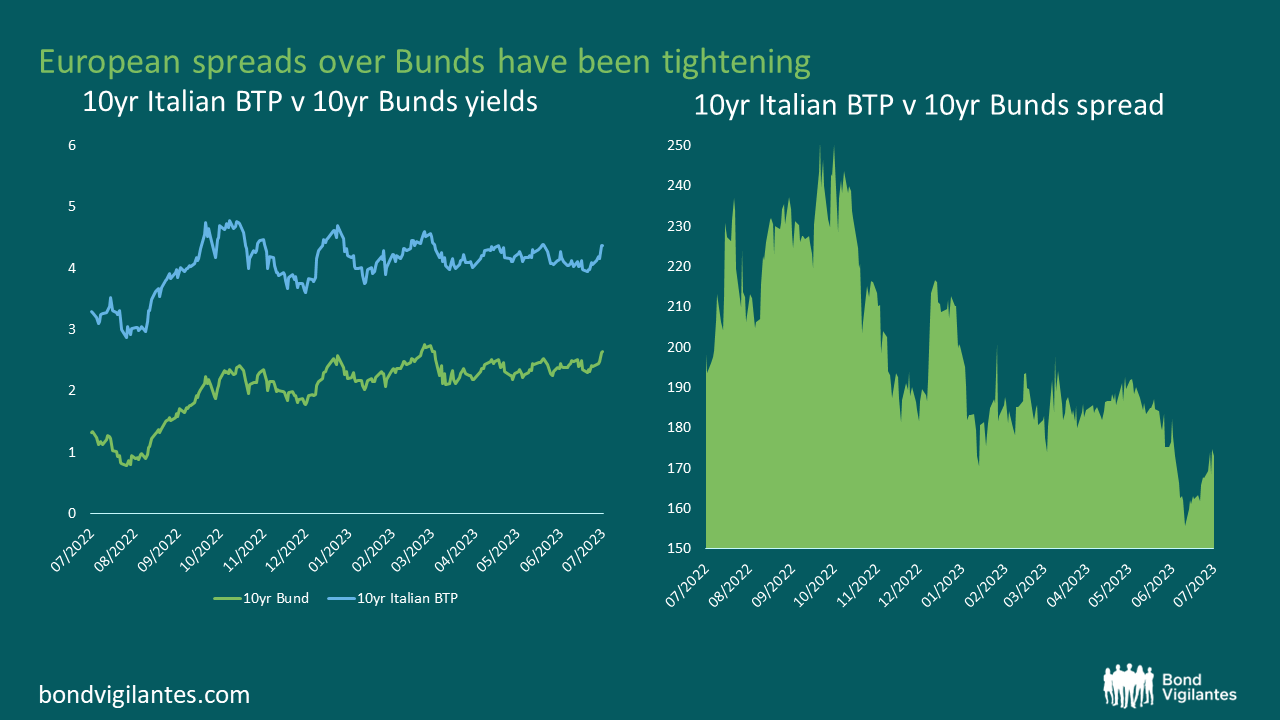
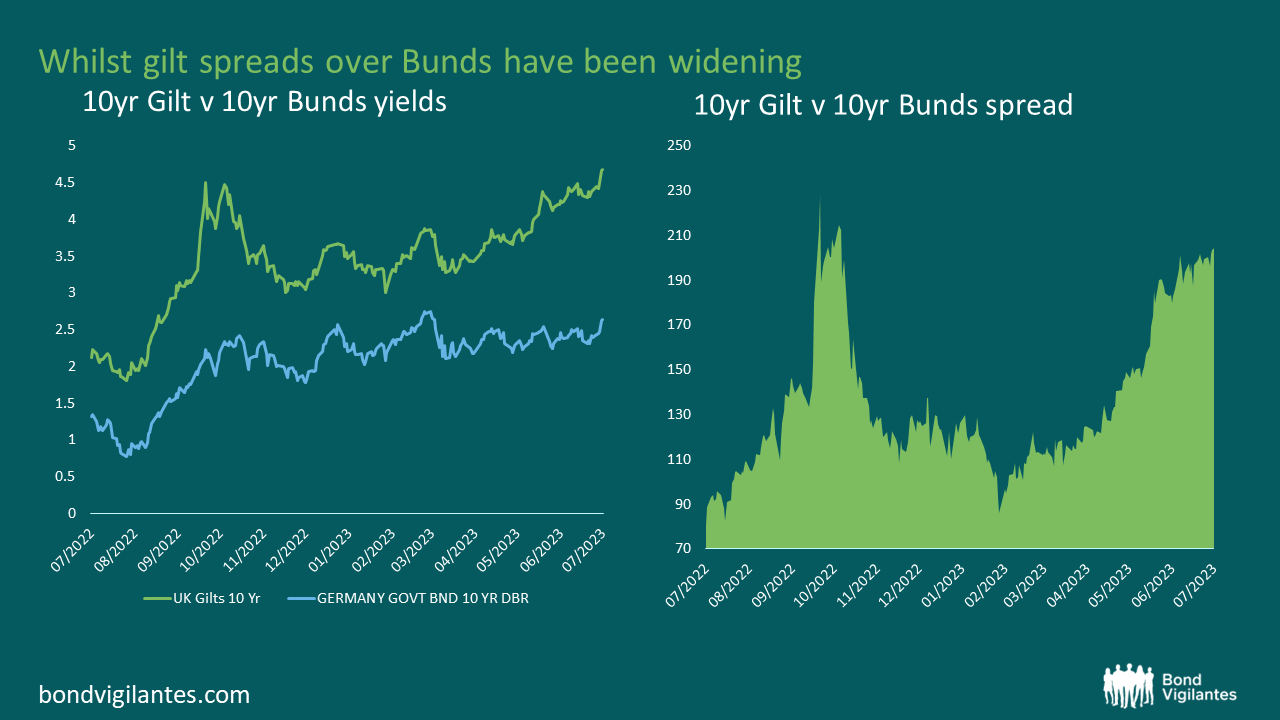
Well, if these trends continue (and we’ll hopefully be getting some new EU data soon) you’d have to expect the faster improving government finances in the periphery vs the core to result in spreads over Bunds to continue their recent tightening. Here’s Italy’s 10yr BTP vs 10yr Bunds as an example:
If the UK’s situation doesn’t improve, we’ll likely keep seeing our borrowing costs widen further vs Germany’s.
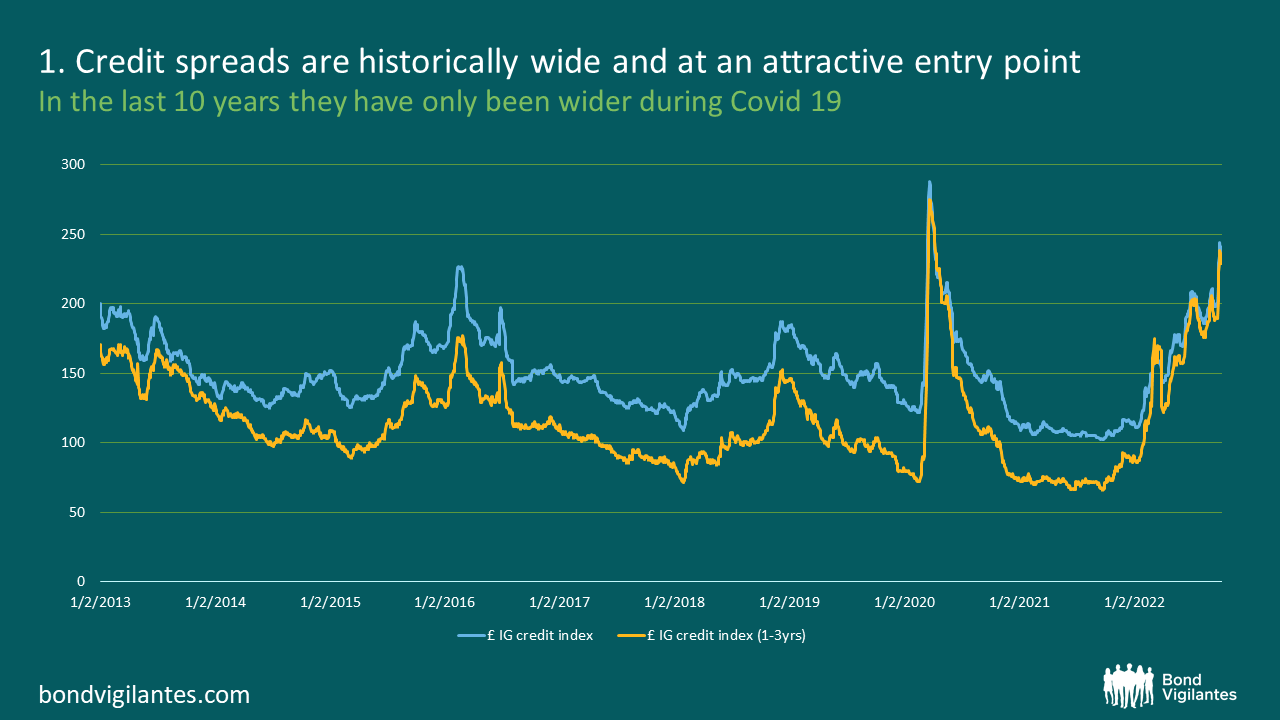
Source: M&G Bloomberg 11 October 2022 BofA UR00 and UR01 Sterling Investment Grade credit indices
2. All in yields are more attractive than they’ve been for a very long time
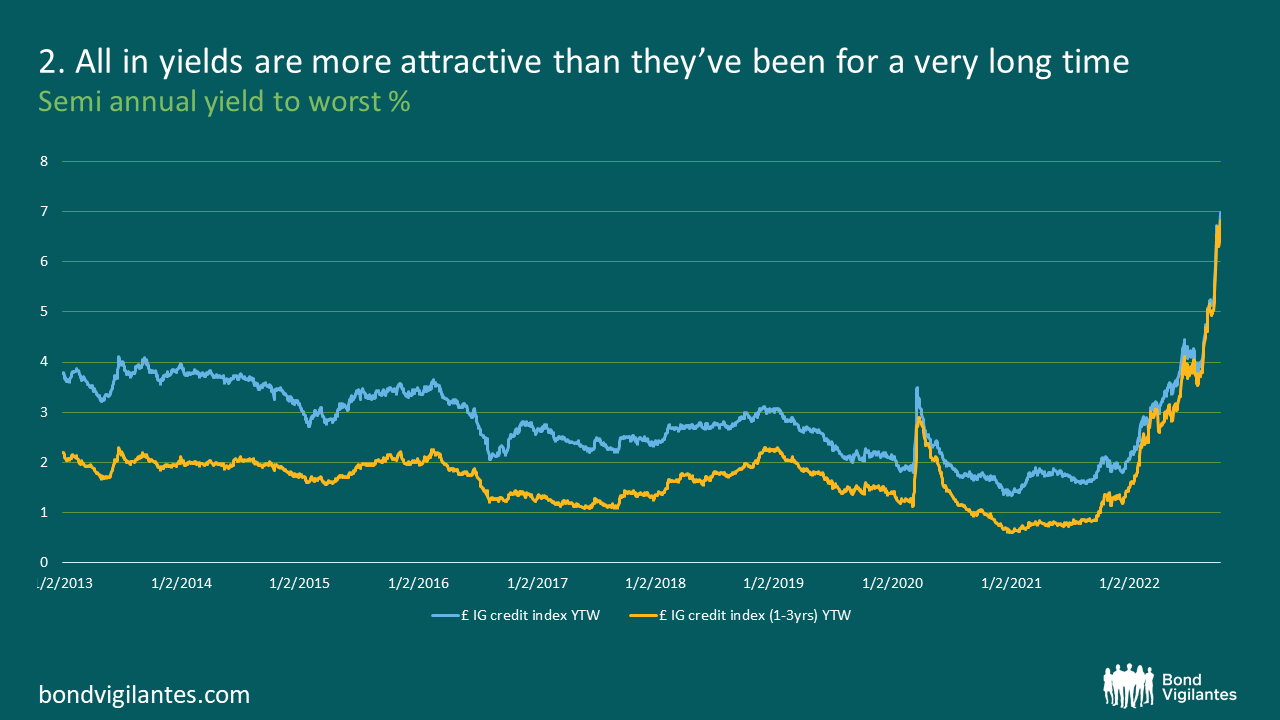
Source: M&G Bloomberg 11 October 2022 BofA UR00 and UR01 Sterling Investment Grade credit indices
3. Yields versus spreads. As the above charts show there is little difference – in yields or spreads – between the corporate bond index and the shorter dated (1-3yr) index. So if you think that yields are likely to rise further, you’re better off buying the shorter dated universe. However…
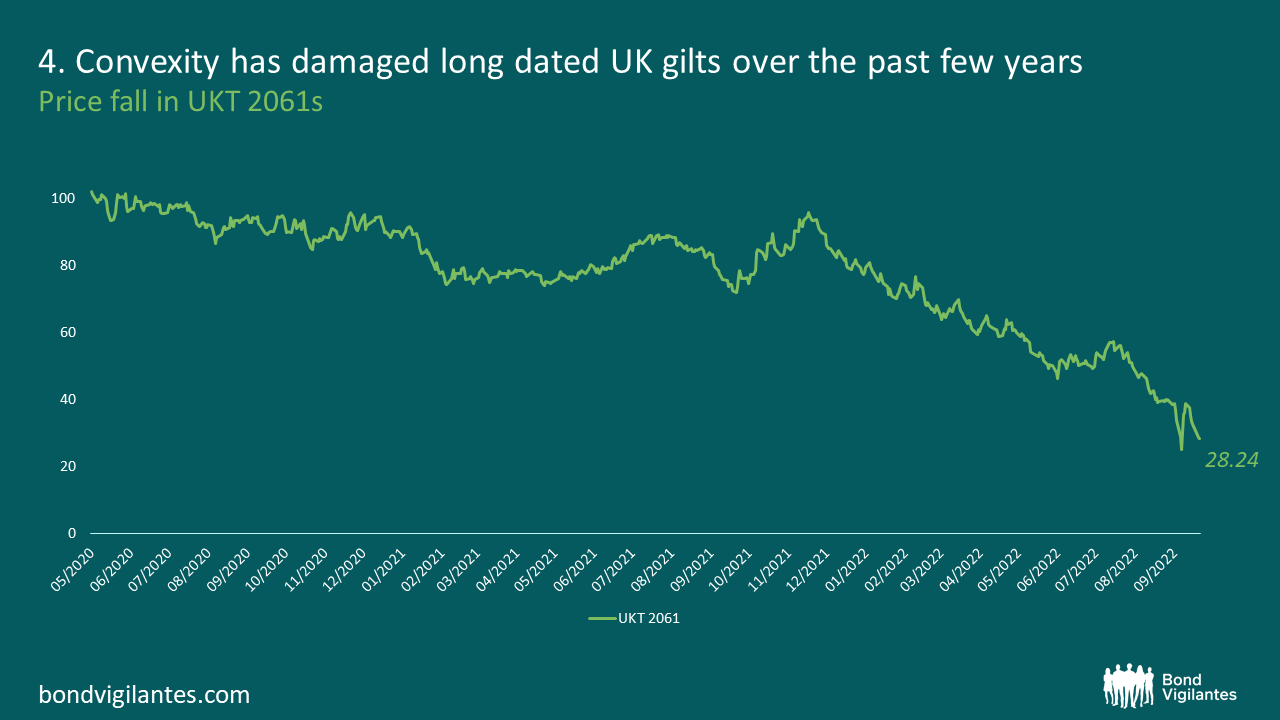
4. Longer dated credit is also looking much better value, if you think yields are likely to fall. Bear with me here. Their greater convexity – the degree to which a bond’s sensitivity to yield changes, given a change in yield – makes a compelling investment case. For the mathematically minded amongst you, convexity is the second derivation of duration (a bond price’s sensitivity to a change in yields).
As you can see the duration of the corporate bond index has fallen by over 2 years since the beginning of the year.
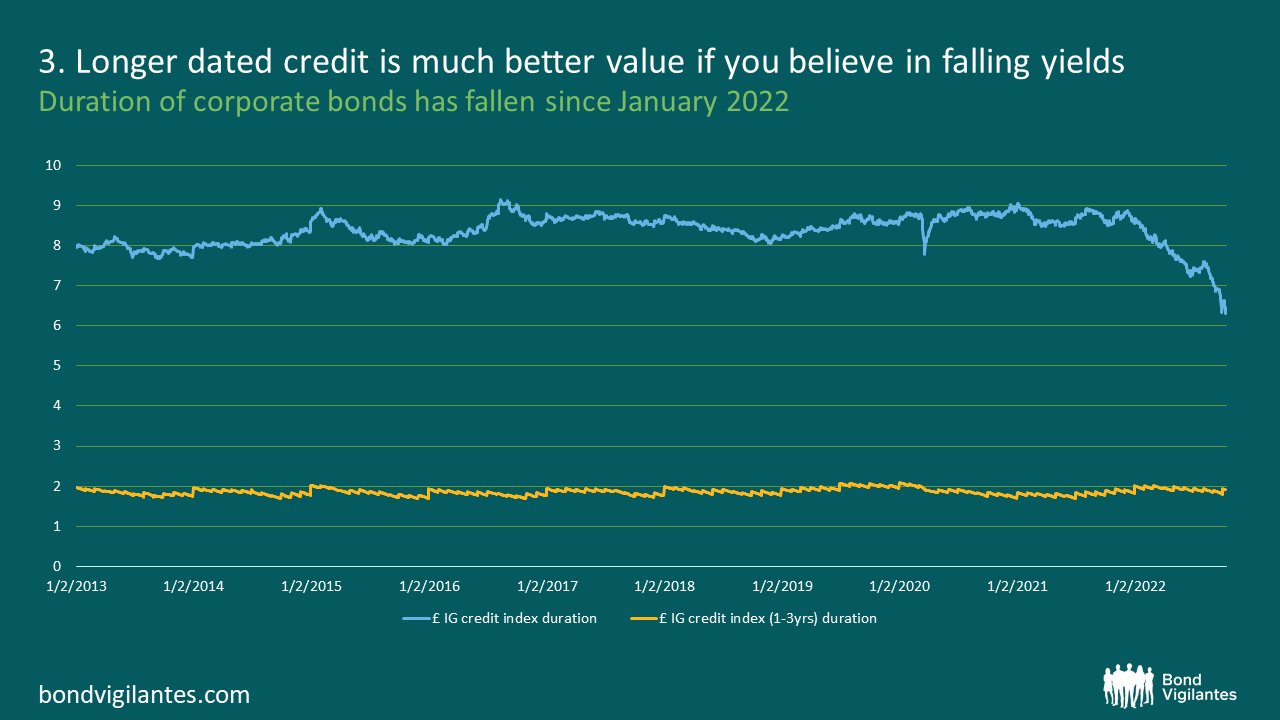
Source: M&G Bloomberg 11 October 2022 BofA UR00 and UR01 Sterling Investment Grade credit indicies
This isn’t because the universe of bonds has suddenly become shorter dated. It’s because the moves in yield have been so pronounced, that the same bonds now have less sensitivity to further increases in yields, than they did nine months ago. I’ve included the short dated index for comparison – as you can see short dated bonds have very little convexity.
In other words, the return profile is not symmetrical. If yields go higher, yes you will still get hurt, but not by as much as you would have previously. If yields fall, you will end up gaining more in capital value than you previously would have too. So, if you believe yields are likely to fall from here, convexity is very much your friend.
This dynamic is (unsurprisingly) also at play in the longer dated world of gilts. Last December 40 year UK government debt was trading just below a 96 cash price. Now you can pick those bonds up for a price in the 20’s. Again, not a bad relative value trade for the long term investor.
Source: M&G Bloomberg 11 October 2022
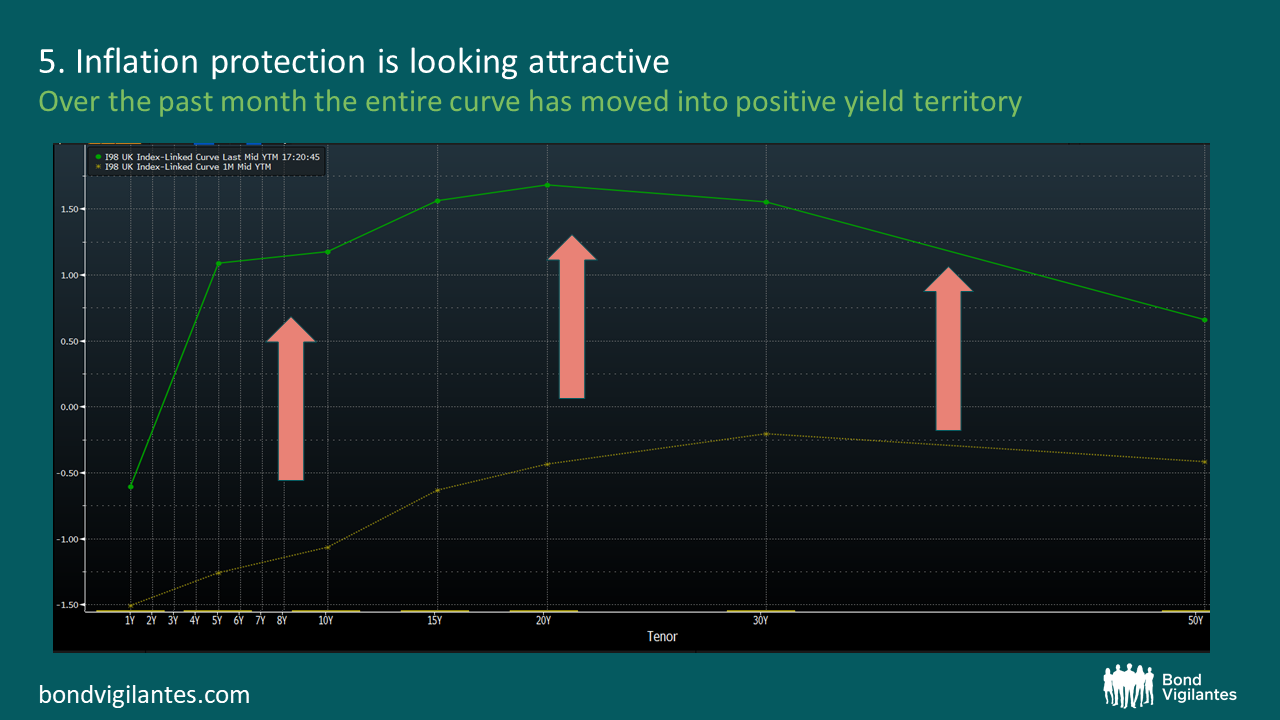
5. Inflation protection is looking attractive (or sensible) again. The last month has pretty much seen the whole UK linker curve move from negative yields into positive territory. This means that for practically any period of your choosing, you can now receive a guaranteed return above inflation, instead of paying for the benefit of owning that protection. Again, given the current economic climate, this feels like an interesting trade for the long term investor.
Source: M&G Bloomberg 11 October 2022
So regardless of your maturity/duration preference, or whether you are a gilt, credit or inflation investor, the UK Fixed income market is looking like a much more exciting asset class, than it previously has done.
The short end of the investment grade credit universe is generally a rather dull place. Lending to good quality companies for a relatively short amount of time rarely provides much excitement. From time to time, however, the benefits of the asset class shine through. Now is one of those moments.
Most investors view bonds as the low risk portion of their overall portfolio but, as many have found this year, not all bonds are created equal. Higher government bond yields, over which corporate credit is priced, have resulted in some heavy losses for bond investors so far this year. As a general rule of thumb the longer a bond has until it matures, the more capital value it will lose if interest rates rise (and the more it will gain if they fall). In the UK, the investment grade corporate bond index is down by about 15% YTD. The comparable short dated index (bonds with 1-3 years until maturity) has lost about 5%. Not ideal, but there are few assets out there that would have done a better job at limiting the losses that higher yields have brought to financial markets this year.
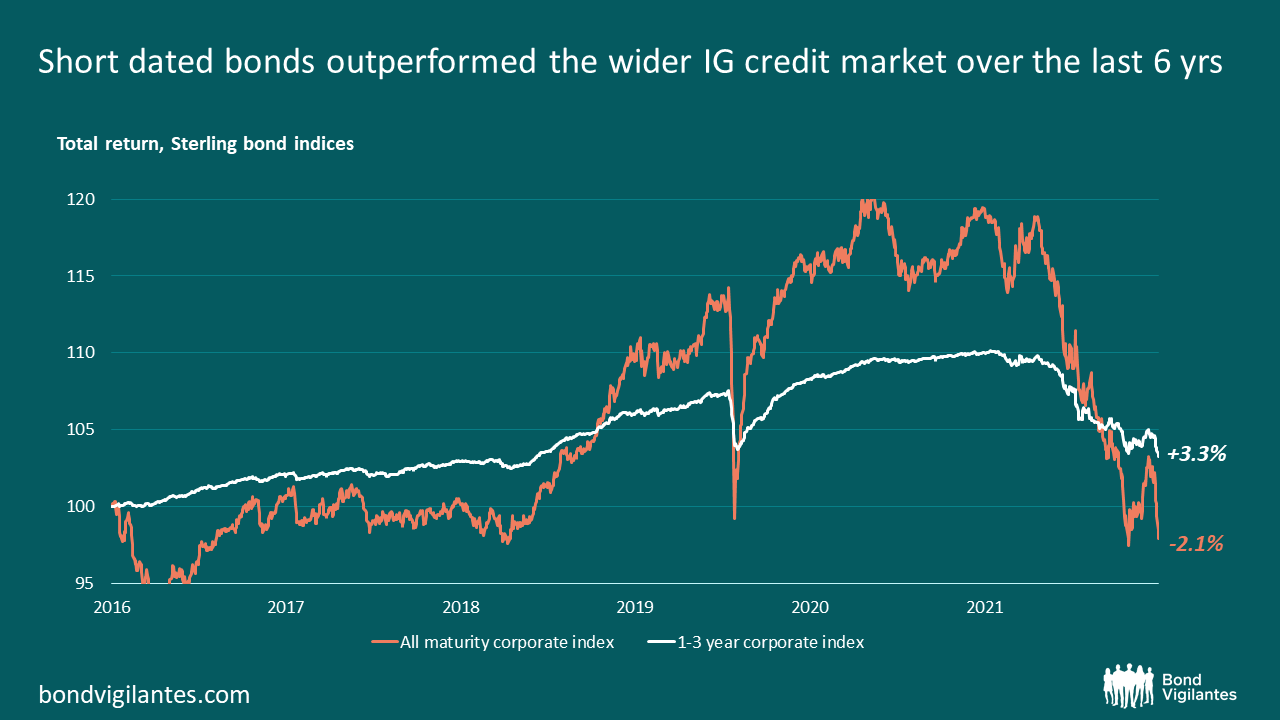
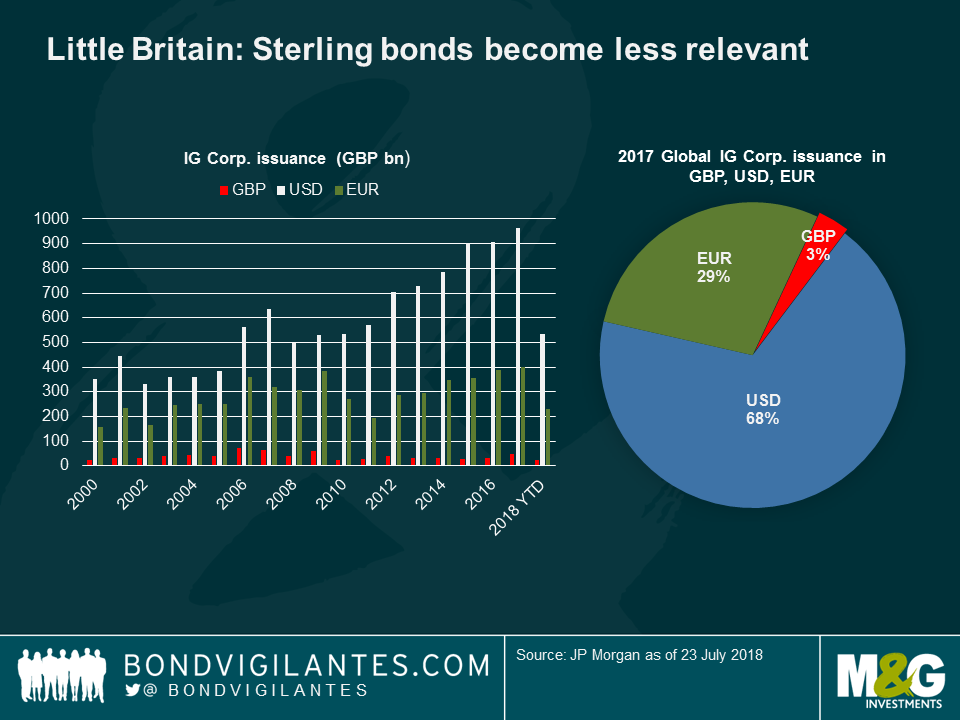
And no, this isn’t just a UK phenomenon. The same dynamics are at work in both the Euro and Dollar credit markets too. In fact, the global move higher in yields has been so brutal that lower risk, short dated bonds have outperformed the wider Investment Grade credit market over the last six years.
Below is a chart showing exactly that in the Sterling market. Again, this is true in Euros and Dollars (just), as is the lower volatility of short dated credit over the period – as one would expect from a lower risk asset class.
Higher returns with lower risk? What’s not to like? Well traditionally the argument would be that longer dated credit pays you a higher yield to compensate you for that extra risk. However, yield curves have not only moved higher – they have flattened and (in the UK & US) inverted too. This means that governments and firms are paying more to borrow over the next couple of years than they are over the next, say, 10 or 30. As the chart below shows, today the yield you receive from the longer duration UK Investment Grade corporate bond index is only 10bps more than you get from the equivalent 1-3 year index.
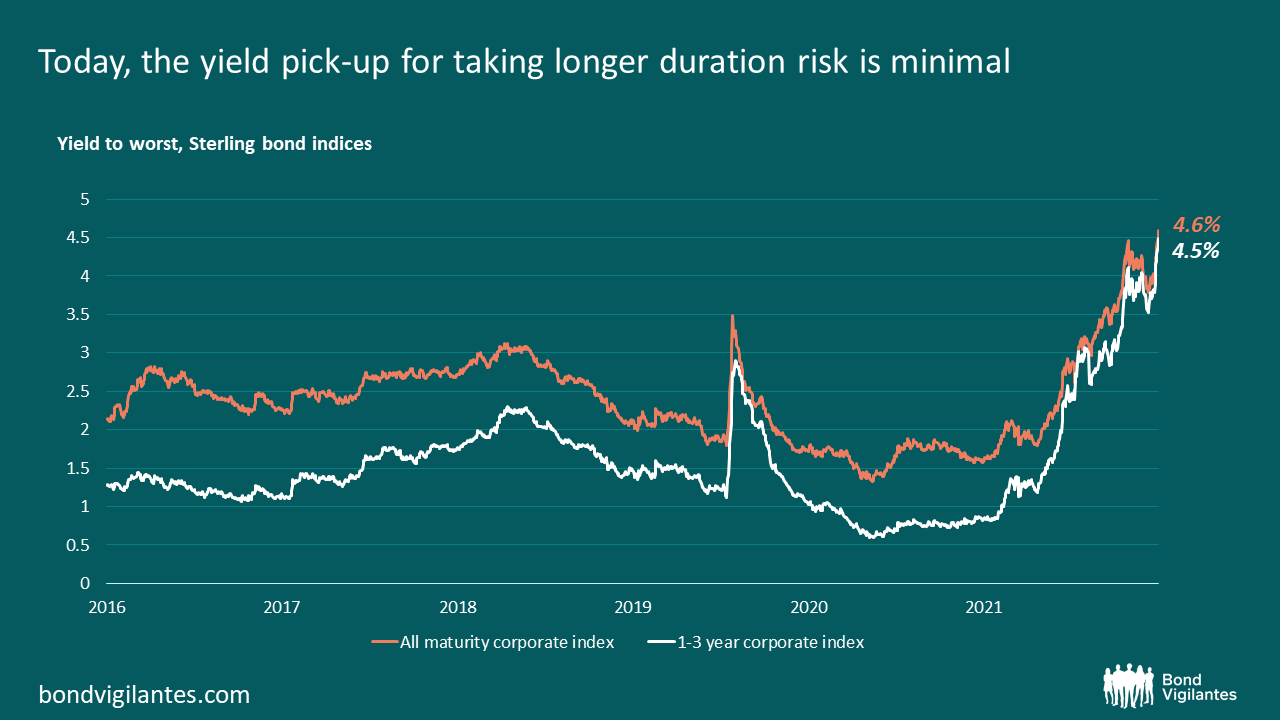
Foregoing that extra 10bps for a lower risk, lower volatility portfolio, that outperforms in a rising rate environment seems, to me, like a very good relative value trade.
See, I told you short dated credit wasn’t always boring!
Following a quiet 2020, the UK residential mortgage backed securities (RMBS) primary market sprung to life in the first month of 2021. This brings some focus to an area of the bond market that I think looks cheap – not something you hear said about bonds every day. We even saw the first ESG UK RMBS issued (Gemgarto) just last week.
The exceptionally low interest rates offered by the Bank of England to the high street lenders explains the absence of issuance from those institutions last year. That has been the case so far this year too. All the deals we have seen have been in the non-conforming (NC) or buy-to-let (BTL) sectors, where originators don’t have access to the Bank of England facilities.
As one might deduce, NC and BTL mortgages are a riskier proposition than investing in prime mortgages (loans written by the high street banks). But how much riskier, and are we being paid for that additional risk? Currently I think we are.
When we analyse an asset backed security there are three principal conditions that must be satisfied before we buy.
1. Are we comfortable with the collateral?
As the Great Financial Crisis proved, no amount of financial engineering can make up for bad collateral. We need to be at least reasonably confident that the loans on the underlying collateral, be that houses or cars, will generate the cash flows we expected. And, if for some reason they don’t, that we will be insulated from losses when that collateral is sold.
2. Will the structure of the deal protect us?
Generally we invest in the AAA tranches of these deals, which would be the last to take losses if the future expected cashflows weren’t to materialise. Our team of analysts run deep stress tests on all tranches, but essentially we want to be confident that there are enough investors below us in the capital stack to absorb any losses that may occur. We consider other metrics – prepayment rates, coupon step ups, arrears and more – but I think credit enhancement (the proportion of the deal that can take a loss before your bonds do) is by far the most important factor in avoiding a loss to capital.
As a very quick aside: no AAA tranche of any European ABS has ever taken a capital loss (assuming it were held to maturity) since the inception of the market in the early 2000s. The structures worked in Europe. Losses were suffered on AAA tranches of US RMBS but this was primarily due to the collateral (sub-prime, non-recourse, adjustable rate mortgages) being so bad that the losses ate through the whole stack.
3. Are the bonds good value?
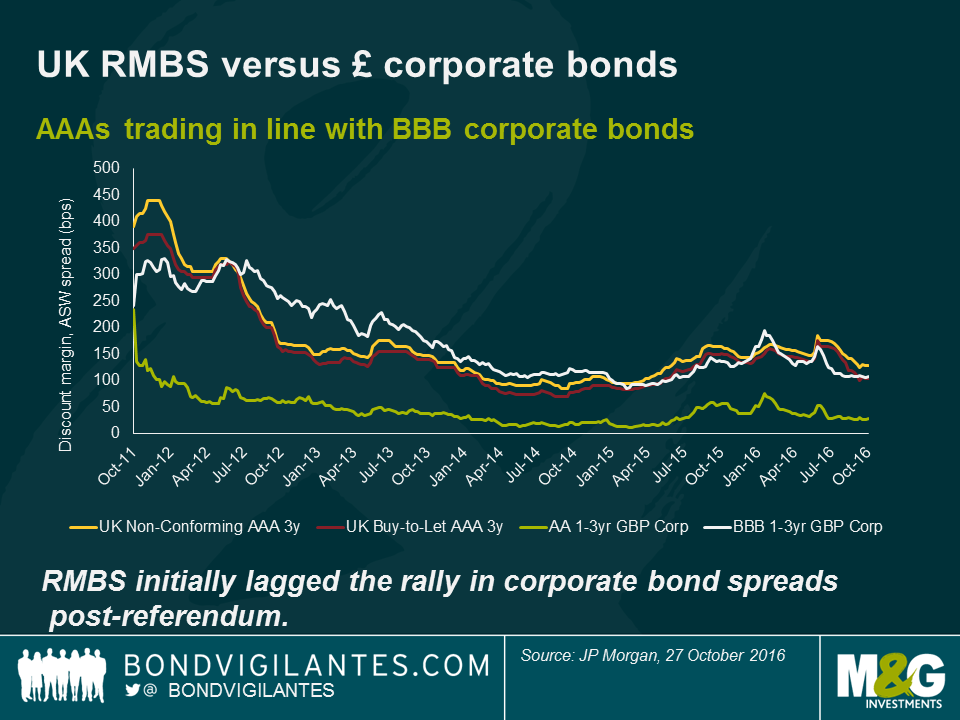
We assess this versus other similar securities and against corporate bonds more broadly. As you can see below, secondary market credit spreads on AAA-rated NC and BTL bonds are trading in line with BBB corporate spreads – and much wider than corporate bonds with a similar rating (we’ve used AAs in the chart below due to the scarcity of AAA corporates for comparison).

Unsurprisingly this, coupled with the lack of prime RMBS issuance (due to the BoE lending facilities), has caused a strong technical in the wider market with demand outstripping supply. In the last week or so we’ve seen new issues tighten 10-15bps in the secondary market and issuers have been able to use this strength to offer tighter spreads on subsequent deals. Even with this tightening we think these assets still offer better value than most traditional short dated corporate bonds.
While I’m singing the praises of the asset class, I should also mention that these instruments are typically floating rate notes (FRNs). This means that they are a good hedge to any increase in interest rates, as coupons are reset quarterly with reference to SONIA. As interest rates rise so do your coupons, helping to preserve the capital value of the bonds.
Another interesting feature of FRNs is that, when short term interest rates are negative, there is no mechanism for the lender to pay the coupons to the borrower. It doesn’t matter how negative SONIA goes – the minimum coupon the holder of an FRN will receive is zero. As strange as it sounds, the more negative rates go, the more attractive an income of 0% becomes and this will be reflected in the price of the bonds. In other words: at the zero bound, FRNs turn in to fixed rate securities as yields are falling. That is a very helpful and attractive asymmetry for bond investors to take advantage of.
We are of course very fortunate to have a large and experienced ABS analyst team to help us navigate the sometimes complex collateral and structures of these deals. But with this in mind, I think selling BBB unsecured risk into AAA secured for a pick-up in credit spread, while lowering interest rate risk, makes a lot of sense. Especially right now, when many investors have the desire to reduce the risk in their portfolio more broadly.
Few eyebrows were raised after the Bank of England raised rates: the last time unemployment was this low, the City of London was full of bowler hats – fund manager Matthew Russell says from the Bank of England.
Don´t miss Matthew´s blog: BofE – The unreliable boyfriend finally comes through with the chocolates
The Bank of England unanimously raised its benchmark interest rate by 25 basis points to 0.75% – are gilts still an attractive investment opportunity? Are rising rates the main challenge to UK government and corporate bonds? Has Brexit risk been priced in?
Is the Bank of England right to raise rates?
The unreliable boyfriend finally came through with the chocolates – after months of going back and forth, the Bank of England finally delivered what everybody had been expecting for months. The tightness of the labour market may have been the main reason behind all MPC members agreeing on the hike today – perhaps this tightening of the labour market is a bit beyond their comfort levels.
This hike shouldn’t raise any eyebrows: Unemployment is at its lowest since 1975, unit labour costs are on the rise, PMIs are looking healthy and inflation is above target. Increasing the rate 25bps seems entirely reasonable.
In a rising rate environment, are gilts still an attractive investment opportunity?
Rising yields make bond prices fall – but sometimes the cushion provided by the coupon that investors get is large enough to absorb the price loss, which means that investors still get a positive return. In the UK, this is a bit trickier because UK bonds typically have longer maturities relative to other developed markets: this means that investors are exposed to more interest rate risk (or duration). In this sense, short-duration debt may be more attractive in a rising rate environment. As shown in the chart, short-dated Investment Grade (IG) UK corporate bonds offer one of the biggest cushions to protect investors against rates moving higher: their yield needs to rise by almost another 1% before investors lose money.

Are there any other instruments that could help investors in a rising rate environment?
Floating Rate Notes (FRNs) are another option. Like any other bond, their price will be negatively affected if rates rise, but their coupon will adapt to interest rate moves, so it will increase if rates do, helping hedge some of the risk.
Higher rates are not the only threat to UK bonds – how about Brexit? Is the risk priced in?
As seen on the chart, UK IG spreads have moved more in synchrony with US dollar or Euro-denominated corporate debt, which reflects global investors’ risk appetite and global macro concerns more than any Brexit issues.

This happens because:
The effect of Brexit on UK companies’ funding may come more through the banking system, as a weaker currency may lift inflation, pushing the central bank to increase interest rates. This would translate into higher borrowing costs for British companies.
Should UK investors look abroad?
Absolutely – diversification pays off, especially in delicate times. There is a big wide world in Fixed Income markets, much deeper and broader than what leading benchmark indices reflect.
Interested in a weekly summary of global bond markets? Don’t miss the Bond Vigilantes’ new’ “Panoramic Weekly,” published every Thursday. Read today’s: EMs 1 – Trump 0
Don´t miss Matthew´s video: Bank of England – is it right to raise rates?
I was recently in San Francisco for an internet and technology conference. An array of senior tech managers spoke about their firms’ prospects, priorities and where they see opportunities. Twitter’s Jack Dorsey aside, the overwhelming focus of every session I attended over the three days was cloud computing.
Cloud computing is essentially the move away from users buying, owning and maintaining their own computer systems to a more on-demand, rental model. In the past we would buy a desktop computer, install our software and store our information on the hard drive (sat under the desk). We would use the processing unit to run the software and our calculations for us. If we owned more than one computer we could link them up – maybe via a central server – to create a network, allowing multiple users to share information, software and processing power. Moving an IT system into the cloud removes the headache and cost of buying and maintaining your own infrastructure.
Not only does operating in the cloud reduce costs, it also increases flexibility. If you need more processing power or increased storage capacity you can just give your cloud provider a call and they can (within reason) instantly meet your needs by flicking a few switches. Think of a retailer who experiences much higher traffic on their website around Christmas; if they have a cloud based infrastructure they need only pay for the extra capacity for the month or so that they need it. There’s no need for them to house and look after a large server farm, operating below capacity, for the other 11 months of the year.
As well as supplying hardware, software as a service (SaaS) is also a growth area which many of us may be more familiar with. Spotify, Hotmail, Gmail and Salesforce (currently building the tallest office in San Francisco) are some well-known examples. The benefit of SaaS is that the providers can make updates and fix bugs as and when they need to. Rather than a licencing agreement specific to one device, users pay a monthly/annual subscription fee to access the software on the cloud. This means they can access it from anywhere on multiple devices and they always have the most recent version.
Unsurprisingly, Silicon Valley start-ups were the first to embrace cloud technology when Amazon (AWS) began renting out its spare server capacity back in 2006. But now the industry is growing with non-IT focussed businesses becoming comfortable with the technology. AWS have maintained the first mover advantage, but they have some serious competition in the form of Google, Microsoft and Alibaba. All three are dedicating huge resource to their product and making an immense effort to sell their services, at an enterprise level, to CEOs and CIOs (chief information officers) of large firms.
There was a lot of discussion of hybrid models (i.e. companies having both cloud and on-site infrastructure) which I think sounds most realistic in the near term, as firms will take time to get comfortable with the new technology. The chart below, from BofA Merrill Lynch, shows their estimates of how the balance of investment will shift over the coming years within the storage segment.
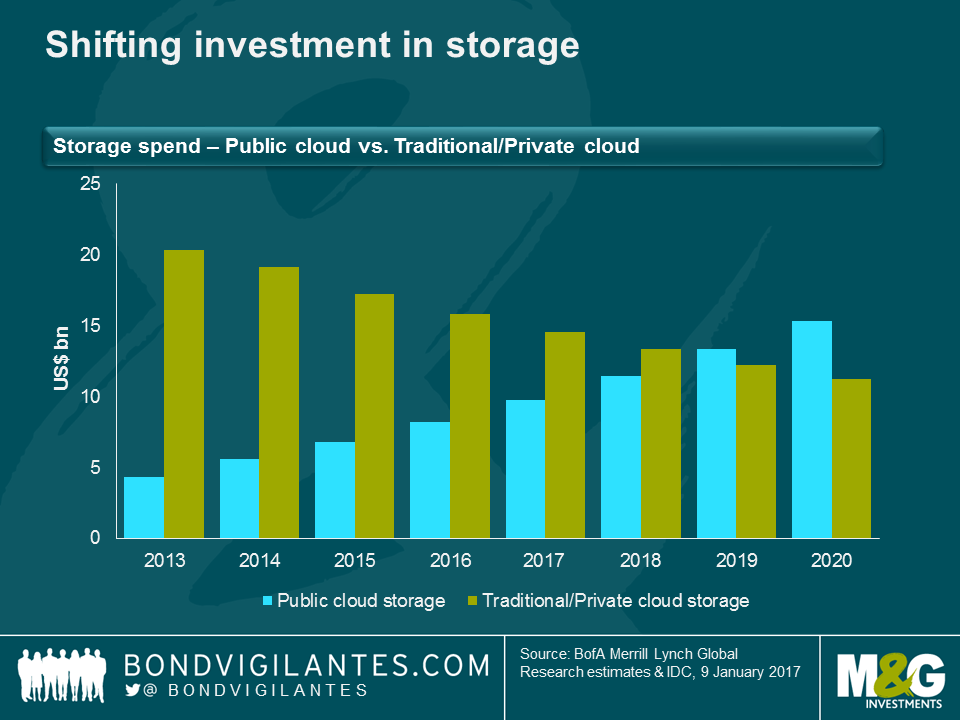
I think data security and reliability (as AWS’s problems last week demonstrate) will be chief among CEO/CIOs’ concerns, but assuming these can be overcome the general direction of travel is clear. Not being in the cloud put firms at a competitive disadvantage as their capex costs will likely be higher. I’m not convinced that real GDP statistics have been fully capturing the value of productivity gains from technological progress over the past couple of decades. Therefore I think it unlikely that, at a macro level, cost savings in the corporate sector will feed through to official growth, inflation and productivity numbers. Going forward however, if the majority of IT infrastructure investment is conducted by cloud companies in the future, the corresponding investment contributions to GDP will presumably accrue to those nations that host the cloud providers and/or the server farms.
What I am sure about is that a fundamental shift in how we store, share and process data raises questions over how to think about the tech giants providing these services. I’m confident this will be a high growth, high profit area in the years to come. But once the world is using the cloud for all its computing needs, and the large profit margins have been competed away, will it become sensible to think of them less as growth companies and more as utilities? In any industry when one earns monopolistic or oligopolistic power, increased scrutiny and regulation is sure to follow.
The IFS (Institute for Fiscal Studies) Green Budget hit the headlines last week with its forecast that, over the course of this parliament, the UK tax burden is set to rise to its highest level in 30 years. The IFS has calculated that by 2020 the proportion of national income raised through taxes will increase to 37%.
I was at the presentation, and the more concerning issue for me was the rather gloomy picture the IFS painted of UK GDP growth over the next couple of years. The UK economy grew by 2% last year, and the IFS expect growth to slow to 1.6% this year and 1.3% in 2018. Andrew Goodwin of Oxford Economics talked the packed Guildhall through the components of GDP and explained where they see the future weakness.
Consumer spending
The chart below – contributors to GDP growth in 2016 – clearly shows that the lion’s share of growth came from consumer spending last year.

The IFS contend that consumer-driven growth is unlikely to persist as consumers will be subject to a substantial squeeze in their real incomes (driven by flat wages and higher inflation) and will be unable or unwilling to borrow in order to keep spending.
I think there is definitely something to this argument, especially for those of employment age who already have historically high levels of personal debt. However, as the IFS themselves pointed out in a later presentation (on the pressure the NHS is likely to come under), the impact of shifting demographics will be key. I foresee these demographic changes being a major contributor to UK consumption growth in the coming years. I don’t think it’s a coincidence that the savings ratio began its recent decline around the same time that the first cohort of baby boomers reached the retirement age.
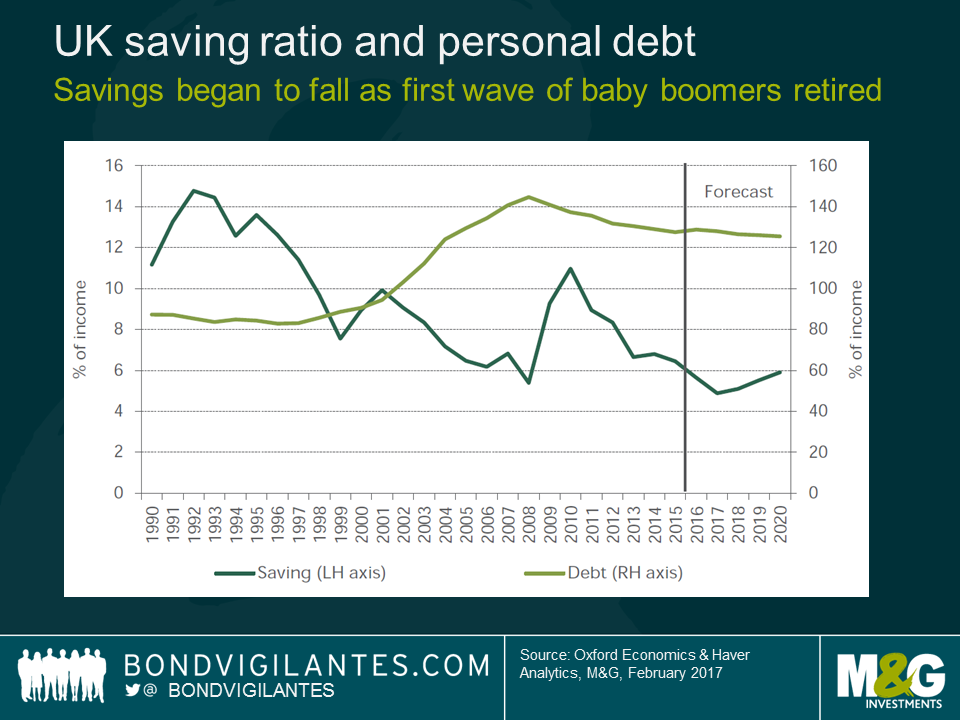
The 2011 census showed that in that year alone the number of people reaching 65 jumped by 30%. This trend of the post WW2 generation ending their working lives (saving for retirement) and beginning to draw their pensions (spending those savings) has a long way to run. It makes a lot of sense to me that the “grey pound” will help consumer spending stay buoyant in UK for some time yet.
I think it’s also worth remembering that 52% of voters believe that life will be better outside the EU. Whether they are proven to be right or not, why would one expect them to cut back on consumption in the short-term? They will likely only reduce consumption when (and if) the economic consequences of Brexit begin to hit home.
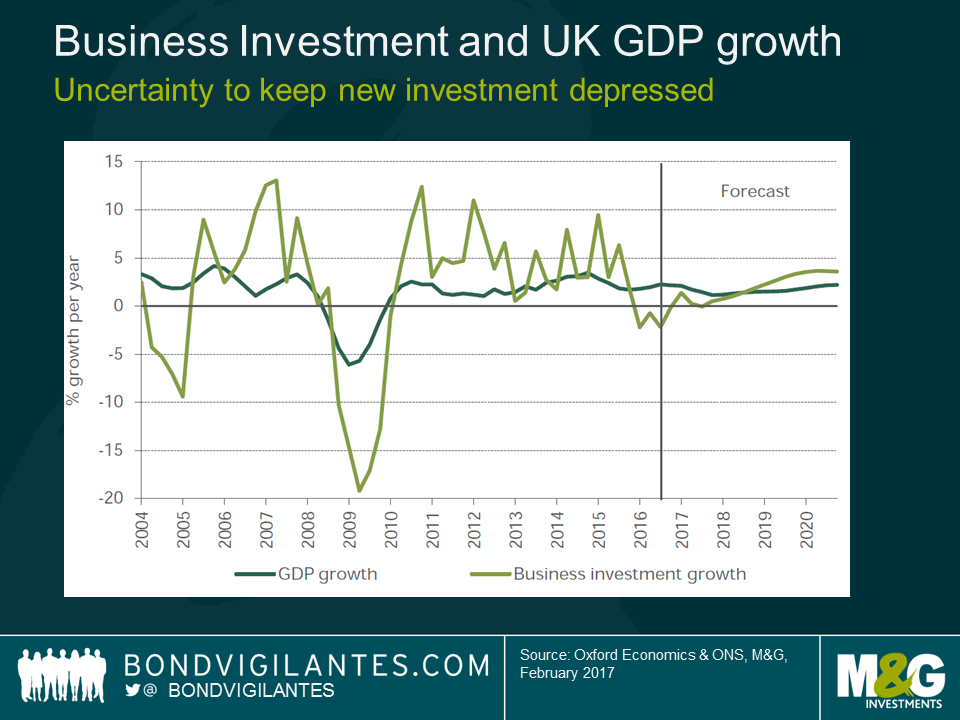
Investment
The IFS expect business investment to remain subdued due to “Brexit risks”. I don’t have any argument with this view. The inherent uncertainty of going through a period in which the UK will renegotiate its global trading arrangements will likely cause a pause in investment, until there is some more clarity.
Government spending
In short, austerity is here to stay. So we can’t expect an increase in government spending to contribute meaningfully to GDP any time soon.
Net trade
The presentation highlighted that, even with a roughly 20% devaluation in the pound, non-oil exports actually fell year on year. The suggestion is that, thus far, UK exporters have kept the prices they charge abroad the same. UK companies have preferred to increase their profit margins rather than attempt to increase market share by cutting prices.
I beg to differ on this forecast. Assuming no further sterling weakness (which I admit isn’t a given), a profit increase driven by a currency translation effect is a one off. Firms wishing to maintain this profit growth overseas will likely begin to reduce prices in an effort to capture a greater market share. If the strategy works we should begin to see UK exporters’ increased competitiveness come through in higher export volumes, rather than just in higher profit margins over the next few years.
The residential mortgage backed securities (RMBS) market has had a good run of late, so is the sector still good value and is there room for it to rally further?
The short answer: Yes.
The longer answer: There are a number of factors that should prove supportive for RMBS going forward, a few of which are discussed below.
The Big Short has been available on Netflix for a couple of months now, so I’ll assume that readers are already fairly familiar with mortgaged backed securities. What the film failed to mention however, was that these instruments are typically floating rate assets and are therefore a natural hedge to interest rate increases, as coupons reference LIBOR benchmarks. An additional feature is that they typically amortise: every month the cash value of bonds outstanding falls, as the mortgage loans backing the bonds are amortising (capital is repaid along with the interest). This means that the size of the universe shrinks naturally and investors are returned cash that they need to find a home for. This supply and demand dynamic may prove supportive for the asset class – more on this later.
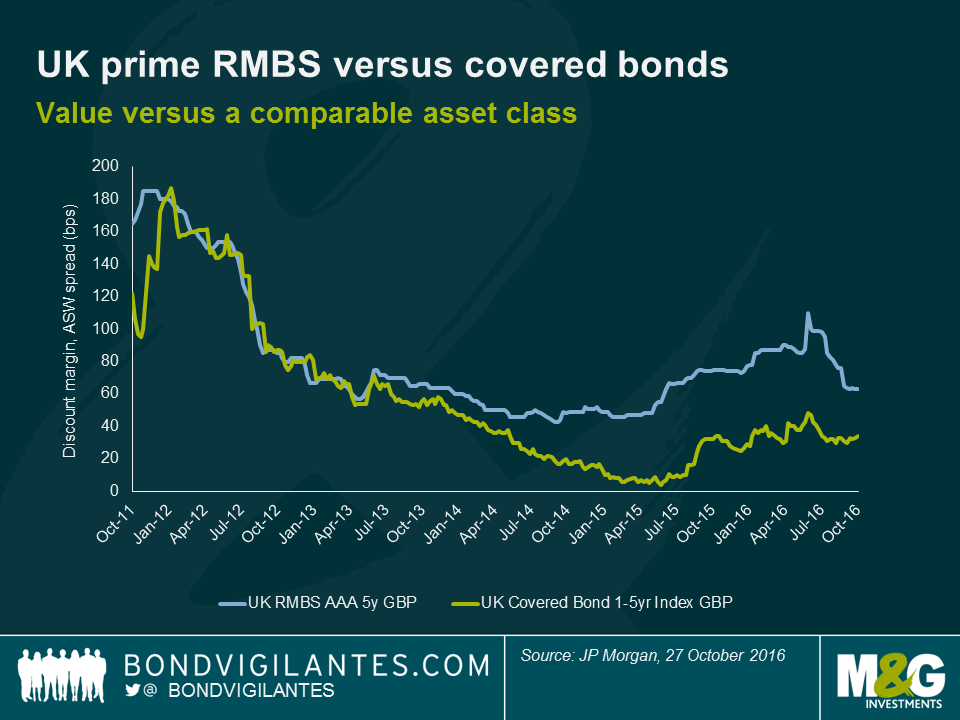
When it comes to spread levels, the RMBS sector continues to look attractive when compared to corporates. At the top end of the market, AAA rated bonds backed by UK prime mortgages (standard loans that high street banks provide) offer around a 30bp premium to covered bonds of similar maturities, even though these are backed by practically the same collateral.
The non-conforming and buy-to-let (NC & BTL) sectors are riskier due to the profile of the underlying borrowers, and so offer a higher credit spread. Even after the recent rally in RMBS however, the spreads on AAA rated NC and BTL bonds continue to trade closer to BBB corporate spreads than those of bonds with a similar rating (we’ve used AA’s in the chart below due to the scarcity of AAA corps).
We are mindful that some of this extra spread may be attributed to a relative illiquidity premium (it would be remiss not to acknowledge that these RMBS bonds can be less liquid than comparable corporate bonds), but they are far from being untradeable. Liquidity is however something to keep an eye on, particularly given the expected lower net issuance going forwards, which leads nicely on to the third point.
There has been markedly less supply of UK RMBS since the inception of Bank of England’s Term Funding Scheme (TFS), which allows banks to borrow close to the 0.25% base rate to fund lending to the real economy. One long-time issuer has explicitly announced that they will no longer be issuing RMBS as it makes less economic sense for them to do so. Instead, they prefer to use the TFS for their funding needs. Something similar is happening in the Eurozone with the ECB’s TLTRO diminishing a comparable pool of European assets.
On the demand side, the ECB is having an influence on the market by buying RMBS as part of its QE program. This has resulted in a tightening of spreads of both the bonds they are buying and those that they aren’t as investors move into other areas of the market. As yet, the Bank of England hasn’t been buying the asset class as part of its own QE program, but it is currently buying corporates. It’s perhaps therefore not a huge leap to imagine the BoE’s list of eligible assets widening to include RMBS, if they feel more monetary easing is necessary. A further source of demand for UK RMBS has come from large institutional investors entering the market in recent times, presumably to take advantage of the relatively wider spreads and the strong credit quality.


Sign up to the Bond Vigilantes mailing list to ensure you never miss a great article from our expert Bloggers. We will email all new articles to your inbox, meaning you can stay on top of the world of Bonds.
I confirm that I would like to receive information about Bond Vigilantes and products and services from M&G Securities Limited.
We will use the email address and personal data you have shared with us to send you this information. For existing customers, submitting your contact details and requesting to receive this information from us, will replace any earlier choices you have made in respect of marketing information.
You can unsubscribe from marketing at any time, at which point we will not send any further marketing information to you, by selecting the unsubscribe link in all communications.