Structured credit
18 May 2026

This year has seen the sharpest and largest economic downturn the modern global economy has ever seen. However, as I have commented several times this year, this recession is a rather strange one: for once, this time really is different (see chart below).
This recession has not been caused by any of the usual suspects: namely tight financial conditions, a real or market bubble bursting, a sharp rise in commodity prices or some combination of these. We have not seen the effect of this recession in many of the typical areas of weakness that follow such a downturn: I’m thinking of everything from the housing market and disposable incomes, to the huge rally in financial asset prices we have seen this year. Finally, this year has pushed investors to accept more than ever the bizarre situation of paying for the privilege of lending out their money — testing the zero bound in interest rates and leading to some very strange consequences indeed.
As we sit at this zero bound, I believe there are some important consequences for investors, ranging from the purpose of investing to the independence of central banks.

The theory of investing
The cornerstone of saving is security and return. In the following Panoramic we are going to focus on risk-free bond returns, and particularly on the strange consequences we see when this asset class has a negative return.
When buying a bond, you receive a set of cashflows in return for your investment. This is illustrated simply below.

This shows the income you receive and the final redemption payment. This income stream in the theoretical example generates a positive yield – the sum of the cash flows earned is positive. This is the fundamental basis of bond investing. However, recently this cashflow dynamic has been spun round. The actual example shows the cashflows you receive as a result of your investment in a negative-yielding bond, as we see in German bunds, for example. The cashflows earned are negative and the investor ends up with less money than originally invested.
Positive-yielding bonds offer a positive total return if held to maturity. Negative-yielding bonds provide a negative total return if held to maturity. Economic textbooks show savers receiving income, and building their wealth. Meanwhile, borrowers pay income for the privilege of borrowing. Yet, in a negative yield world, the saver receives the negative cashflow of the borrower, and the borrower receives income for borrowing. This is a very strange world indeed! In the past, this would have been very much a theoretical exercise, but now it is a real-world phenomenon, which investors are accepting – see the amount of negative-yielding debt illustrated below. [1]

How did we get to this point? The bull market of the last cycle has driven bond yields to new lows, while many central banks have cut rates to try to stimulate inflation in economies. The question now is whether this downward trend can continue forever. I don’t think so: at some point, the consequences of having negative rates become too great for investors to accept. At this point we hit the “zero bound” – near zero, though not necessarily exactly at zero. The chart of 10-year rates below shows the trend over the last 30 years, with rates declining and halting at the zero bound. So why do rates stop at the “zero bound”?

Why there is a zero bound
Bond yields have difficulty going much below zero because if investors are faced with owning negative yielding debt in Japanese yen, for instance, they have an alternative. They can simply hold Japanese yen cash instead. Rather than exchanging 100 yen and receiving fewer yen at maturity if purchasing a bond, an individual could simply hold 100 yen in cash and not suffer the loss. Holding cash has its risks and potential costs in terms of security and storage. These costs effectively set where the zero bound falls, and why it is not exactly zero: it would be zero, were there no costs to holding cash instead of bonds. The presence of this alternative risk-free investment explains why central banks around the world have not enacted a significant negative rate policy: the existence of cash is the main barrier to negative rates.

The risk/reward of the zero bound – There Is No Yield (TINY)
Once we recognise there is a zero bound somewhere, what does that actually mean for bond investors?
When looking at the risk/reward of the zero bound, the first issue we face is that There Is No Yield (TINY). With yields at all-time lows, investors are not earning significant returns at all, while in some cases paying for the privilege of lending. Secondly, it is clear that yields can’t fall forever: the upside of holding duration is limited due to the existence of the zero bound. One way to explore this is to use zero coupon bonds to illustrate the risk and reward profile to which investors are exposed when buying bonds in the TINY world.
Currently, if you agree to buy a 30-year German bund at a negative yield, you essentially agree to make a loss if held to maturity. This is of course different from a positive interest rate environment, where if you hold the bond until maturity you will end up with a positive return. The profit or loss involved is illustrated in the chart below: if you buy a bond with a -2.3% yield, you lock in a halving of your money.

The upside to holding low- or negative-yielding bond securities is therefore very limited and explains the short duration view I express in my funds. When you hit the negative bound, or get near the negative bound, it becomes challenging to invest; upside is limited and losses can quickly accrue (even more so if you hold longer-term debt to maturity).
So while it is possible to get to negative interest rates in principle, it is rarer in practice, and there is a limit: the upside to investors is limited, but the downside could be quite large, and so at a certain point investors won’t accept this. This means it is hard to justify being long duration, from my perspective. As a risk-reward instrument, holding interest rate duration becomes unattractive when you get near the zero-bound. There are also other, wider consequences beyond the risk-reward of owning bonds as yields reach the zero bound.
Consequences of reaching the zero bound
One of the most obvious consequences of reaching the zero bound is that central banks can no longer stimulate the economy in the event of a deterioration in growth and demand. As rates cannot go very negative, the policy tool is effectively removed from their toolkit. This is illustrated by the actions of central banks in regions where rates were already negative or near zero, like Europe and Japan: the policy option has gone. We saw the effect on holders of interest rate duration over the past year: in countries where rates could still be cut (the US and the UK), falling interest rates provide some upside to bond investors; in countries with zero or near-zero rates (German and Japan), they did not provide much upside at all (see charts below).


Another effect of short-term zero or negative interest rates is the extent to which this undermines the banking system’s traditional role in bridging saver and lender. As former Bank of England Governor Mervyn King alluded to in a recent TV interview: “[Negative rates] can’t work with a successful banking sector unless the banks can pass on negative rates to their retail customers. Once that happens, I think you should expect to see a long line of customers seeking to take their cash out of the bank and keep it under the mattress, or at least in a new home safe. I don’t think that is a politically attractive prospect at all”. [2]
It is clear that having zero or negative rates is a threat to the ability of central banks to use monetary policy and to the banking system’s effective functioning.
Unable to cut rates, central banks then pursue other options, resulting mainly in driving rates lower along the yield curve via measures such as forward guidance (i.e. pre-committing policy to a low rate range) and quantitative easing. These actions lower rates along the whole yield curve, flattening it by pushing longer-term rates towards the zero bound too. This can be seen in the chart below of the market 50-year sterling overnight lending rate: it reached the zero bound.

Likewise, the psychology of investors not wanting to lock in a guaranteed loss leads them to extend the maturity of their investment, again pushing the whole curve towards the zero bound. Investors’ purchases of longer-dated bonds result in very flat yield curves as can be seen below. This effect is so powerful that in extremis whole bond curves can exhibit negative yields (see chart below).

As monetary policy reaches its limits, fiscal policy has to take a greater burden in reviving the economy. Consider the recent comments from Federal Reserve chairman Jerome Powell, and European Central Bank President Christine Lagarde. Both central bank chiefs have called on extended fiscal support to boost Covid-hit economies as we approach a tough winter. Powell said that “too little support would lead to a weak recovery, creating unnecessary hardship for households and businesses”, while stating that even if stimulus is above what is needed “it will not go to waste”. Meanwhile, Lagarde emphasised that it is “more important than ever for monetary policy and fiscal policy to keep working hand in hand”.[3]
Interest rates are a pricing mechanism that set a level at which savers and borrowers can interact, and provide an efficient recycling of savings. Between these two economic agents, we have a banking system that recycles that capital. These banks make money on the bid- offer spread between borrowing and lending, but are also heavily dependent on the central bank for help. When the central bank sets a high rate, it is guaranteeing savers and banks a high return for taking no risk – in effect offering a subsidy and a transfer of wealth from the state to the saver. In an environment of negative rates, the central bank is instead taxing the financial system, and savers will be reluctant to lend. In that case, the recycling of capital grinds to a halt.
How to remove the zero bound
The simplest way to remove the zero bound and restore the ability of central banks to cut rates would be to remove the option of holding cash. Electronic money is a solution as, if there were no cash, then your electronic money deposit could decay over time, producing negative rates with no alternative cash to hand. Politically, though, this would be highly unpopular for various, obvious reasons – and individuals may see this as a tax on capital. Other alternatives to money might also be sought, which would undermine this approach: gold, a foreign currency or a different version of electronic money such as Bitcoin are examples.
The second way would be to let the central bank lend money below zero to subsidise the banks. That is the ECB’s approach with its TLTRO (targeted longer-term refinancing operations) programme, designed to stimulate lending and act as a simple subsidy from the central bank to private sector banks. However, this is an intrinsically loss-making transaction by the central banks and ultimately has limited power, because it creates an arbitrage opportunity between negative rates and physical cash.
The third option is to print money. This is perhaps the simplest way to escape the zero bound, but unfortunately raises the difficult question: who do you give the printed money to? Central banks are in the business of lending money, not granting money. As Federal Reserve Chair Jerome Powell said in his May keynote speech, “the Fed has lending powers, not spending powers”. [4]
The printing of money is a government decision
To escape the zero bound requires a number of key elements. It would require the support of governments through fiscal spending, the printing of money by the central bank and hopefully a pick-up in inflation. But this requires central banks and governments to work together. Fiscal spending is within the remit of government and, if the central bank is printing money, the decision on how that money is distributed is a political one. Central banks and governments have to work together.
No Independent Central (NICe) Banks
The ultimate way to do this, for fiscal and monetary policy to be aligned, would be to remove central bank independence. Arguably we have begun to see signs of this over the past year, with the significant government debt purchases of a number of central banks. Independent central banks were created in the first place to help control inflation and I would argue that, in politicising central banks, we would be allowing the inflation genie back out of the bottle. In order to escape the zero bound we need inflation, and by politicising central banks inflation and inflation expectations would rise.
It would be easier to remove the independence of some central banks than others, of course. The simple delineation here is federal central banks versus state central banks. It would be relatively straightforward to regain full control of the Bank of England, for example – in fact, it is already provided for under existing legislation: according to the Bank of England Act 1998, “the Treasury is given reserve powers to give orders to the Bank in the field of monetary policy, but the Act states that this is only if the Treasury is satisfied that they are required in the public interest and by ‘extreme economic circumstances’.” [5]
In the case of federal central banks it is more complicated. With federal central banks, monetary and fiscal policy are generally harder to carry out in tandem, as typified by the challenges faced by the European Central Bank.
The future of central banks
Central banks are an ever-evolving beast. Their need for independence was born in the high inflation conditions of the 1970s. This regime has worked exceptionally well in reducing inflation to the targets that have been set. If we now have a situation where inflation is permanently anchored around a two percent target then, by definition, central banks will quite likely be faced with the zero bound issue. The tapering of political influence on monetary policy has also helped reduce inflation, and this has been combined with the tailwind of falling inflation from globalisation and progress in technological productivity.
While central banks cherish their independence, they have been exceptionally vocal recently that fiscal measures (that are inherently political) are required. The gap between politics and central banking has been further eroded as central banks are now opining and focusing on what were previously political issues. For example they are now focusing more on income inequality and the global warming conversation — both historically hot political topics and not the remit of unelected central bankers. With these issues in mind, it may be practical for central banks to become less independent, and the political bias to generate inflation may be an appropriate change in economic direction.
Implications for investors
Given the authorities are going to do what they can to exit the zero bound, what are the implications for investors? It would be logical to assume that escaping the zero bound would require extensive monetary and fiscal policy. This would mean short rates being kept low for a number of years, while inflation needs to be re-established as a permanent feature. This points potentially to a very steep yield curve, with short rates pegged, a heavy supply of government debt, and inflation making real bond returns less attractive. It is likely that this high level of monetary and fiscal stimulus will be a strong boost for the global economy. What kind of traction will it provide in 2021 and beyond?
Outlook and concluding thoughts
The world is going through a t-shaped recession: a sharp fall down, with a recovery back towards previous levels. The question is how high up the “t” the crossbar gets. Given that the service sector has been the main victim of the lockdown recession and government action, the ability to reopen quickly may mean at the extreme that we even get close to a T-shaped recession. The lower the bounce, the better for interest rate risk and the worse for credit risk, and vice versa. This is why the economic outlook is so significant in bond investing. However, the risk-reward profile of taking interest rate duration is currently skewed: there is limited upside on profiting from further falls in interest rates if the zero bound persists. This has been demonstrated in the real world of bond investing this year.
There is a need to escape the zero bound for micro and macro policy reasons. This will require central banks to be more “NICe” as they work closely with governments. In such a scenario, fiscal and monetary policy will need to remain loose for some while, potentially aided by central banks printing money to provide the fuel to escape the zero bound. This type of policy generally leads to higher growth and inflation. This bodes well for the economy and for credit risk, but points to a rise in longer-term bond yields.
[1] When looking at total negative rates, one should bear in mind that rates are defined as the rate in a given currency. If we were to hedge global debt into a base currency of euros for example, the negative outstanding debt would be boosted; if it were turned into US dollars, it would be reduced substantially.
[2] Mervyn King, Bloomberg TV, 16/11/20.
[3] https://www.marketwatch.com/story/powell-says-u-s-economy-needs-more-fiscal-support-11601995205, https://uk.finance.yahoo.com/news/lagarde-pledges-forceful-ecb-stimulus-082057866.html
[4] Current Economic Issues: Remarks by Jerome H. Powell, Chair, Board of Governors of the Federal Reserve System at Peterson Institute for International Economics, Washington, D.C., May 13, 2020 https://www.federalreserve.gov/newsevents/speech/powell20200513a.htm
[5] https://www.bankofengland.co.uk/-/media/boe/files/quarterly-bulletin/1998/the-boe-act.pdf
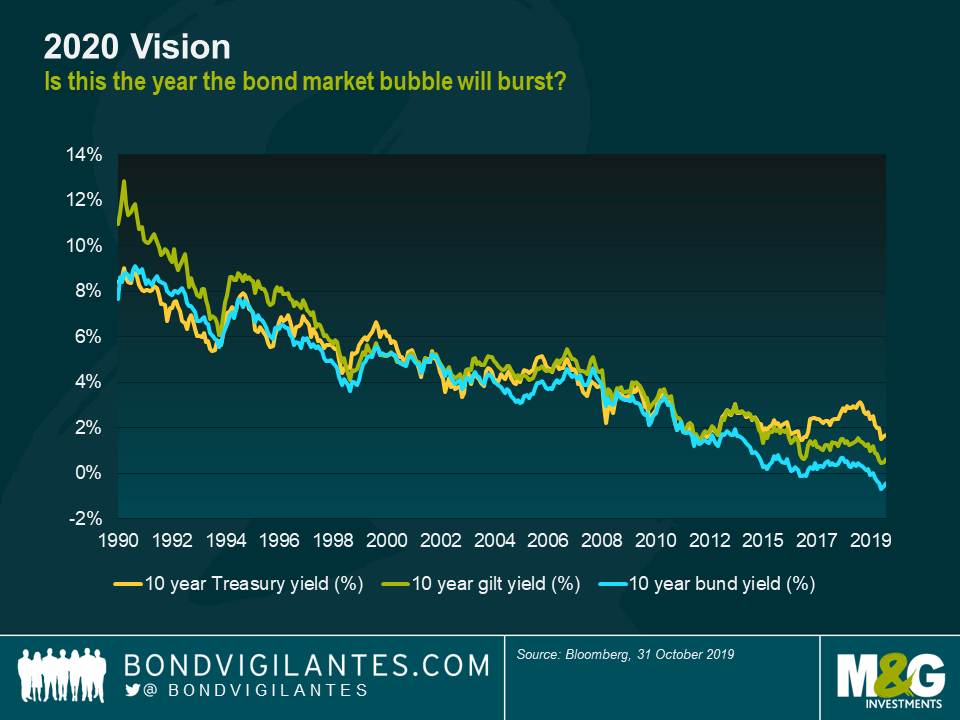
Let me start with two predictions. Firstly that the title “2020 Vision” will be irresistible to all year-ahead outlooks, no matter what publication or industry you work in. This is why I trademarked the idea many months ago, and now expect to retire on the proceeds of all the copyright breaches. My second prediction is that in my industry, bond fortune telling, virtually all of those 2020 outlook pieces will declare that it will be the year that the “bond bubble” bursts. Maybe they’ll be right this year, after a 30-year streak of “sell bonds” predictions. But their track record doesn’t suggest they have an edge in the bubble popping business.
If you do believe that 2020 is the year for bond bears finally to triumph, I think you have to believe that a lot of very long term, established trends are about to come to an end simultaneously. These trends are the Secular Seven. If you think that their powers are at an end, or significantly diminished, then you should join the January anti-bond mob with their pitchforks and flaming torches. Otherwise you’ll probably want to wait to see a conclusive break in the 30-year downtrend in bond yields and inflation before saying goodbye to fixed income.
The Secular Seven
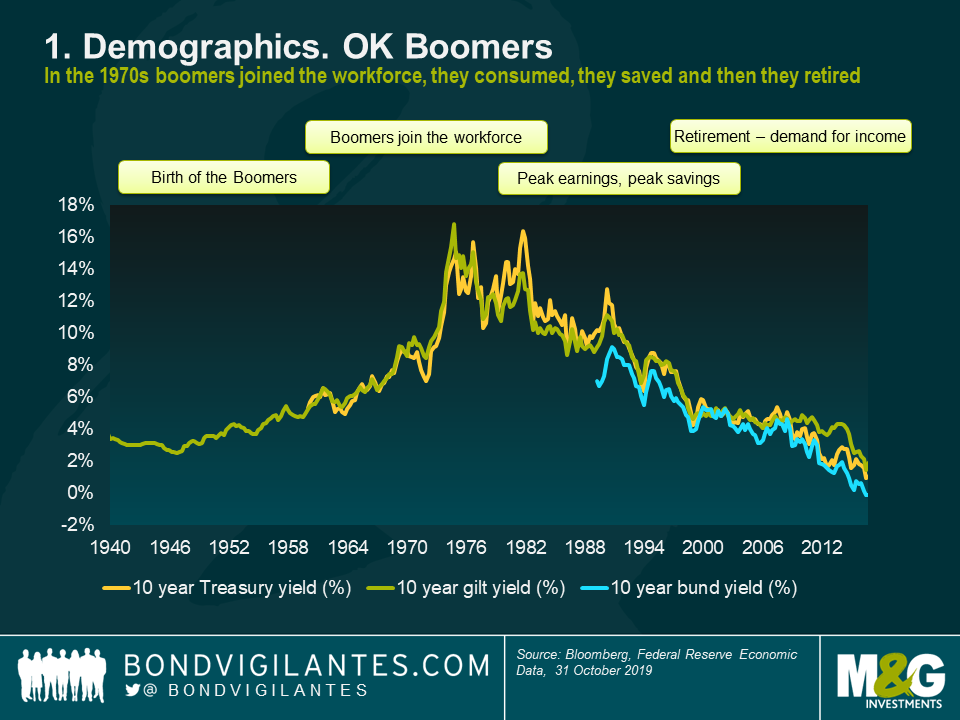
1 – Demographics. OK Boomers. The post-World War 2 baby boom impact on the economics of the developed economies can’t be overstated. In the 1970s and onwards as the Boomers left education and came to dominate the workforce, the labour scarcity that had been a feature of the western economies for a couple of decades started to come to an end. Trade Unions lost their membership and their power, and wage inflation dropped. Economies became more productive, and wealthier. With largely young and healthy populations, pressures on the welfare state (for example pension burdens, and care and healthcare costs for the elderly) were relatively subdued. As the demographic basketball (the Boomers) passed through the snake and reached peak earnings, their desire to save and invest those savings also hit new highs. Demand for income and safe assets grew dramatically – driving bond yields down.
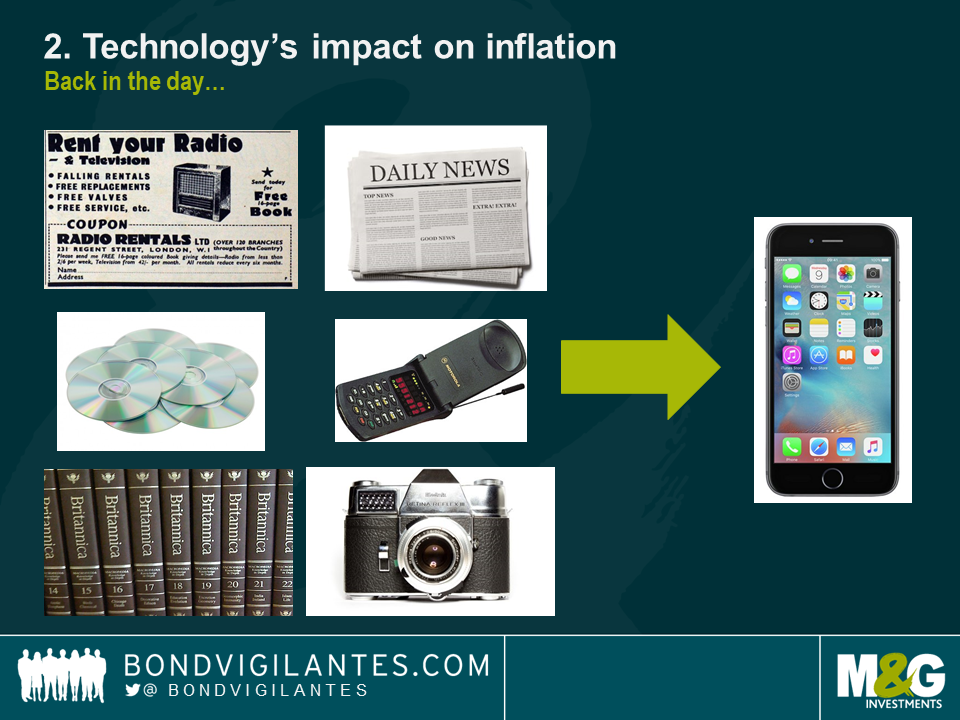
2 – Technology’s impact on inflation. Why can’t we generate consumer or producer price inflation in developed economies despite zero or negative interest rates, “money printing” and periods of growth and low unemployment in the past decade which historically might have generated CPI of at least twice the current common inflation targets of 2%? The dramatic deflation in consumer goods is one answer, and a good part of that has been driven by the collapse in the price of technology. The 1996 Motorola StarTAC mobile phone cost $1000 then; a similar level phone today is about $200. 1996 was probably also the year I stopped hiring a TV (paying monthly) from Radio Rentals and bought one, as they’d become affordable. And it’s not just the cost of the hardware: I used to spend at least £50 a month on music on compact discs (and cassettes before that, which I note are now fashionable with youngsters). Now I pay £12.99 a month for all the music in the world on Spotify. Think also of all the free stuff that the internet provides, from maps to encyclopaedias and news, and perhaps the impact of low inflation is actually understated. The transparency of the internet also allows me to find the cheapest thing in the world whenever I buy something. Awful news for high street retailers, but the deliverer of a huge consumer surplus and disinflation. Finally, we haven’t even discussed the Rise of the Robots yet: what if AI and robotics are finally deployed in the workforce on a massive scale? What does that do to wages? To employment and disposable income? It certainly sounds like a further technological leg down in price inflation is possible.
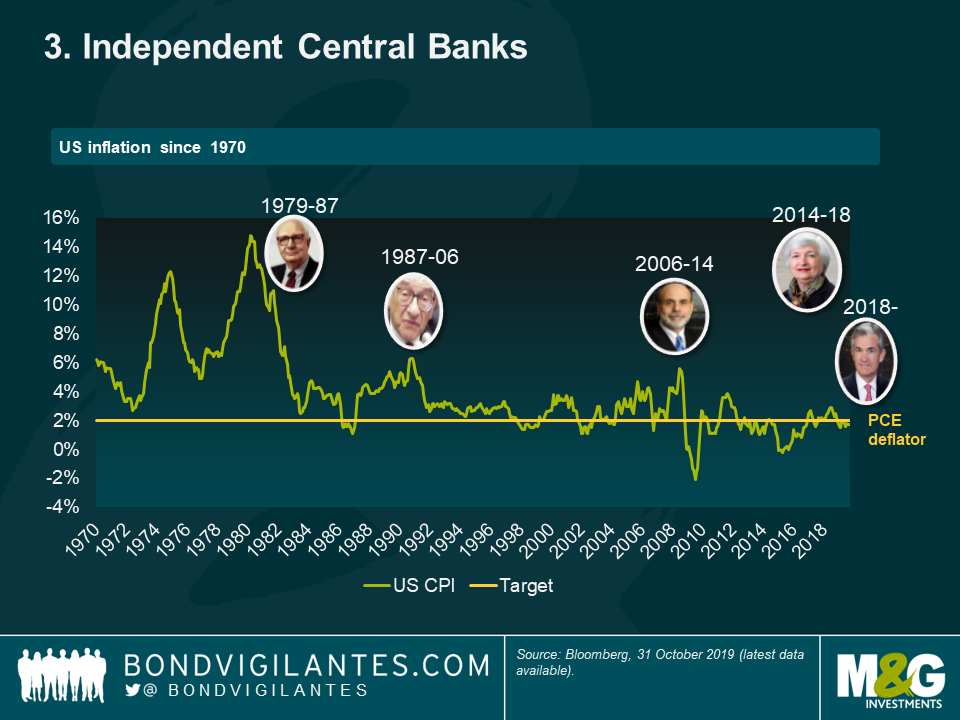
3 – Independent Central Banks. When Paul Volker was appointed Chair of the US Federal Reserve Bank in 1979, inflation in the States was 11.3%, peaking in March 1980 at 14.3%. US Treasury Bonds were thought to be almost uninvestable as yields were eroded by the rise in the cost of living. Volker set the Fed Funds rate above the rate of inflation – at the time a radical idea. Inflation fell steadily through his tenure, and an “inflation fighting central bank” culture was established. This led to explicit inflation targeting around the world, from New Zealand through to Gordon Brown making the Bank of England independent, and on to an ECB which was so wedded to this inflation-fighting mandate that its President, Trichet, hiked rates twice in the midst of the Global Financial Crisis on the grounds that oil prices had risen year on year and had taken eurozone CPI above 2%. Central bankers have certainly taken a lot of the credit for the bond friendly environment we’ve been in for the past couple of decades, but it’s clear that this separation of their powers from elected politicians coincided with some arguably more powerful trends.
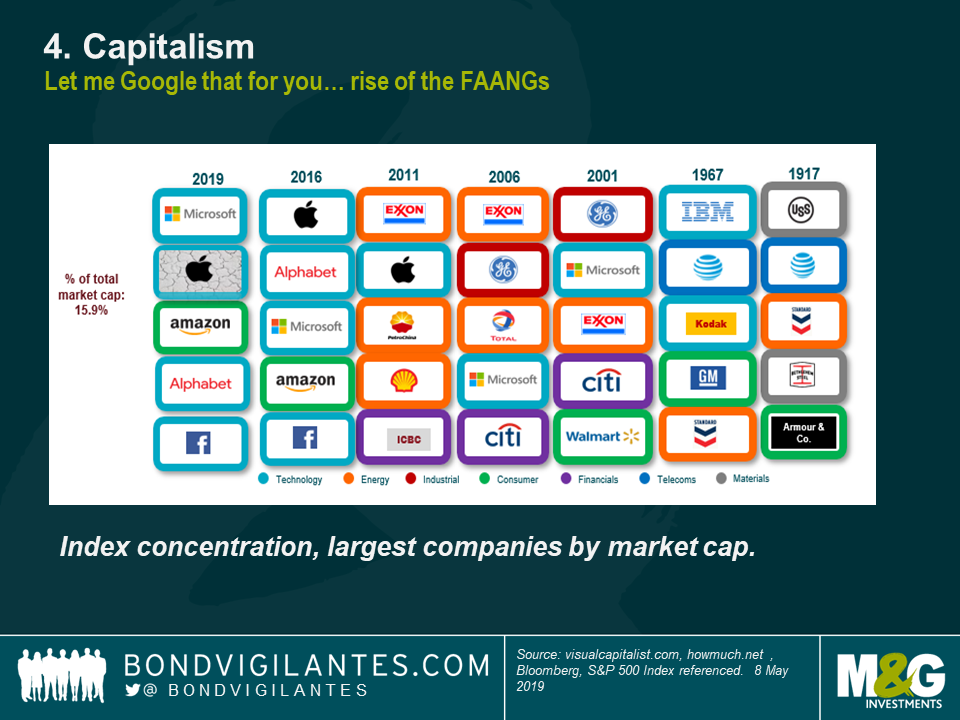
4 – Capitalism. As labour has become less powerful since the entry of the Boomers into the economy, capital gained the upper hand and has taken the bigger share of profits and growth in developed economies for years now. Governments have deregulated financial markets and labour markets (with some notable exceptions like the introduction of the Minimum Wage in the UK), and the emergence of the new tech giants (the FAANGs) has led to both increased competition in some areas (Amazon has delivered massive consumer surplus in its race to acquire market dominance) and monopoly creation in others (Google is a verb as well as an online advertising giant). Capitalism has thus kept wage growth low, and encouraged the growth of a tenuous gig economy landscape. Whilst there are examples of monopolies developing, as the land-grab continues, prices have stayed low. Take a look at some of the bloggers in the US who write about existing on free trial subscriptions (everything from mattresses to groceries) and half price food delivery offers as companies try to buy some market share. I’ve got a 50% off Uber Eats trial in my inbox right now. Burger or pizza?
5 – Globalisation. China joining the World Trade Organisation in 2001 didn’t start the process of globalisation, but it did signal that everything had changed, especially for manufacturing companies. The supply chain became a global one, and goods prices collapsed as we all imported cheap stuff made by people earning fractions of western wages. The liberalisation of trade barriers and tariffs, together with advances in the logistics and cost of containerisation and shipping, meant that manufacturing jobs went east and cheap goods flowed west.

6 – The Austerity Meme. I’ve been fascinated by the Reinhart & Rogoff “This Time is Different” book ever since it came out. Flawed in some of its initial calculations, its narrative of higher government borrowing leading to economic disaster nevertheless set the scene for a decade of austerity in many of the economies hit hardest by the Global Financial Crisis. Now the relationship between government borrowing, bond issuance and bond yields is surprisingly weak: you’d think that as governments issued more bonds, prices would fall. This turns out not be true historically, as times when governments borrow more have usually been those times when growth and inflation are weak. Nevertheless, the UK for example has seen relatively low bond issuance since the GFC as the result of the longest period of austerity recorded. Germany is running a budget surplus, despite stagnant eurozone growth. It’s therefore possible that this period of relatively low bond issuance at a time of weak growth has delivered lower bond yields than we’d have normally had.

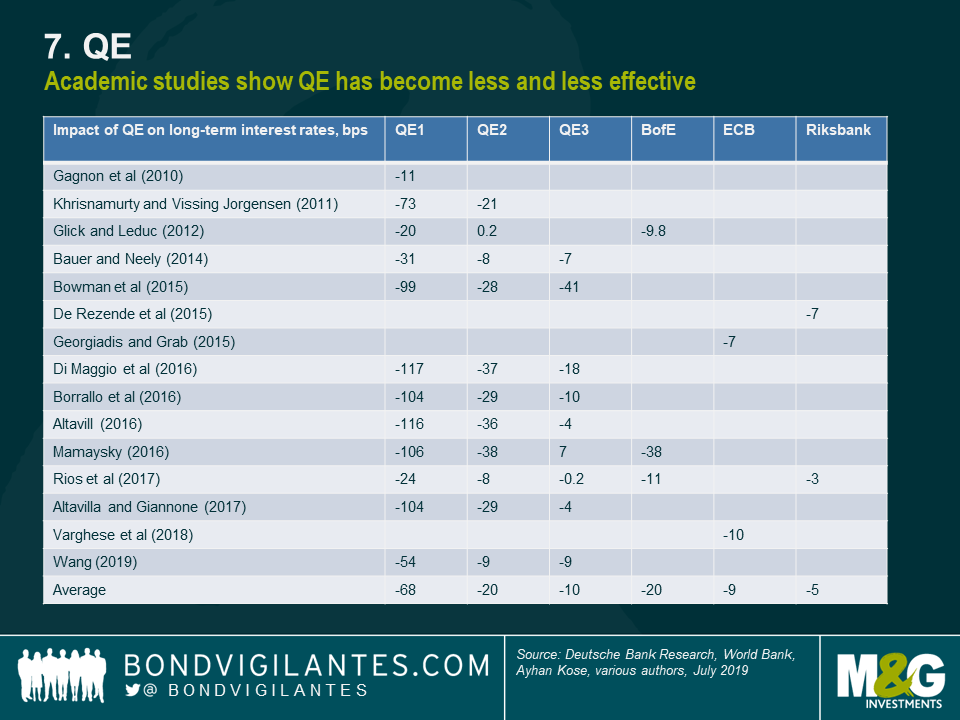
7 – QE. We’ve had 3 rounds of Quantitative Easing from the Fed since the GFC. The Bank of England has also bought both gilts and corporate bonds. The Bank of Japan and the ECB have also massively expanded their balance sheets in bond purchase programmes. And the ECB has just announced endless QE in Mario Draghi’s parting policy announcement. Does QE reduce bond yields? Yes. A study of all the academic papers on the impact of QE around the world showed that on average the three rounds of US QE reduced US Treasury Bond yields by about 70 bps, 20 bps, and 10 bps respectively. Whilst inflation remains below target in most of the developed economies, it’s unlikely that we see any unwinding of the bonds held on central banks’ balance sheets – in fact some of us think that these bonds will never be set back into the wild, and will mature in the dark of those central bank vaults.
So are any of the Secular Seven under threat?
Yes. Many of them look to be less powerful than they were at their peak, although it’s possible that we’ve only so far seen the first stages of technology’s impact on wages and inflation: companies are sitting on cash piles that will be invested in productive technology at the first sign that their flesh and blood robots are achieving higher wages. An example of this in action was the introduction of self-service ordering systems in fast food restaurants after minimum wage increases for workers in those US businesses.
Demographic trends remain in place, although the never ending increases in life expectancy that we’d come to expect have stalled in some demographics, thanks to obesity related illnesses and opioid addiction. There are also some stark differences across the developed world, with birth rates in the US much higher than in parts of Europe, implying higher potential growth rates in America in the future. Japan shows us that even when labour force growth peaks and declines (Japan is a decade ahead of the west demographically), this isn’t enough on its own to combat entrenched deflationary forces.
Have we had enough of independent central banks? Donald Trump certainly has if you read his tweets over the past year. Fed Chair Jay Powell has come under immense pressure to cut rates towards zero again, and if Trump is re-elected in 2020 you have to imagine that Powell is replaced by someone more willing to turbo charge the US economy. In the UK, Mark Carney remains as the Bank of England Governor for the time being, but you could imagine some post-election outcomes that deliver some partisan choices as his replacement. Incidentally, the Bank of England just announced it is changing the title of its Inflation Report. It will now be the Monetary Policy Report which, if Sod’s Law has its way, will mark the return of rampant price rises. Central banks took the credit for the collapse in inflation over the past thirty years – and as I’ve discussed they were just one smallish part of that story – so they shouldn’t be surprised to take the blame now that inflation is too low for comfort, and this will undoubtedly threaten their mandates.
Whether capitalism’s dominance of the economic system continues to the same extent rather depends on a couple of rather important election results. On the electoral front, whilst neither candidate is a bookmaker’s favourite to take office, both Jeremy Corbyn in the UK and Elizabeth Warren in the US have a chance of power, and both have radical agendas which would likely involve higher rates of corporation tax, wealth taxes, financial transaction taxes and higher government spending. Monopolies in the tech space could be broken up, and financial regulation could tighten once more. Nationalisation of some industries couldn’t be ruled out. After a period of right wing populism in the UK (Brexit) and US (MAGA), the pendulum might swing the other way, and the left could take its revenge. Coupled with existing protectionism movements in the US (the trade war with China could be cooling, but has already damaged the global economy) and new European trade barriers post-Brexit, the left’s anti-globalisation philosophy (on the grounds that it produces a race to the bottom in workers’ rights) could exacerbate the stalling on global trade flows.
We go into 2020 then with some of the tailwinds for falling bond yields having been diminished, and one in particular – that of the austerity meme – likely to have turned into a headwind, with some potentially large increases in government borrowing in prospect. Also importantly, our starting valuations for “risk free” assets are unattractive, with most developed market government bonds having negative real yields. I don’t believe that a negative real yield is in itself an aberration, and we should come to regard the elevated real yields of the 1980s as the exception rather than the rule (you could get RPI plus 4% when you invested in index-linked gilts for a time), but clearly government bonds are expensive historically.
All of this means that I too will end 2019 with an underweight view on government bonds, expecting yields to move higher next year. But on any significant move up in bond yields, I’d want to buy back my gilts, bunds, Treasuries and JGBs, as many of the Secular Seven trends remain powerful, and there are clearly significant economic and social fragilities in the global system that could trigger further central bank policy moves – both traditional (rate cuts) and extraordinary (rate cuts below zero, more QE) – and a new flight to quality. We ain’t out of the shadow of the GFC just yet, and with more debt in the global system than there was in 2007, rising bond yields themselves could trigger the next big downturn.
Finally, remember that the global government bond market sets the “risk free” rate which is the major input in the valuation of all asset prices – from corporate bonds, to equity, to property. So if you are expecting a bond blood bath, the impact on other asset classes could be even more severe…
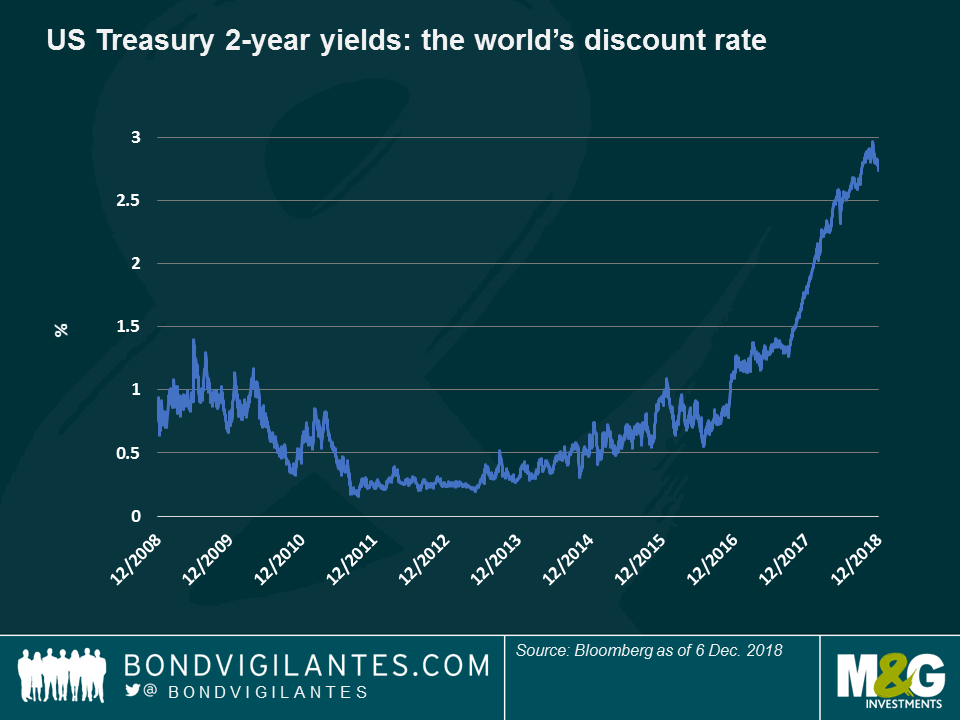
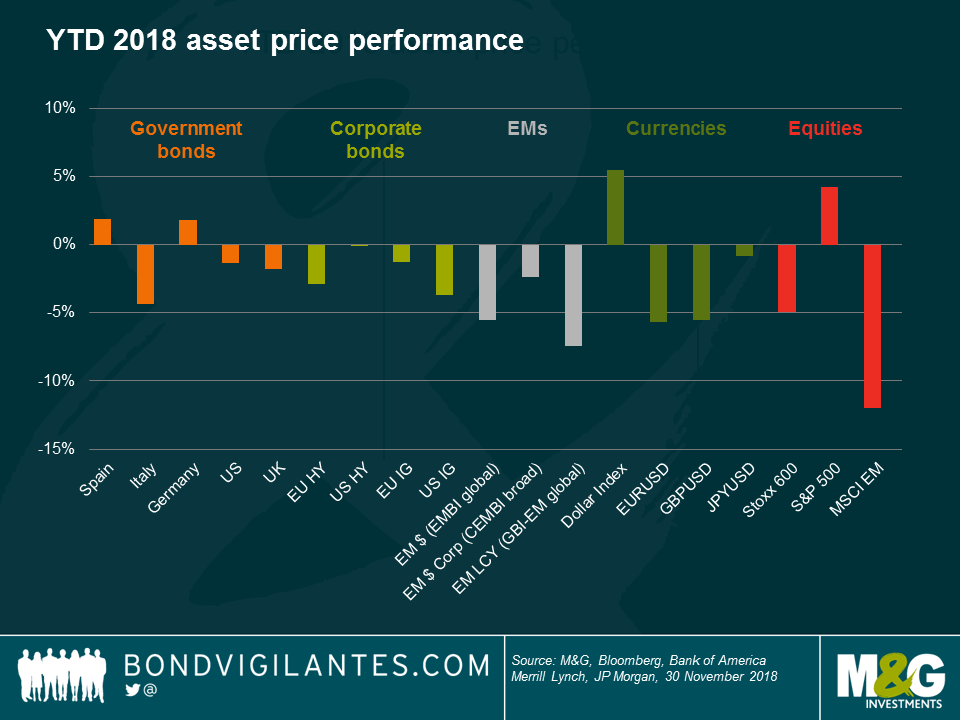
Whilst you can make some strong arguments for the negative returns from 90% of asset classes in 2018 based on the return of populist politics – think of Brexit, Italy’s political instability, AMLO’s election in Mexico and tariffs everywhere – the answer to those negative returns might be simpler: the de facto global discount rate, the 2-year US Treasury bond yield, has risen by almost 100 basis points (bps) over the year, and thus repriced global assets. Why did this happen?
Well, 2018 was the year in which the global Quantitative Easing (QE) experiment started to come to an end. In the wake of the Global Financial Crisis (GFC) in 2008 and the aftershock of the subsequent Eurozone Debt Crisis, central banks around the world started buying their own government bonds on a massive scale. The effectiveness of such programmes has been widely discussed, but most academic literature agrees that buying sovereign bonds brought down yields, creating a “portfolio rebalancing” effect that led investors to reach into riskier assets for income. In the UK, gilt investors sold their government bonds to the Bank of England and bought high quality corporate bonds instead; credit fund managers similarly added high yield bonds to their portfolios, while high yield investors moved down from BB to B rated debt. This led to a global inflation in asset prices, with the price of everything, from equities to art and fine wine, going up. The owners of such assets tended to be already wealthy, so inequality in society increased. Central banks regarded this as a known and necessary side effect, since inflation and economic growth also rose due to lower financing and debt servicing costs, benefiting everybody – but some argue that QE was a factor in the rise of political instability.
If you believe all this to be true, then you must also believe that when QE is reversed and becomes Quantitative Tightening (QT), then those portfolio effects should also turn. This year, we have already seen sovereign bond yields around the world starting to rise, helping risk-averse investors achieve their income targets without taking so much credit risk. This has led to the “yield tourists” in higher yielding asset classes starting to move back up the quality curve, pushing risk premia upwards, lifting borrowing costs and dragging down the price of risky assets.
So far, QT has mainly been a feature of US monetary policy and the Federal Reserve’s balance sheet: the central bank’s holdings of US government bonds, mortgage-backed securities and other assets is expected to shrink to around $3 trillion in two years’ time, from a peak of over $4 trillion between 2015 and 2017. Whilst the Fed is not actively selling bonds, the absence of its market presence as an ongoing bond buyer is highly relevant, especially at a time when supply is only set to increase. US President Trump’s tax cuts and the ongoing increases in fiscal burdens caused by an ageing population mean that we will see budget deficits of well over $1 trillion per year for the foreseeable future. So, more bonds are coming to market, but the biggest buyer has gone.
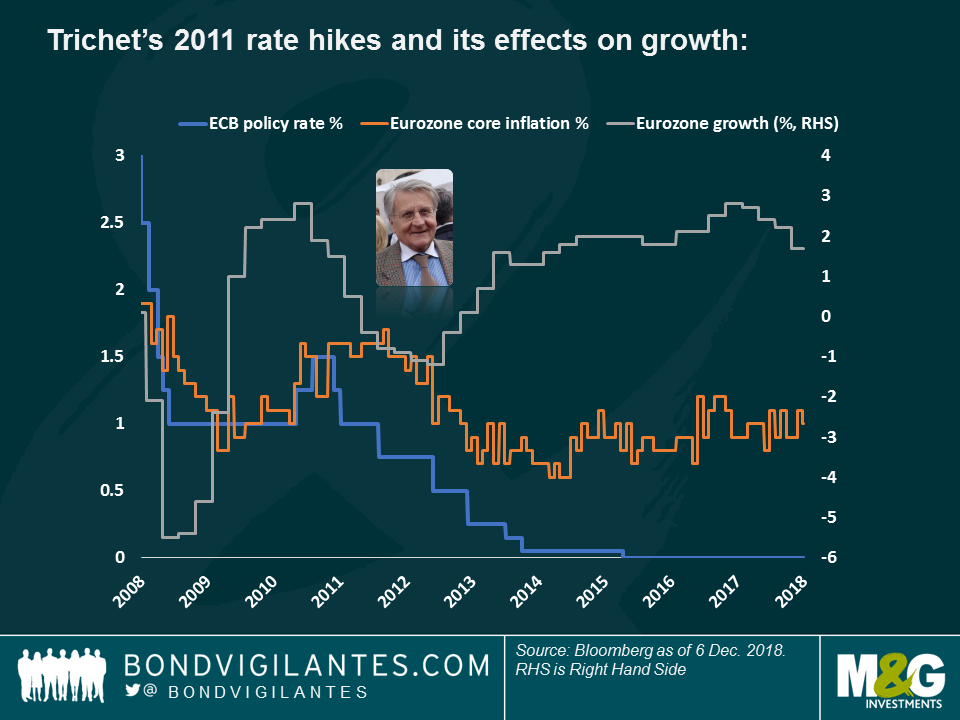
The European Central Bank (ECB) is also starting to exit QE, first by reducing its monthly bond purchases, and then by cutting them altogether by the end of this year. This is set to happen despite the turbulence in Italian bond markets (the BTP 10-year yield hit 3.68% in the final quarter of this year on fears over Italy’s future in the Eurozone and the country’s debt sustainability), and also despite a stubborn core inflation rate stuck at around 1%, well below the ECB’s 2% target. Could ECB President Mario Draghi be about to make the same mistake as his predecessor Jean-Claude Trichet in 2011, when he tightened monetary policy too early (blue line), putting brakes on a fragile economy (grey line) whose only inflationary pressures came from higher oil prices (orange)?
We fear Main Street may soon start feeling the QT pain, as Wall Street started doing so this year. But first, some good news: most corporate issuers took advantage of generationally low interest rates to borrow cheaply, and at long maturities. This means we don’t need to worry too much about an imminent “wall” of maturing corporate bonds, as companies have extended debt maturities, delaying the moment in which they seek capital to refinance their debt, typically at much higher interest costs. Also, according to Fed Chair Jerome Powell, rates may not be too far from their cycle highs.
“Interest rates are still low by historical standards, and they remain just below the broad range of estimates of the level that would be neutral for the economy,” – Jerome Powell, 28 Nov. 2018 (retracting from a month earlier assessment, in which he said that rates were “a long way from neutral.”)
But higher rates do matter now (perhaps a factor in Powell’s rhetoric change): the US 30-year mortgage rate hit 4.8% recently, up from 3.3% in 2016. Whilst most existing homeowners, like corporates, will have locked in those cheap rates, new borrowers face costlier loans, and this is already having an impact: US housing and real estate data is surprising to the downside at a rate that exceeds that seen even in 2008 and 2009:
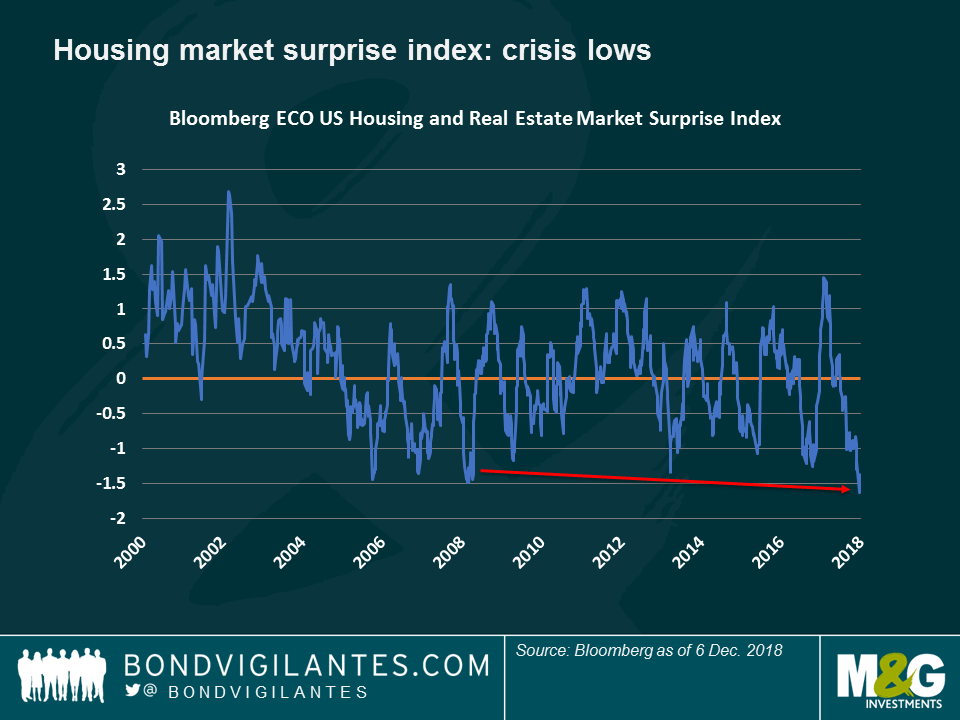
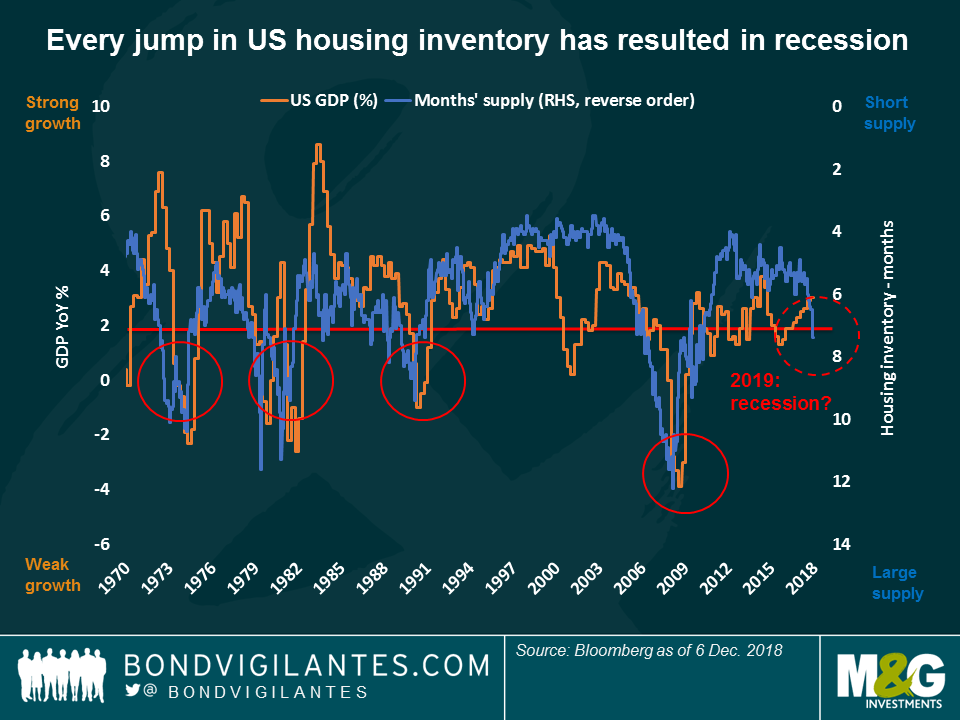
Housing is REALLY important to the economy. The “multiplier” effect of a house being built is significant as it is a labour-intensive industry; also, when you buy a house you also purchase white goods like fridges and freezers, TVs and furniture – and often a car (more on autos later). To assess the impact of the housing market on the economy, our favourite chart in 2007 showed the relationship between housing inventories (unsold new homes measured in months’ worth of supply) and US GDP growth. Whenever you saw the supply of unsold homes reach 7 months, a recession followed. It certainly did in 2008, despite the consensus of economic forecasters believing that economic growth would be 2.4% – it was actually negative. Why should we worry now? Well, the supply of unsold new homes is… 7.4 months (blue line).
As for autos, a bellwether of consumer confidence, the picture isn’t pretty, either. There are many reasons for global car sales to be falling: new emission standards, diesel scandals, tariffs, the rise of Uber/car sharing and the deferral of electric car purchases ahead of infrastructure upgrades. Still, the degree to which car sales is falling is shocking, at -10% per year. Reality is starting to bite: General Motors, for instance, recently announced US plant closures and nearly 15,000 job cuts.

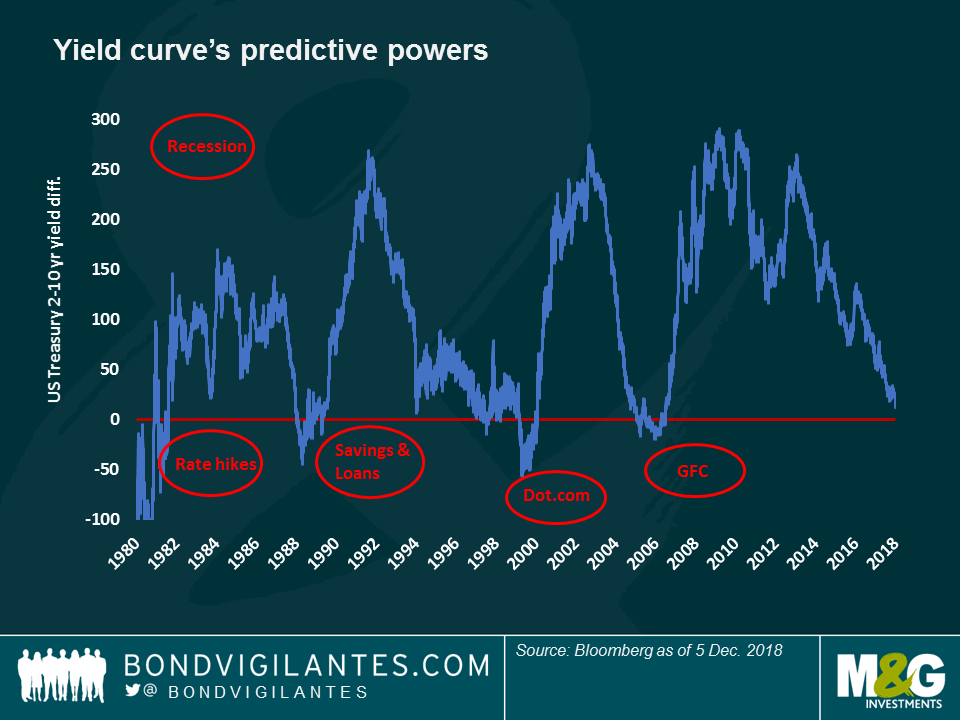
Reflecting this gloomy scenario, we have the one indicator that is really getting people worried: the shape of the yield curve. Traditionally, healthy-looking yield curves are upward sloping, with yields on long-dated bonds higher than those with short maturities, reflecting a premium for uncertainty (future inflation shocks or a fiscally irresponsible government, for example). But when the yield curve flattens and even inverts (with long bonds yielding less than shorter-dated ones), this is usually a harbinger of an economic slowdown as it reflects lower confidence in the future. In fact, there are virtually no incidences of an inversion not being followed by a recession, which in part explains why equity markets fell by 3% on December 4th, just as 5-year Treasury yields slipped below those at 2 years. When long-dated bonds yield less than short-dated ones, the bond market is predicting that interest rates will need to be cut by the central bank because recession is coming.
Are we therefore near the peak of the Fed hiking / tapering cycle? If so, you might think that 2018’s sell-off in almost all asset classes might be nearly over, and that there is value in both government bonds and credit. But for the latter there might be an economic slowdown to navigate first.
High yield (HY) has done particularly well since the aftermath of the 2007-08 financial crisis (except in 2015, given the plunge in oil prices). The asset class has benefited from the so-called Goldilocks scenario, in which growth is strong enough to fuel earnings, but not so much to force interest rates significantly higher. This has kept default rates low, at a time when the yield-tourists were happy to go down the capital structure in order to lock in good income.
This, however, started to turn this year as 2-year Treasuries yield 2.7%, with little risk, making Non-Investment Grade businesses less attractive on a risk-adjusted basis. Markets have been merciless: US HY spreads, for instance, have widened more than 100 bps in barely two months. Still, the asset class is one of the very few sectors in the black this year, largely supported by a sharp reduction in supply: as interest rates have gone up, companies have flocked to the leveraged loan market, a cheaper form of finance. The move has also been welcomed by investors, happy to receive a variable interest rate in a rate-rising environment – and also happy to seemingly ignore the deterioration in lending standards and the weak covenants attached to those loans.
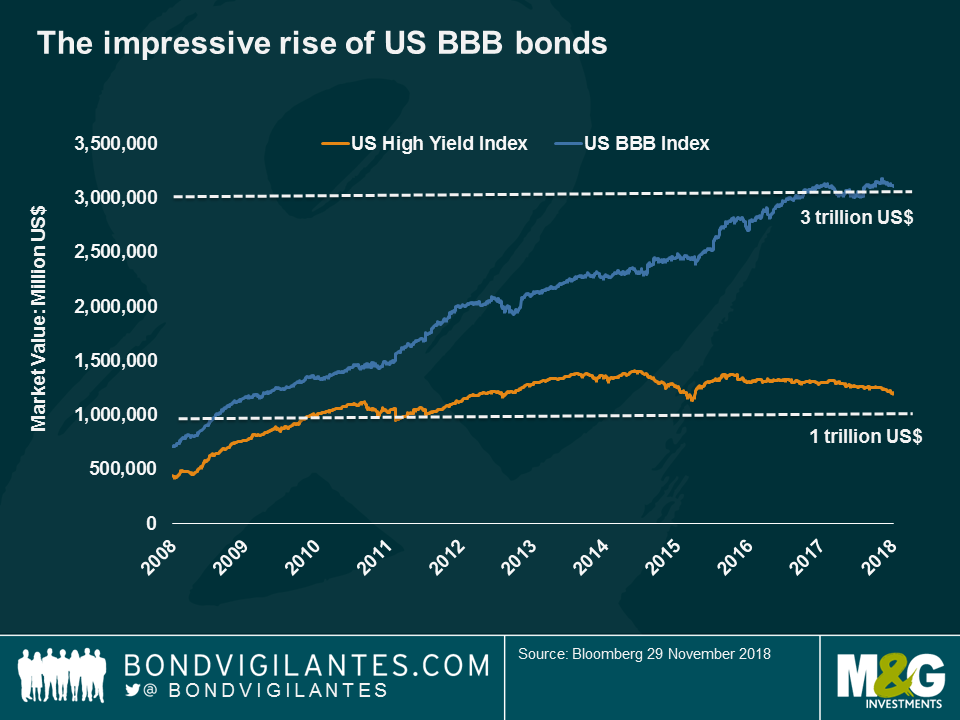
If short supply has helped HY, the opposite has dragged down US Investment Grade (IG) corporate bonds so far this year: a decade of cheap money has helped US IG companies issue billions of dollars worth of debt, often used to increase dividend payments or buy-back their own shares, enhancing equity prices. The market value of the IG rating bucket just above junk, or BBBs, has actually swollen to $3 trillion, more than twice its level a decade ago. It is now almost three times the size of the entire US HY market, raising concerns about the effect of potential downgrades in the HY universe.
One credit area, though, that has traditionally benefited from rising rates is banking, as financial institutions borrow short-term money in order to make long-term loans, so rising rates can boost their profit margins. Banks have also better capitalised balance sheets, following more and tougher regulation after the Financial Crisis – once compared to casinos, some banks look and trade now more like utilities. Banks could also benefit from what it is still a positively-growing global economy. Valuations might be more attractive in Europe, as the ECB’s QE programme has only bought traditional non-financial bonds, leaving bank debt with relative high yields per a given credit quality.
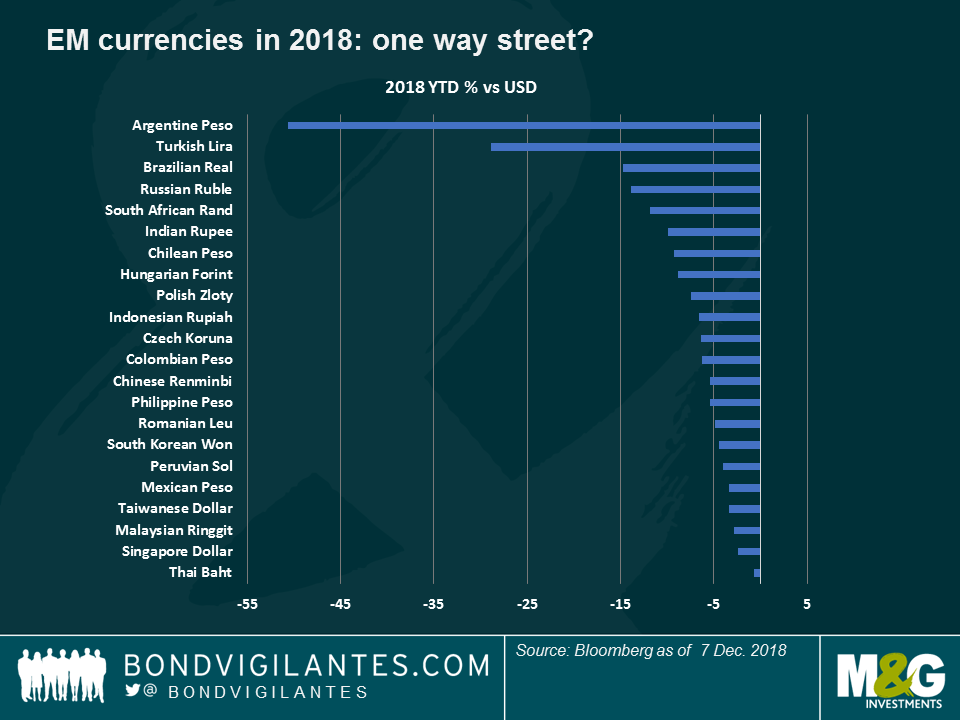
If we are looking for growth, Emerging Markets (EM) seem to be enjoying more of it than Developed Markets, and are forecast to continue doing so. EMs may also be more attractively valued going into 2019, following a poor 2018, when they have been hit by a rising dollar, the ongoing trade wars, a slowdown in China and idiosyncratic stories in Turkey and Argentina. Nobody knows what 2019 will bring, as some of the headwinds that shook the asset class in 2018 are still prevalent, including the trade tensions that could hinder global growth. However, and much to EM’s relief, dollar strength might be contained by an increasing US Budget deficit and a potential slowdown in US growth.
The one thing that seems certain is that volatility is here to stay – but that brings opportunity. We saw in 2018 how Brazil’s election substantially lifted the Real and reduced the country’s bond yields. Next year may bring us further opportunity, with scheduled general elections in India, Argentina, South Africa, Ukraine and Nigeria. Following this year’s sell-off, with some EM currencies down 20% or more, valuations are more attractive.
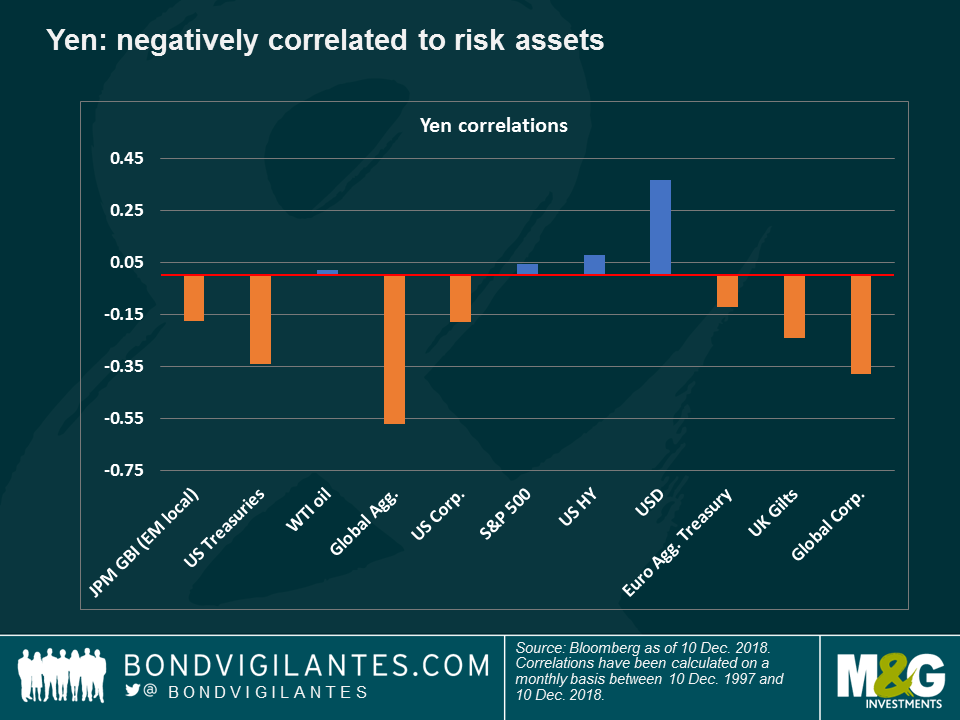
The one currency that has (just about) held its value against the dollar this year is the yen. Despite the country’s fragile economy and the central bank’s multi-billion yen stimulus, the currency has continued to offer certain protection to investors – either because of valuation, its safe-haven status, or because of the diversification that it offers to US and European investors. As seen in the chart, the currency has low correlation to not only risk assets, but also a negative correlation to the Bloomberg Barclays Global Aggregate Index, the bellwether of fixed income markets. This year, for instance, the yen strengthened against the US dollar from mid-July to mid-August, during the peak of the Argentinean and Turkish turmoil that hit EMs and credit markets.
All in all, there are few presents from Santa this Christmas after some major repricing across asset classes, which could turn into opportunities for value-seeking, long-term investors in 2019. Until then, our best wishes to our readers for this Christmas and the New Year – may it bring you positive surprises, of the kind not tracked by any index.
Historically, the relationship between wage inflation and unemployment has been strong and is famously revealed in the Philips curve. However, this relationship has broken down over the past decade, causing much head-scratching among economists and central bankers: in the US, wages have failed to significantly rise despite a five-decade low unemployment rate and strong economic growth; in Britain, the present 4.1% unemployment rate is at the lowest since Brian Clough became Nottingham Forest manager in 1975 – yet, annualised consumer inflation has dropped this year from 3% to the present 2.4%. To cast some light on this puzzling question, former Bank of England MPC member and Dartmouth College professor Danny Blanchflower and colleague David Bell have come out with a different view.

According to the two academics, it is not unemployment what really has been driving wage growth since the GFC, but underemployment – or the willingness of current workers to increase their working time without getting more money.
Why are people willing to work more for free? Some attribute this to the decline of unionism and globalisation, but these trends have been going on for some time. A more probable and recent reason, the academics argue, is home ownership rates, which started declining in 2004 at a rate that only accelerated with the outbreak of the GFC in 2007. Renting a home, instead of owning it, seems to reduce workers’ bargaining power as they feel more unstable and hence, insecure. Tough news for workers as in the US, the home ownership rate has plunged to 63.9%, down from 69% in 2004; in Britain, it stands at 63.4%, down from an all-time high of 73.3% in 2007.
If markets are supposed to be mirrors of societies, the bond universe is certainly reflecting the world’s and the new generation’s increasing value for health. “Peak smoking” in the US was in the 1960s, when an adult smoked an average of over 11 cigarettes per day. That has fallen to 4 and continues to decline. Tobacco firms have been hit for years as falling consumption and tougher regulation hit sales and margins, but this year they are also facing new pressure from authorities keen to ban some of their most popular flavours. As bond investors embracing Environmental, Social and Governance (ESG) criteria, we also have seen increased interest from clients in excluding tobacco bonds from portfolios. Could these hard exclusions of cigarette companies be about to become mainstream for bond investors?
Well, at last it has happened. Ten years after the global financial crisis began, we have reached a place where synchronised global economic growth is more than just a pipe dream and the prospect of central banks moving away from their extraordinary ultra-loose monetary policy stances of the last decade is finally a reality.
There has been much excitement in recent months about the robust and broad-based nature of global economic growth. However, this is not to gloss over the risks that remain. Chief among these is inflation (or the lack thereof). With the notable exception of the UK, where sterling post-Brexit referendum weakness has pushed the Consumer Prices Index as high as 3% in recent months (see box on Brexit), there have been more column inches devoted to softening than hardening inflation trends (see box on inflation).
Despite the solid performance of the US economy, inflation there has remained weak. Indeed, outgoing US Federal Reserve chair Janet Yellen has described 2017’s low inflation as a mystery. Bond investors are split into two camps: does this weakness reflect temporary factors, or is there something more structural going on? If it is the latter, the Federal Reserve should be worried as there is little that monetary policy can do to combat deflationary forces like globalisation, demographics and technology improvements.
I think the arguments suggesting that the recent low inflation numbers reflect transitory factors and some positive supply-side developments look valid. For example: the increase in healthcare costs following the introduction of Obamacare has been lower than expected, while the introduction of unlimited data plans by cell phone providers has shown up in the official statistics as a sharp decline in prices. Looking ahead to 2018, a tight labour market should foster wage growth, while the potential for lower corporate tax levels could encourage higher domestic and international investment.
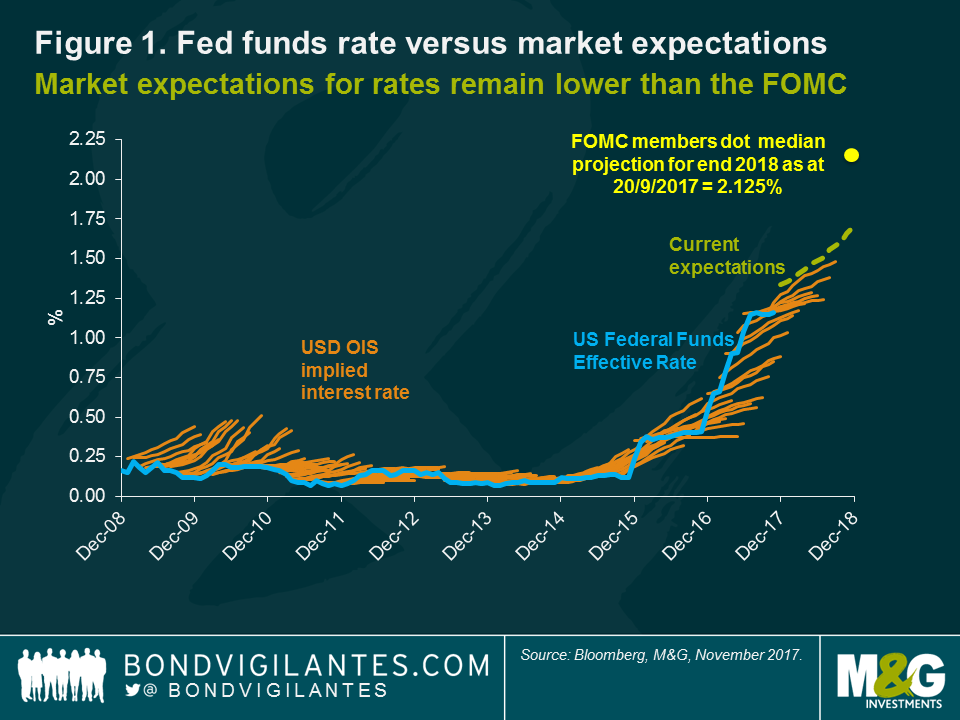
I expect the Federal Open Market Committee (FOMC) under new chairman Jerome Powell to continue to normalise rates gradually in 2018. Market pricing suggests a similar view, though expectations for the Fed Funds rate at the end of 2018 are around 50 basis points lower than the FOMC dot median projection would suggest (Figure 1).
The value of investments, and the income from them, will fall as well as rise and you may not get back the original amount you invested.
President Trump confirmed in November that Jerome Powell will replace Janet Yellen as Chair of the Board of Governors of the Federal Reserve from February 2018. So what can we expect from the 16th chair of the Federal Reserve – the first non-economist to lead it since 1979? While Powell’s background differs from the norm, his policy stance is not expected to. The muted bond market reaction on the day of the announcement underlines his status as the status-quo pick. Had alternative candidates John Taylor or Kevin Warsh been appointed, the bond market may have sold off in anticipation of a more aggressive Fed hiking cycle and a faster QE taper than Yellen and the current Board – of which Powell forms part of – have implied. Indeed, 2017 marked Powell’s fifth year on the Board of Governors and in that time he has proven to be supportive of gradual interest rate hikes, voting consistently as part of the Yellen-led consensus.
Given Powell’s corporate background, however, it’s not a stretch to surmise that he may be more partial to lighter-touch financial regulation (something that Trump has long been an advocate of) than some of his predecessors. For example, with respect to the Volcker Rule (governing banks’ ability to speculate with retail deposits), Powell stated in a speech in October that “there’s a lot of room to address the burden” and that in terms of regulation “we can do it more efficiently”. This may have been noted by the market: since the announcement of Powell’s appointment, US swap spreads in the long end, though still negative, have moved back towards positive territory, suggesting that the market may have started to price in the prospect of an easier regulatory environment.
Europe’s broad economic growth was the surprise of 2017. Many business activity indicators are near record highs, consumer confidence is very strong, and the third quarter’s growth rate (2.5% yoy) was the strongest for 10 years. Challenges remain, such as the level of bad debts in the Italian and Spanish banking systems, but even these are starting to show signs of improvement.
The European Central Bank (ECB) under Mario Draghi can rightly claim a significant contribution to this turnaround. Its extremely easy monetary policy stance has allowed the financial system to heal and has given businesses and consumers confidence to invest and spend. Importantly, the ECB has given guidance that it will retain a very easy monetary policy stance, announcing an extension of quantitative easing (QE) until September 2018, at a reduced level of €30 billion a month. As in the US, 2017 inflation levels have been stubbornly low, and there is currently little evidence of a return towards its target of close to, but below, 2.0%.
In November, the Bank of England’s Monetary Policy Committee (MPC) reversed its emergency rate cut undertaken in the wake of the Brexit referendum with what can be described as a “weak hike”. This may prove to be a one-off adjustment. The rate rise is difficult to justify given the continued political uncertainty that surrounds Brexit and the slow progress of UK-European Union (EU) negotiations. We expect to see more signs of slowing investment, falling consumer confidence and economic weakness unless a material agreement or transitional deal can be reached on the future UK-EU trading relationship – discussions on which can finally get underway after the two sides struck a last-minute deal on the first ‘divorce’ phase of negotiations in early December. The MPC, however, clearly has a different view and is worried that there is limited spare capacity in the economy that may lead to higher wages and above-target inflation. The good news is that this single rate rise of 25 basis points will have a limited effect on the real economy. Monetary policy remains highly accommodative, real interest rates are negative, and the Bank’s balance sheet is still large.
The world’s fourth-largest economy, Japan, is currently experiencing its second-longest economic expansion since World War II, having grown for seven successive quarters. As in Europe, the Bank of Japan is pursuing ultra-easy monetary policy and has committed to overshooting its 2% inflation target. As a result, it is unlikely that the Bank will alter its current stance of setting the short-term interest rate at -0.1% and 10-year Japanese government bonds at around 0%.
In China, the People’s Bank of China (PBoC) will look to mitigate systemic risks, suggesting a monetary policy tightening bias in 2018. The emphasis at 2017’s Party Congress (an event that occurs once in five years) on the quality of economic growth means continued policy efforts on leverage controls and tightening in the housing sector, which could weigh on public and housing investment. That said, growth looks to be becoming more self-sustaining, with robust consumption and external demand. I expect that China will continue to contribute meaningfully to both global as well as emerging market economic growth in 2018.
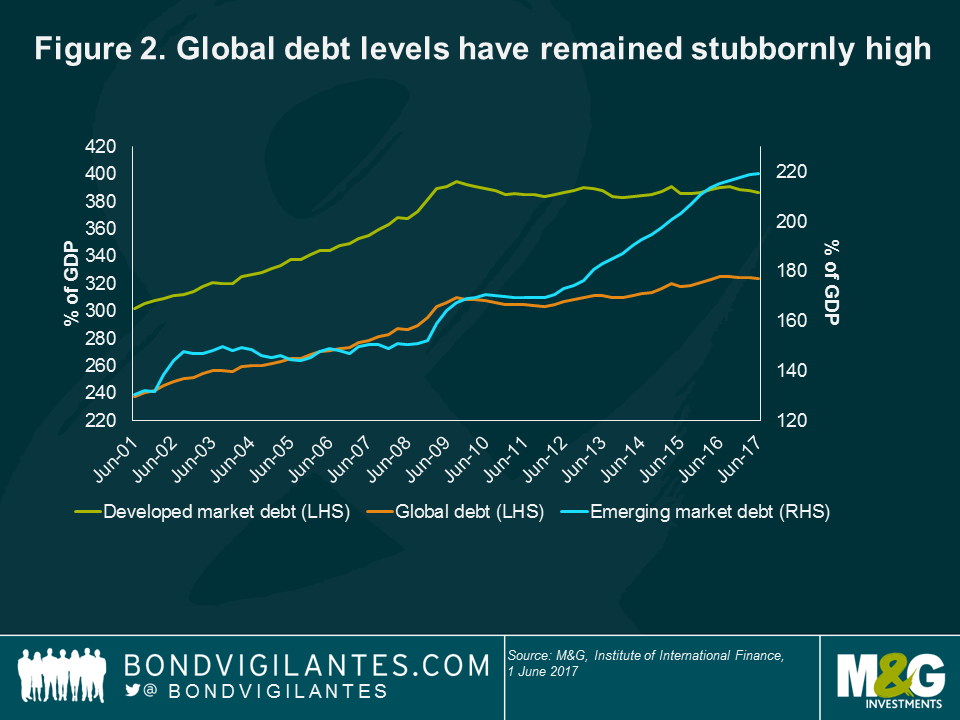
Many economists have attributed the slow pace of growth that we have seen during the economic recovery to a global deleveraging cycle aimed at reducing debt levels from what appeared to be unsustainable levels. So 10 years after the global financial crisis (as well as a European debt crisis and an oil crisis), where are we within this global deleveraging cycle?
Figure 2 shows global debt levels in recent years across the largest developed and emerging economies. After peaking in 2009, total debt levels declined slightly before rising once again to a level of 324% of world gross domestic product (GDP) today. It also shows that while we have been experiencing a mild deleveraging cycle in the developed world over the past 10 years (primarily due to deleveraging in the banking sector), most of the recent increase in global debt levels has come from emerging countries (Chinese state-owned enterprises being an important contributor, for example). This unabated increase in global debt levels means that – all else being equal – peak interest rates for this economic cycle in most developed countries are likely to be lower than they have been in the past.
Another key metric in the sustainability of global debt levels is the average interest rate paid on that debt. In this regard, the ultra-loose monetary policies that we have seen in most of the developed world have provided a bit of respite for many governments’ debt levels. Figure 3 shows that five years of nil or negative ECB deposit rates have significantly helped Europe’s ‘peripheral’ countries reduce the cost of servicing their public debt. Spain, for example, has been able to reduce the average coupon that it pays on its debt from about 4.5% three years ago to around 3.4% today.
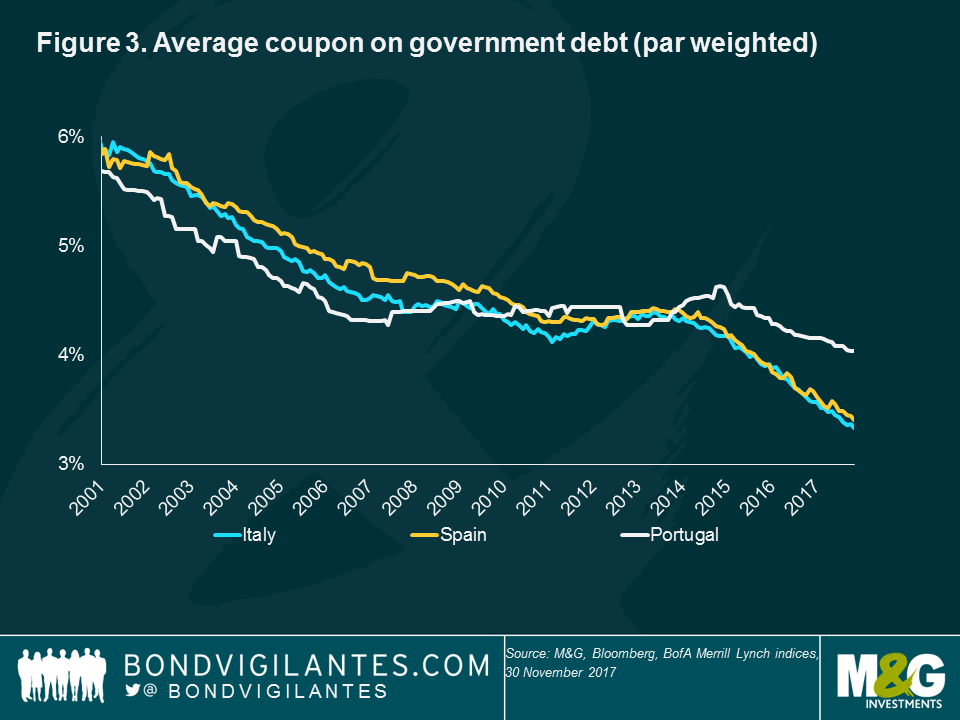
Assuming that the ECB’s QE programme will keep government bond yields low, we expect the cost of Spain’s debt to decline further during 2018. Its government has also taken advantage of low rates to increase the average maturity of its debt from 7.5 years in 2012 to around 9 years today – helping insulate it from future rate hikes or yield spikes.
Equally, the type of debt, such as fixed or floating rate coupons, must also be taken into account. The US household sector is arguably far less sensitive to higher interest rates than in the UK, as most mortgages in the US are priced off long-term fixed rates.
The fact that the Fed will need to keep raising rates to tighten monetary policy further is reflected in the adjustment that we have seen in 2017 in 2-year Treasury yields, which increased from 1.1% to around 1.8%. What is more surprising is that longer-term government yields have been extremely resilient: 10-year Treasury yields will end 2017 at around the same levels as they started. This combination of rising short-term yields and stable long-term yields has caused the US Treasury curve to flatten quite considerably in 2017 (Figure 4).
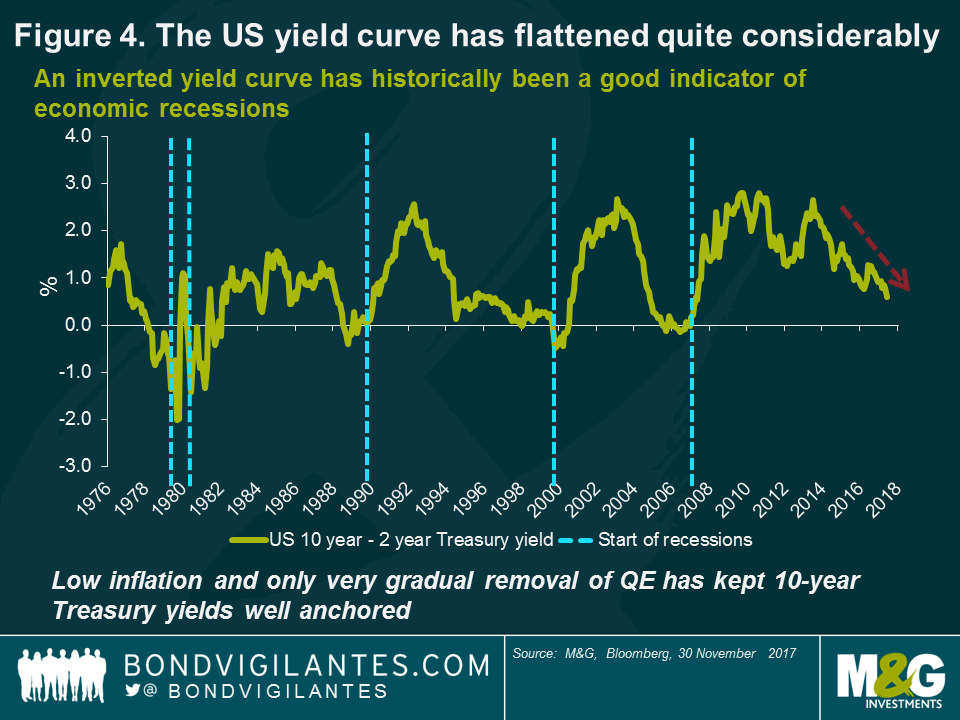
Historically, a flattening yield curve suggests an economic downturn (the yield curve inverted before each of the last seven US recessions). Given that the Fed could hike at least a couple more times in 2018, the curve could indeed become inverted if longer-term yields remain so well anchored.
So does the current shape of the yield curve signal an imminent recession in the US? Not necessarily. The persistent high demand for long-dated government bonds has been due at least in part to other important structural factors, such as slower productivity growth, lower inflation levels and an ageing world population. From a more technical perspective, the very gradual unwinding of the Fed’s balance sheet, the recent announcement from the US Treasury that it will sell more short-dated government bonds, and the purchase of longer-dated instruments by US corporations to pre-fund their pension liabilities in anticipation of tax reforms have probably also accelerated the recent yield curve flattening movement.
Given that these technical influences may lessen, and that the closing of the global output gap could also lead to higher inflation, we believe there could be downward pressures on long-dated US (or even UK or European) government bond prices in the months ahead. For these reasons, we continue to find many long-dated government bonds rather expensive at current levels.
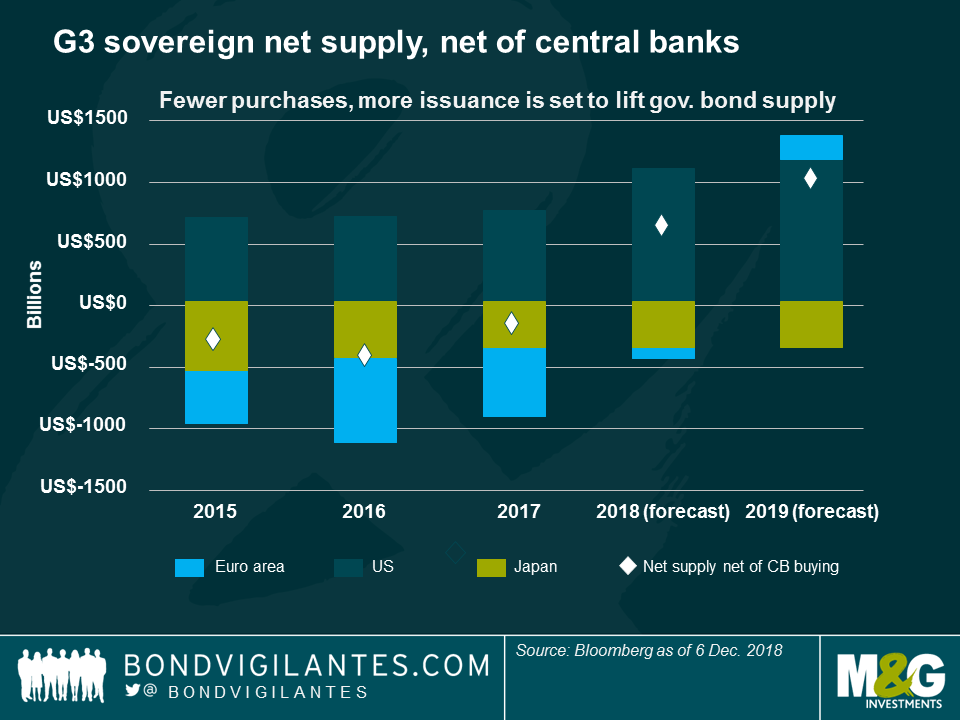
It may be a continuation of the status-quo with a Powell-led Fed, but that doesn’t mean it’s more of the same. Balance sheet reduction and the great QE taper are set to take centre stage in 2018.Almost 10 years to the day of the onset of the global financial crisis, the Fed announced its process of balance sheet normalisation, committing to gradually reduce its balance sheet by US$10 billion per month (split 60/40 between US Treasuries and mortgages). From January 2018, the monthly reduction doubles to US$20 billion. The Fed-imposed limits will continue to increase every three months, until the total monthly reductions reach US$50 billion in Q4 2018.The technicals are changing. After years of central bank demand for Treasuries, 2018 is the first year in a long while when technical support for US Treasuries may waver, as net supply effects kick in (see chart).
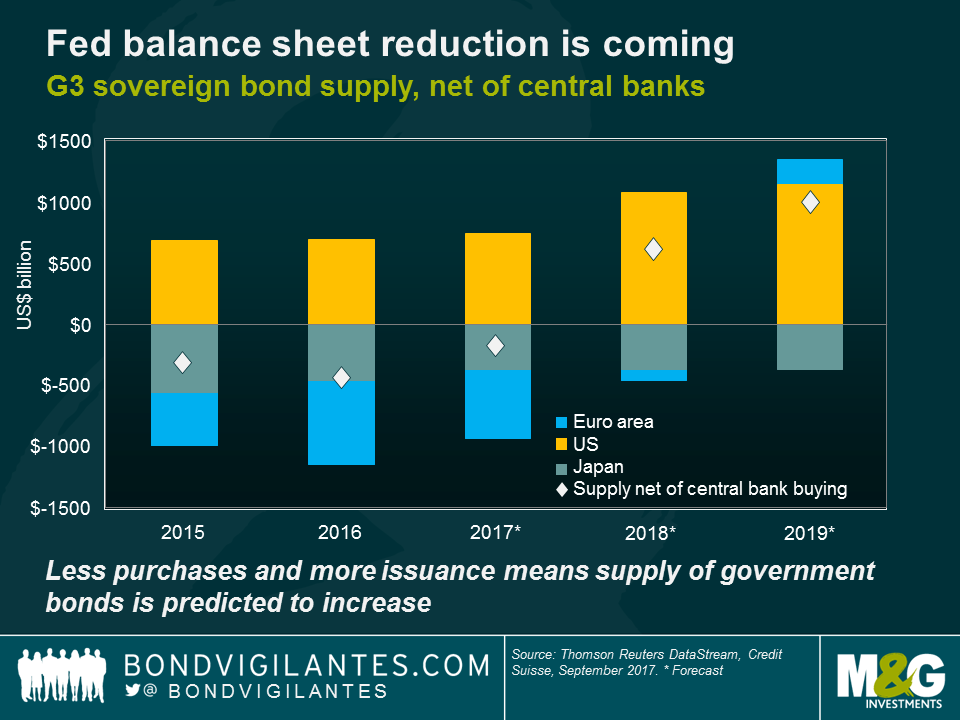
After years of shrinkage in net G3 government bond supply (net of central bank QE purchases), QE tapering by both the Fed and the ECB means that 2018 will likely see more sellers than buyers of G3 government bonds. The implications are clear: the days of record low government bond yields may well be behind us. If QE reduced government bond yields on the way in, the opposite may well prove true on the way out.
The quality of investment grade credit has seen significant deterioration in recent years. This has partly been voluntary, with companies believing that adding leverage to their balance sheets can enhance equity returns, but it also reflects the wider-scale credit downgrades that banks and financial institutions in particular experienced during and after the credit crisis. In 2000, for example, the US credit market contained a little over 30% in BBB rated securities (and the nascent eurozone credit market just under 10%). This has risen significantly since the start of the millennium, to the extent that global credit markets are now almost 45% exposed to BBB rated issuers, and this is trending higher. As a result, today’s global credit market has a far riskier credit profile than a decade earlier.
This is particularly important in the context of today’s credit spread levels. If you were to look at the overall global investment grade universe spread level in isolation, you could be tempted to think that despite the rally in corporate bond prices in recent years, valuations are simply back to their long-term average. However, when you take the aforementioned deterioration in credit quality into account, the picture is less rosy. It suggests that global credit is now into expensive territory rather than fair value. Of course, some of the reasons that have caused this are valid: ECB bond-buying, still-low default rates and continued demand for income-producing assets.
In high yield, it remains an issuer’s market, with bondholders’ rights suffering further degradation over the course of the year. According to Moody’s, so-called HY-lite (bonds that lack fundamental investor protection) levels have been rising steadily in Europe since 2013, from a level of well below 10% to around one third of all bonds coming to market today.
There are few immediate warning signs, as companies still benefit from a favourable macroeconomic environment, in a world of synchronised global growth and benign financial conditions. Companies can continue to benefit from cheap refinancing conditions for the foreseeable future.
Nevertheless, to my mind, deteriorating credit quality, and lower rewards for taking risk have made credit (both investment grade and high yield) a far less attractive asset class in 2017 than in previous years. For these reasons, I have reduced my overall exposure to corporate bonds this year, although as ever, I will monitor the market closely going into 2018 for better buying levels.
After a nervous start to 2017, President Trump-related concerns for emerging market (EM) investors have broadly eased – the difficulties of getting things done domestically has constrained the president’s ability to do as much internationally as he may have initially hinted at. And in the event, sentiment towards the emerging bond markets has held up well in 2017. Optimism over improving (and synchronised) global economic growth has played a part here, as have firmer trends in commodity prices and China’s better-than-expected performance.
In addition, some topical risks started being ‘priced out’ of the emerging bond markets as the year progressed, including developed market political risks and worst-case scenarios in US/China relations (the US has not named China as a currency manipulator or embarked on a trade war).
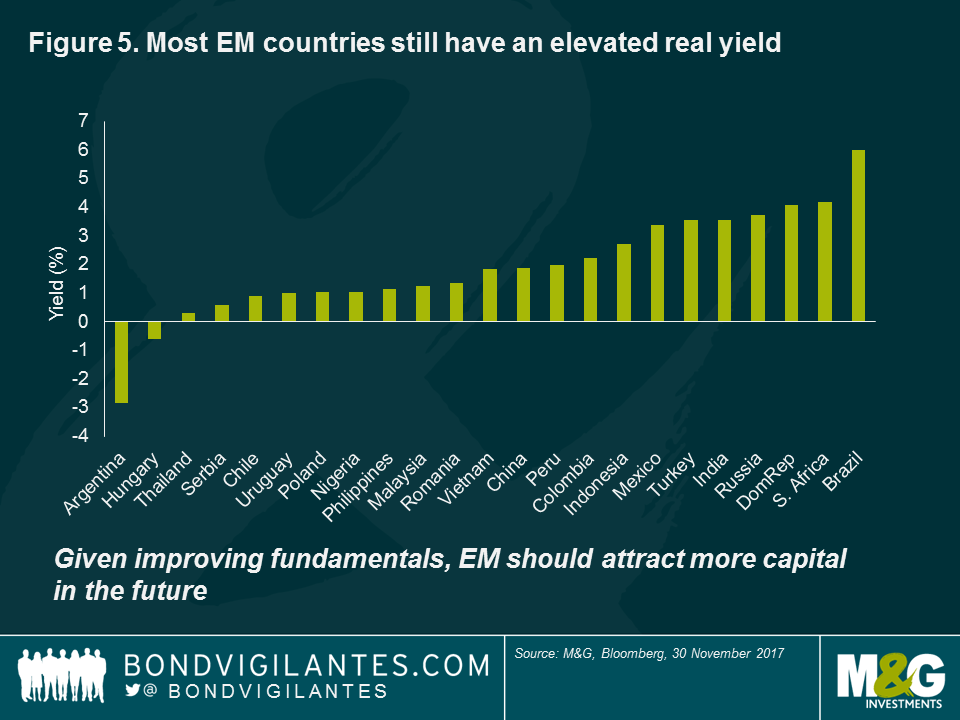
Emerging market fundamentals and valuations still look selectively attractive versus developed markets. Growth rates in many emerging economies exceed those in the developed world, for instance, while many also boast far lower debt-to-GDP ratios. Yields on both local and hard currency emerging market sovereign debt comfortably outstrip those on developed market government bonds.
As Figure 5 shows, high real yields underline the appeal in regions such as Latin America, where inflation is expected to fall in several larger markets, including Brazil and Mexico. However, I do remain concerned about the scale of China’s debt and, although a ‘hard landing’ is unlikely, we believe that tight spreads in the country’s bond market do not properly compensate for the risks.
More generally, the implications of higher US interest rates still need close attention. However, for many EM economies, the higher US rate environment is less challenging than in previous cycles, due to improvements in their current accounts, and lower overall levels of US dollar-denominated debt. That said, US rate increases could pose a headwind for certain emerging economies, particularly those more dependent on US dollar funding.
Absent the Fed falling behind the curve, my view is that EM debt markets can withstand slow and gradual US monetary tightening. Their high real yields should provide something of a cushion against further US hikes. A strengthening global economic outlook, meanwhile, also has favourable implications for the credit quality of EM bond issuers, as EM credit ratings actions typically correlate with growth rates.
The lack of inflation in the global economy (with the current exception of the UK for Brexit-specific reasons) despite near-record levels of employment in much of the developed world remains one of the great puzzles of the post-financial crisis world. Conventional economic theory suggests that a shortage of labour will drive up wages as companies compete for the dwindling supply of workers, in turn fuelling higher inflation. But there is little sign of this happening just yet.
Of course this is not a new phenomenon, with global inflation having been on a downward trajectory for the past couple of decades. Many theories have been put forward to explain this trend. An increasingly open global economy has undoubtedly had a major impact, with the availability of cheaper goods and services from China and other emerging markets helping to keep consumer prices lower. Another key theme centres around advances in technology and artificial intelligence. As well as driving down the costs of production, increased automation may also reduce the demand for human labour, potentially keeping wages lower.
The rise of the so-called gig economy – the part of the labour market consisting of short-term or temporary jobs – is another important trend which has been attracting a lot of attention in recent years. With uncertain working hours and limited rights compared to permanent employees, gig economy workers will typically have very little bargaining power when it comes to setting wages. The prospect of a 1970s style wage-price spiral – where heavily unionised workforces secure ever higher wage settlements – looks remote in this context.
While the politics surrounding Brexit has never been far from the headlines in 2017, something that has perhaps fallen under the radar is the economics. After the referendum, the UK economy initially surprised both economists and the market, with growth and consumer data staying robust into the end of 2016.However, the most recent Office for Budget Responsibility (OBR) forecasts make for dire reading. Where previously the OBR was expecting growth to hit a low in 2018 and pick up gradually thereafter, the figures published in November 2017 now project growth downgrades to all five years of the forecast period, with growth bottoming out two years later in 2020. Either way, gone are the days of 2% annual growth rates.
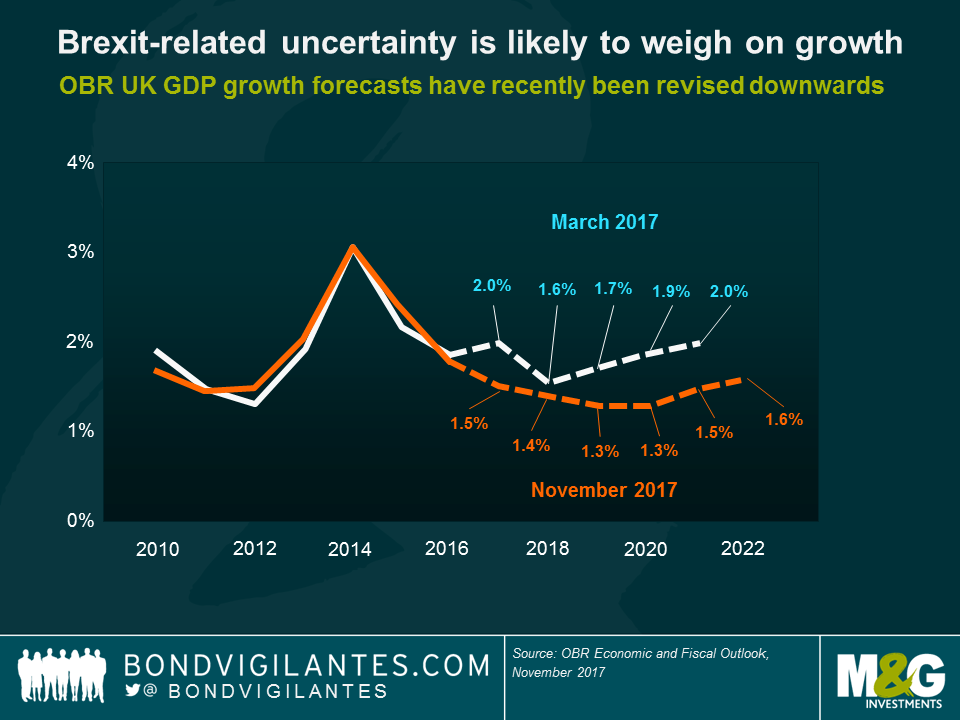
The growth downgrades come largely from the OBR’s revision to its productivity forecasts. After years of overestimating growth, assuming productivity would return to pre-global financial crisis annual trend growth rates of around 2%, this assumption has now been halved, with productivity growth now expected to average closer to 1% (adding a cumulative £91 billion to the forecast for public net sector net borrowing over the next five years).This adjustment makes no assumption of the ultimate UK Brexit deal, however, and with changing demographics and a shrinking working population, it’s entirely possible that these productivity downgrades may still prove too optimistic. Should the economy disappoint – or Brexit start to bite – the UK may have no choice but to relax its fiscal austerity stance, bringing the focus back to the UK’s credit rating (currently AA), debt burden and currency once again.
More than one-third of the way through the Brexit negotiation period, the two sides have finally limped to an agreement on the first phase of negotiations – the ‘divorce’ settlement. Now all eyes will turn to the status of the future trading relationship. Despite the still-uncertain outlook, one thing is becoming clearer: the fundamental outlook for the UK economy is not looking pretty.
This information is not an offer or solicitation of an offer for the purchase of shares in any of M&G’s funds. Distribution of this document in or from Switzerland is not permissible with the exception of the distribution to Qualified Investors according to the Swiss Collective Investment Schemes Act, the Swiss Collective Investment Schemes Ordinance and the respective Circular issued by the Swiss supervisory authority (“Qualified Investors”). Supplied for the use by the initial recipient (provided it is a Qualified Investor) only. In Hong Kong, this financial promotion is issued by M&G Investments (Hong Kong) Limited, Office: 16/F, Man Yee Building, 68 Des Voeux Road, Central Hong Kong; in Switzerland, by M&G International Investments Switzerland AG, Talstrasse 66, 8001 Zurich, authorised and regulated by the Swiss Federal Financial Market Supervisory Authority; in the UK, by M&G Securities Limited (registered in England, No. 90776) and, elsewhere, by M&G International Investments Ltd (registered in England, No. 4134655). Both M&G Securities Limited and M&G International Investments Ltd are authorised and regulated by the Financial Conduct Authority in the UK and have their registered offices at Laurence Pountney Hill, London EC4R 0HH. M&G International Investments Ltd also has a branch located in France, 6 rue Lamennais, Paris 75008, registered on the Trade Register of Paris, No. 499 832 400 and a branch in Spain, with corporate domicile at Calle Fortuny, 6 – 4º A, 28010, Madrid registered with the Commercial Registry of Madrid under Volume 32.573, sheet 30, page M-586297, inscription 1, CIF W8264591B and registered with the CNMV under the number 79. For Hong Kong only: If you have any questions about this financial promotion please contact M&G Investments (Hong Kong) Limited. The Portuguese Securities Market Commission (Comissão do Mercado de Valores Mobiliários, the “CMVM”) has received a passporting notification under Directive 2009/65/EC of the European Parliament and of the Council and the Commission Regulation (EU) 584/2010 enabling the fund to be distributed to the public in Portugal. M&G International Limited is duly passported into Portugal to provide certain investment services in such jurisdiction on a cross-border basis and is registered for such purposes with the CMVM and is therefore authorised to conduct the marketing (comercialização) of funds in Portugal. For Singapore: for Investment Professionals and Institutional Investors only.
Whether you call it ‘Green’, ‘Responsible Investing’ or ‘ESG’ (environmental, social and governance), there is no doubt that it is now a firmly established part of the investment landscape, having evolved from something of a niche interest to a mainstream concern in the space of just a few years. Growing awareness of a range of environmental and social issues has seen an ever larger number of investors move their focus away from purely financial goals towards an approach that also considers the social and environmental impact of their investments.
Over the coming years, we think the interest in responsible investing only looks set to grow, with millennial investors, in particular, likely to be a key long-term driver. While responsible investing has proved increasingly popular with investors of all ages, it is the millennial generation (broadly defined as those born between 1982 and 2000) which has shown the strongest enthusiasm for this form of investment.
According to research carried out by M&G and The Wisdom Council1, 9 out of 10 ‘millennials’ said they were interested in socially responsible investing and wanted to know more. Millennials were also twice as likely (64%) than investors over 55 (29%) to invest in a fund if social responsibility was part of the thesis.
While the overall earnings power of millennials is still in its early stages, the wealth and influence of this generation is expected to grow significantly over time. Millennials are set to become the largest demographic in the US over the next few years and, over the coming decades, are expected to inherit trillions of dollars’ worth of assets from the wealthy ‘Baby Boomer’ generation. In this context, we think millennials will become an increasingly powerful driver of the demand for responsible investments.
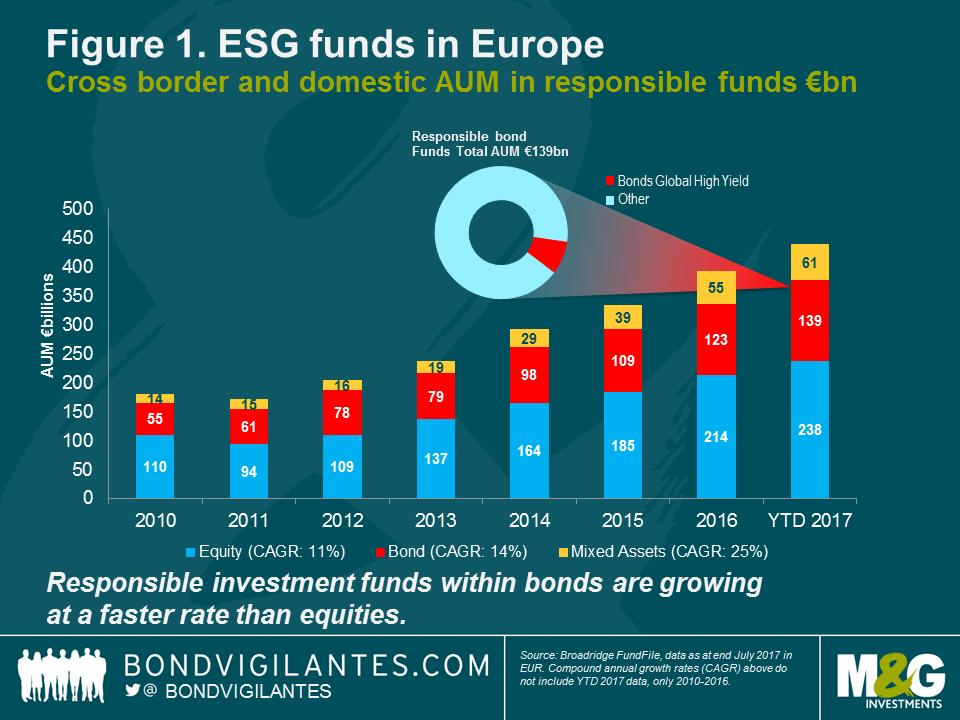
Indeed, this shift in perceptions and priorities is already manifesting itself in assets, especially in Europe, where ESG assets under management (AUM) have increased from €180 billion in 2010 to €438 billion as at 31 July 2017 (see Figure 1).
A notable development has been the growing number of ESG bond funds available to investors. While ESG equity funds still represent the majority of AUM, bond funds are quickly catching up, having grown at a faster rate than ESG equity strategies since 2010, measured using a compound annual growth rate.
Consequently, responsible investing will be a major growth area for both bond investors and the fund management industry alike.
There are, however, three key questions that need to be answered:
In this paper, we take a cross section of ‘responsible investing’ approaches and consider how they may or may not work within the context of a global high yield bond portfolio.
Fixed income assets make up a considerable proportion of most investor portfolios. However, while bond funds now represent a sizeable portion of the ESG universe, these are predominantly focused on investment grade issuers, with high yield bond funds accounting for only a fraction of assets under management.
One potential reason for this is that the high yield market does not easily fit in with ‘off-the-shelf’ ESG methodologies. Table 1 outlines some of the most common ESG approaches and considers their suitability from a high yield perspective:
Table 1. Some common ESG approaches
| Description | Pros | Cons | |
| ‘Norms’-based screening | Excludes companies that are assessed to be in breach of widely accepted principals, such as the United Nations Global Compact principles on human rights, labour, environment and anti-corruption. | Broad acceptance by the investment community. Compliance has limited impact on the investible high yield universe. | Punishes purely by exclusion – limited scope for positive engagement. No flexibility to deviate from principles laid down – a ‘one-size-fits-all’ framework. |
| Negative screening (sector exclusion) | Excludes companies whose revenues are derived from specified sectors, such as tobacco, gambling or weapons. | Simple to apply and align with client preferences. | Fails to consider companies outside specified sectors that display poor ESG credentials. Subjectivity in terms of deciding which sectors should be excluded – eg, is nuclear energy good or bad? |
| Negative screening (exclusion of industry laggards) | Excludes companies that are deemed to have poor ESG credentials based on an in-depth assessment of a range of ESG factors. | Provides a more comprehensive and sophisticated analysis of a range of ESG factors. | Requires complex analysis and a robust and comparable ESG scoring methodology. |
| Positive screening –‘best-in-class’ approach | Focuses on companies that are deemed to have the strongest ESG credentials based on an in-depth assessment of a range of ESG factors. | Explicitly rewards industry leaders and creates a more positively aligned portfolio | Implementation would leave a very limited choice of high yield names, compromising diversification and implementation of investment-driven views. |
| Green bonds | Issued by governments or companies to raise finance specifically for “green” purposes, such as clean energy plants or energy efficiency projects. | Targets specific projects designed to make a positive environmental impact. Funds are usually ring-fenced and only used to fund the specified project. Self-selecting universe, easy to define. | Very small, concentrated universe of high yield issuers with high idiosyncratic risks. ‘Green’ designation can be somewhat subjective and inconsistent. |
| Impact investing | Covering a range of asset classes, impact investments are designed to solve social and environmental challenges. | Highly tangible. Provides capital for businesses or projects looking to make a positive ESG impact. | Opportunities tend to be illiquid, private and project-based. Can be challenging for a diversified open-ended investment vehicle offering daily liquidity. |
Responsible investing has evolved significantly over the past decade and today covers a variety of related but distinct strategies.
An ESG approach which has gained broad acceptance is the ‘norms’-based screen. This excludes companies that have failed to meet internationally accepted standards, such as breaching the United Nations Global Compact principles on human rights, labour, environment and anti-corruption. A ‘norms’-based screen ensures the removal of companies that have been judged to be in breach of these standards, although this approach only captures approximately 2% of high yield companies so does not provide a comprehensive ESG approach in itself.
Another common approach is to remove companies whose revenues are derived from specific industries, such as tobacco, gambling or weapons. This is an example of negative screening, which seeks to remove companies whose activities are considered to be harmful to society. A sector exclusion approach is easy to implement and to align with client preferences. However, while a good starting point, this approach again has quite a narrow focus. There is also a degree of subjectivity in determining what sort of activities should be considered harmful – nuclear power being one such example of an industry that often divides opinion.
ESG integration offers a more comprehensive approach whereby ESG factors are incorporated into the overall investment decision-making process. This involves a sophisticated analysis of a wide range of complex issues, which might cover everything from energy efficiency and pollution to working conditions and product safety. ESG integration enables companies to be assessed using a robust and comparable ESG methodology. According to our estimates, around 20% of high yield companies would be classified as industry laggards displaying poor ESG credentials.
Positive screening is a ‘best-in-class’ approach, which seeks to identify companies demonstrating leadership on social and environmental issues. This is a more proactive approach to ESG investing which explicitly rewards the industry leaders. However, from a high yield perspective, this approach leaves a very limited choice of issuers, compromising diversification and the implementation of investment-driven views. Based on ESG assessments provided by MSCI, around 20% of companies in the global investment grade market qualify as ESG industry leaders (those with AAA or AA ESG ratings) (see Figure 2). In comparison, only 5.6% of the high yield companies have an ESG rating of AAA or AA which would lead to material adverse implications, in terms of portfolio diversification and concentration risk.
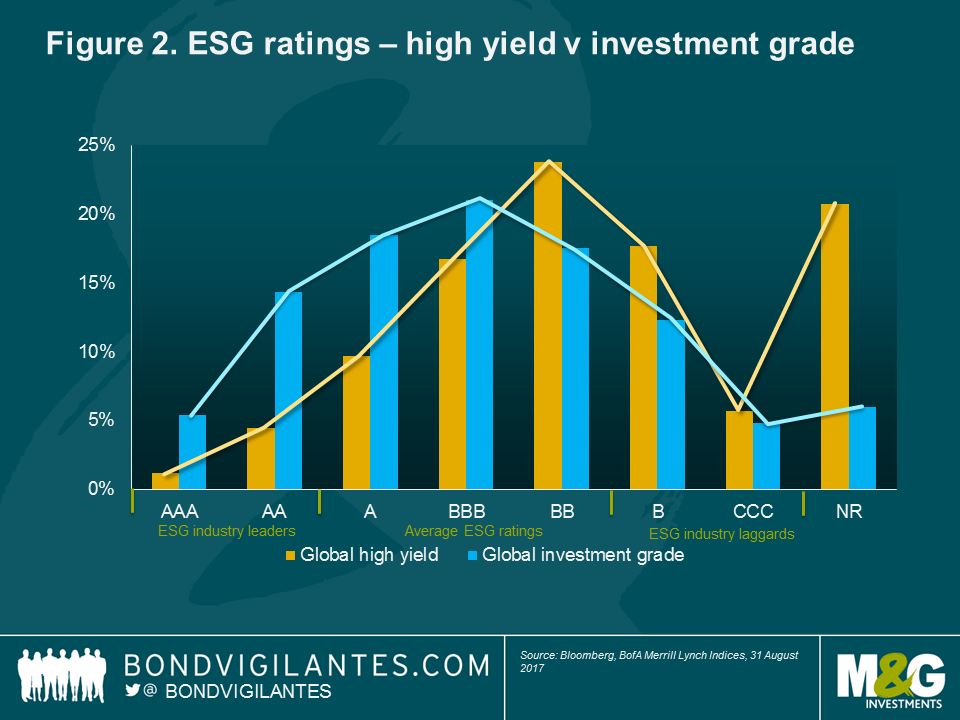
Impact investing takes the concept of responsible investing a stage further by specifically focusing on companies or organisations whose core objective is to solve social or environmental challenges. Impact investing covers a wide variety of activities ranging from sustainable agriculture to healthcare to renewable energy. However, opportunities in this area tend to be illiquid, private and project-based and would not generally be suitable for inclusion in a diversified, open-ended investment vehicle offering daily liquidity.
Despite the limitations of the high yield market, we believe that ESG considerations have an important role to play when investing in this asset class. With the right expertise, we think it is possible to build a well-diversified high yield portfolio which offers favourable ESG credentials. Moreover, a careful consideration of ESG factors can, in our view, help ensure a more comprehensive credit analysis which will ultimately lead to more informed investment decisions.
Green bonds are perhaps the best known example of impact investing from a fixed income perspective. Green bonds pay regular coupons and are no different from conventional bonds, except for the requirement that their proceeds can only be used to fund specified projects designed to generate a positive environmental impact.
However, while the emergence of green bonds is an encouraging development, this remains a very small market in the high yield space, consisting of just 24 bonds across 21 individual high yield issuers.
Green bonds can also be exposed to extremely high idiosyncratic risks, as illustrated in the case of an issue from Spanish clean energy firm Abengoa. The Abengoa Greenfield bond was issued in 2014 to finance green energy projects, but tumbled by around 90% the following year when the company ran into financial difficulties as bank lending facilities were withdrawn and the company was forced to restructure all of its outstanding bonds (see Figure 3).
The case of Abengoa serves to illustrate that green bonds can be exposed to adverse credit events in exactly the same way as conventional high yield bonds. As it stands today, a green bond high yield portfolio would be highly concentrated and lack diversification, making it overly exposed to the risk of default.
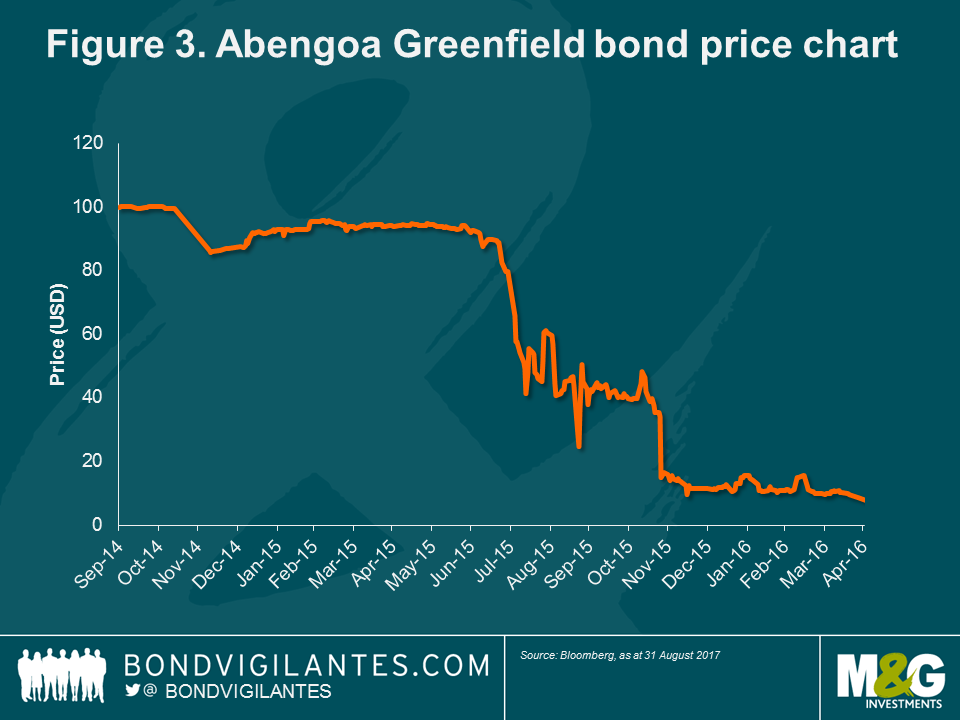
From a high yield perspective, we believe that an optimal ESG approach would be one that implements three layers of screens – namely:
The key advantage of this approach is that client needs and expectations for ESG integration can be met without sacrificing an investible opportunity set of bonds. The resulting portfolio would also have a demonstrably and measurably better ESG score than the market average. Hence, an appropriate balance between investment performance, active views and ESG constraints can be struck.
What would an ESG high yield universe look like? We can see that US high yield would be more affected in this respect, with around 38% of this market excluded based on the above ESG criteria. This is largely because the US market contains a relatively high proportion of companies with poor ESG ratings (ie, B or CCC, based on MSCI analysis). The European high yield market is less affected in this respect, with only 28% of companies being excluded. One notable feature of the European high yield market is the relatively high proportion of companies with revenue streams linked to the weapons industry, with this sector alone accounting for around 10% of excluded companies (see Figures 4 and 5).
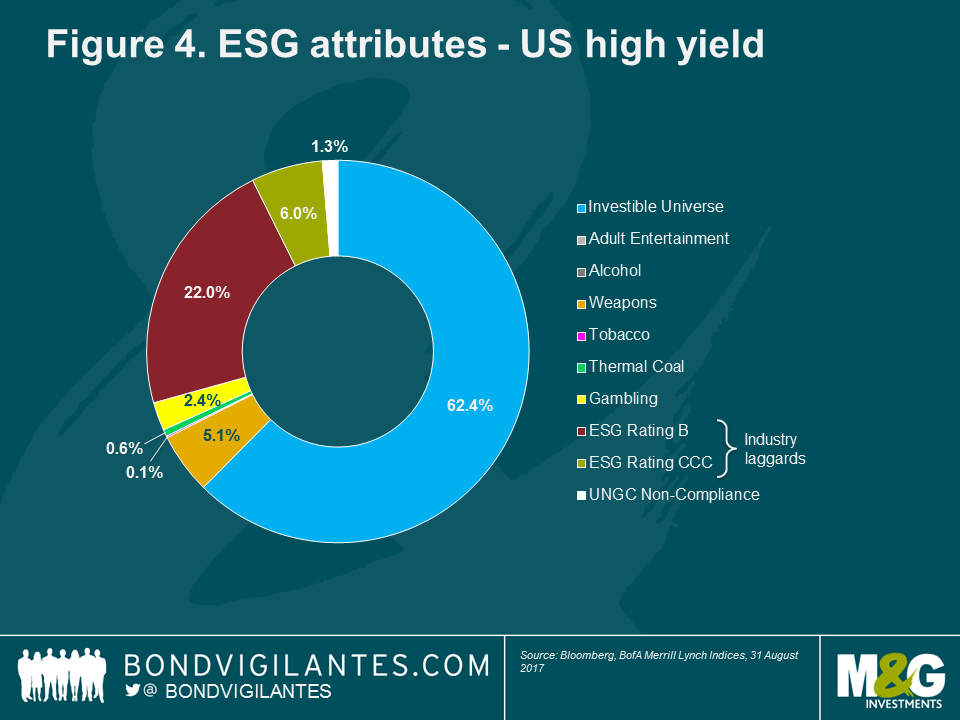

While a global ESG high yield strategy might therefore be expected to display a slight bias towards Europe, given the region’s stronger ESG credentials, it should be noted that the US high yield market is significantly larger than its European counterpart (with a value of around US$1.3 trillion versus US$0.3 trillion) before applying the ESG screens. In absolute terms, the US market would therefore still contain a greater number of eligible issues and we would therefore not necessarily expect significant geographic differences between an ESG high yield strategy and a conventional high yield strategy.
From a sector perspective, an ESG high yield strategy would differ slightly from a conventional high yield strategy as a result of sector exclusion. However, the excluded sectors account for a relatively small part of the high yield market, and the ESG high yield universe still offers good sector diversification with no single industry dominating. Furthermore, employing a sophisticated ESG rating methodology – which assesses a company’s ESG performance relative to its industry peers rather than in absolute terms – can help ensure that a portfolio is not skewed to a few individual sectors.
Another difference worth highlighting is that high yield credit default swap (CDS) indices would not be suitable for inclusion within an ESG high yield strategy, given that some of the underlying components are likely to display weaker ESG credentials. For example, around 42% of issuers within the CDX HY Index would be filtered out if applying the three-stage ESG screening process set out above (see Figure 6).
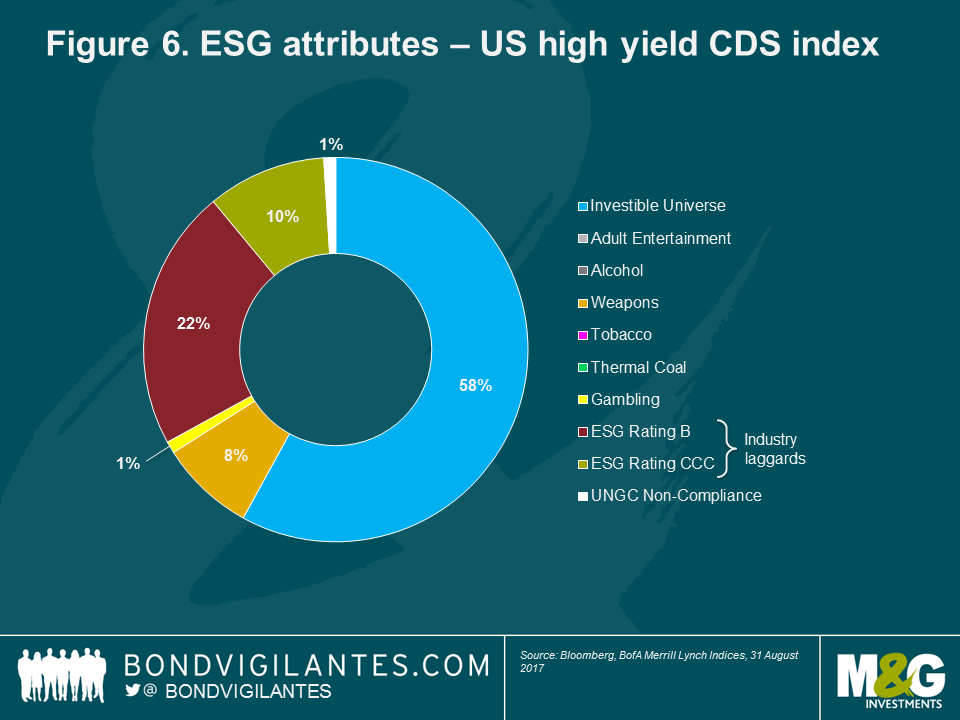
However, in other respects, we would expect an ESG high yield strategy to offer similar characteristics to a conventional high yield strategy, with comparable levels of duration and credit risk and ample opportunities to express investment views via sector allocation and individual credit selection.
For Investment Professionals, Institutional Investors and Professional Investors only. Not for onward distribution. No other persons should rely on any information contained within. This information is not an offer or solicitation of an offer for the purchase of shares in any of M&G’s funds. Distribution of this document in or from Switzerland is not permissible with the exception of the distribution to Qualified Investors according to the Swiss Collective Investment Schemes Act, the Swiss Collective Investment Schemes Ordinance and the respective Circular issued by the Swiss supervisory authority (“Qualified Investors”). Supplied for the use by the initial recipient (provided it is a Qualified Investor) only. In Hong Kong, this financial promotion is issued by M&G Investments (Hong Kong) Limited, Office: 16/F, Man Yee Building, 68 Des Voeux Road, Central Hong Kong; in Switzerland, by M&G International Investments Switzerland AG, Talstrasse 66, 8001 Zurich, authorised and regulated by the Swiss Federal Financial Market Supervisory Authority; in the UK, by M&G Securities Limited (registered in England, No. 90776) and, elsewhere, by M&G International Investments Ltd (registered in England, No. 4134655). Both M&G Securities Limited and M&G International Investments Ltd are authorised and regulated by the Financial Conduct Authority in the UK and have their registered offices at Laurence Pountney Hill, London EC4R 0HH. M&G International Investments Ltd also has a branch located in France, 6 rue Lamennais, Paris 75008, registered on the Trade Register of Paris, No. 499 832 400 and a branch in Spain, with corporate domicile at Plaza de Colón 2, Torre II, Planta 14, 28046, Madrid registered with the Commercial Registry of Madrid under Volume 32.573, sheet 30, page M-586297, inscription 1, CIF W8264591B and registered with the CNMV under the number 79. For Hong Kong only: If you have any questions about this financial promotion please contact M&G Investments (Hong Kong) Limited. The Portuguese Securities Market Commission (Comissão do Mercado de Valores Mobiliários, the “CMVM”) has received a passporting notification under Directive 2009/65/EC of the European Parliament and of the Council and the Commission Regulation (EU) 584/2010 enabling the fund to be distributed to the public in Portugal. M&G International Limited is duly passported into Portugal to provide certain investment services in such jurisdiction on a cross-border basis and is registered for such purposes with the CMVM and is therefore authorised to conduct the marketing (comercialização) of funds in Portugal. For Singapore: for Investment Professionals and Institutional Investors only.
With only one issuer defaulting in the first quarter of 2017 (compared to eight in the same period 12 months ago), the emerging market (EM) corporate external bond asset class has until now met expectations that its default rate could be significantly lower in 2017. Improvements in both macro and corporate fundamentals have helped this outcome, providing relief for many EM bond managers who recently had to navigate through a particularly punishing time – following two years of significant macro headwinds and low commodity prices, the EM corporate default rate of high yield issuers peaked at 5.1% in 2016.
There are a lot of misconceptions about defaults in EM debt. Too often, EM corporates are either considered ‘serial defaulters’ compared with their developed market peers, or seen as a single and homogeneous geography. In reality, default rates follow economic cycles, and having a regional, if not country, approach to default risk remains paramount due to different jurisdictions and various recovery values between regions and countries.
Investors also must assess key questions such as whether credit ratings are good indicators of future defaults, along with which countries have experienced the largest number of corporate defaults. This Panoramic Outlook aims to provide an insight into EM corporate default risk within the ever-expanding EM corporate external bond universe.
Rating agencies have various, albeit comparable, definitions of a default. A widely market-accepted definition is as follows: a missed coupon/principal payment, bankruptcy or liquidation. In addition, when an issuer avoids the aforementioned events of default by compensating bond investors below par, then distressed exchange, buyback and/or restructuring are also regarded as defaults.
Default rates are more problematic, in terms of methodology. Rating agencies all use an issuer-weighted measure which calculates the number of defaulted issuers out of the total sample of issuers under coverage. Some banks also use a similar methodology. Over this method, we prefer the par-weighted measure which calculates the face value of defaulted bonds out of the total stock of bonds in the market or index. In our view, this is a better measure of risk for investors as some issuers have several billions of bonds outstanding while others may have issued only one small bond. If Petrobras defaulted, for example, arguably it would be a bigger event for markets than a small Brazilian corporate with a single US$50 million bond issue. The default rates mentioned in this note, unless stated otherwise, are therefore using the par-weighted method.
Emerging market corporate bonds have become a very large asset class. As at January 2017, hard-currency corporate bonds totalled US$1.85 trillion, of which a majority of outstanding bonds were investment grade (60%), despite the significant number of ratings downgrades that occurred in the past couple of years. Unlike developed markets, most open-ended fixed income funds have a mandate to invest across the universe as a whole, and there are fewer separate mandates by credit quality, in other words, looking only at EM high yield (HY) or only at EM investment grade (IG), as is the case for the US or Europe.
The JP Morgan Corporate EMBI index (CEMBI), one of the most widely used indices for EM corporate bonds, currently yields 4.7%. It can be a commonly made mistake, however, to compare the yield on offer for EM corporates as a whole (IG and HY) with high yield default rates. More relevantly, Figure 1 presents the historical default rates of EM corporates as a whole and for the EM HY segment only: the blue line shows default rates as a percentage of high yield bond stock, while the green line shows default rates as a percentage of total EM corporate bond stock (IG + HY). The former is useful for comparison purposes with developed markets, but the green line is most representative of the actual default risk exposure of investors in the asset class. Between 2012 and 2015, the CEMBI had an average yield of 5.3% while default rates averaged 1.2% in the same period, thus representing an attractive risk/return profile for EM investors.

Another common misconception is that high yield default risk is higher in EM than in Europe or the US. Looking at Figure 2, EM high yield corporate defaults are very much in line with those of European high yield or US high yield. During the last global financial crisis in 2008-09, the EM high yield segment had a lower peak in the default rate than its developed market counterparts.

Bond investors, therefore, face similar default rates in EM and developed markets. But it is still necessary to pick the right country. Looking at EM default risk as a single asset class has many flaws because different countries have different sovereign and corporate debt leverage dynamics, banking systems or jurisdiction risk, among other factors. Figure 3 shows that in the past seven years, EM investors experienced significantly more default risk in Latin America (5.5%) – due to high leverage and a few very sizeable bond defaults – than in Asia (1.6%) or in EM Europe (2.9%). Some countries seem to encounter more defaults than others: South Africa (8.3%), Brazil (8.0%) and Ukraine (18.7%) stood out as a poor geographical region to invest during the period in terms of EM high yield corporate default risk.
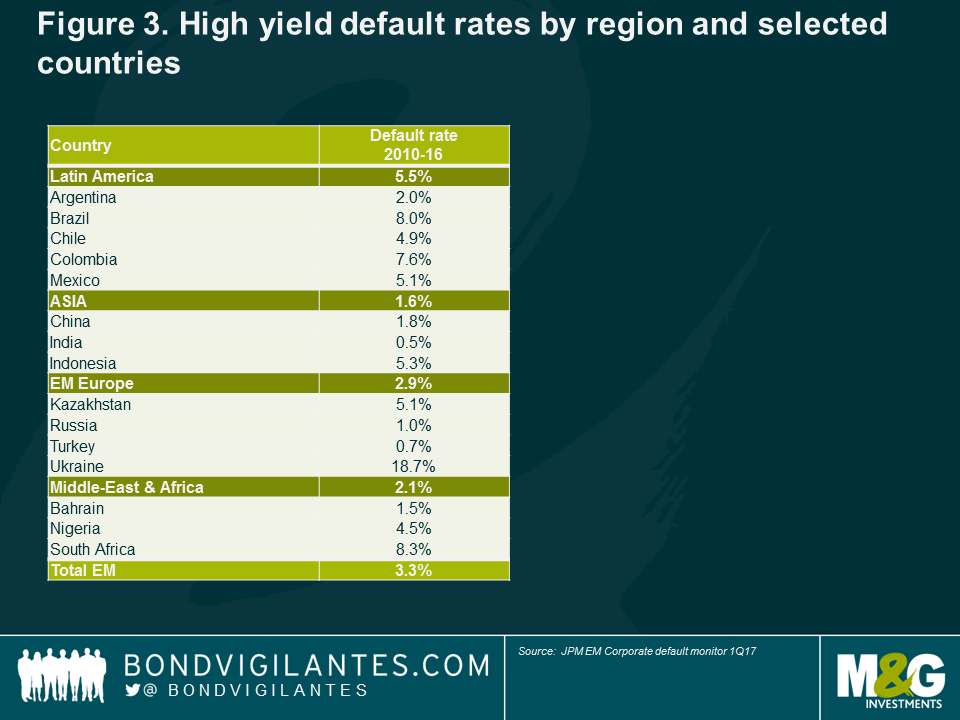
In addition to the actual default rate, bond investors should pay close attention to jurisdiction risk and recovery values. Best practice should identify bondholders’ rights in an in-court restructuring situation. Is this country bondholder-friendly or is the law rather accommodative with shareholders? The complexity, variety and sometimes lack of evidence of bankruptcy/restructuring laws never make it easy to determine. However, history tells us, for example, that South Africa is seen as a rather bondholder-friendly jurisdiction, while Indonesia has a track record of poor treatment for bondholders.
The second step is to identify whether or not foreign bondholders, while on paper often rank pari passu in claims with local banks and local investors, in practice, may end up subordinated to locals in a restructuring. For highly indebted companies in default, this situation may result in poor recovery value for foreign bondholders. For instance, Brazil’s average recovery rate (2009 to May 2017) is only 23.8%, which, coupled with its already very high average default rate, makes Latin America’s largest economy a risky location for EM investors. Kazakhstan and Indonesia are not particularly attractive either, while China and Ukraine top the rankings with 57.1% and 45.8%, respectively, of average recovery values since 2009. At a regional level, Latin America’s recovery rate averages 30.3% and is well below EMEA (Europe, the Middle East and Africa) (40.1%) and Asia (43.2%). It is worth highlighting that the recovery values in the US and Europe averaged only 38.7% and 36.9%, respectively, during the same period and under the same methodology.
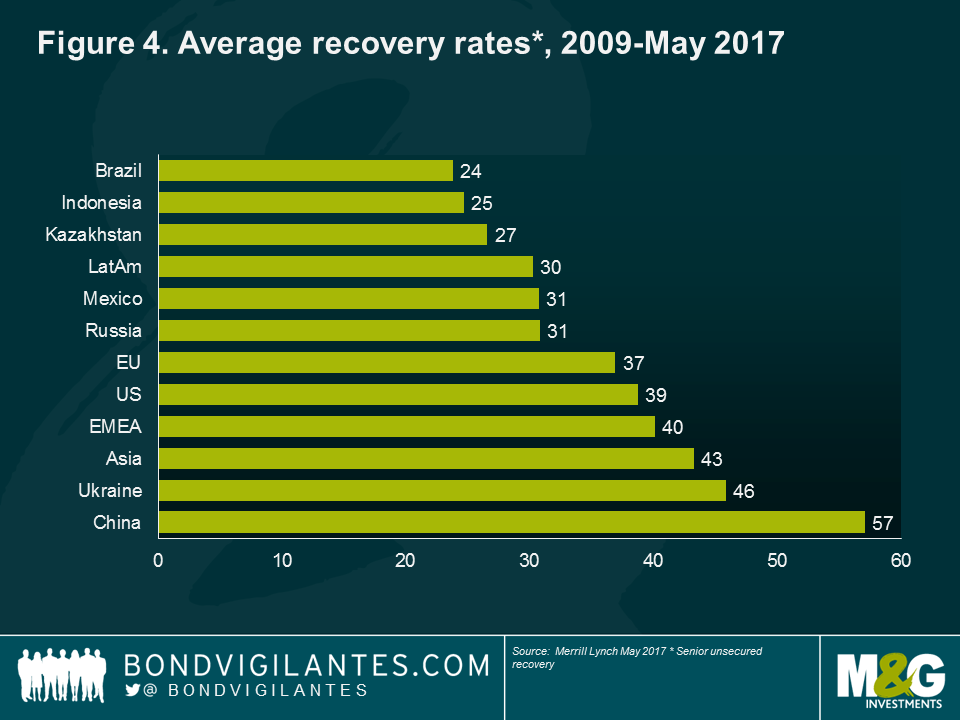
Stating the obvious, in-depth and timely fundamental research is critical to avoid single-name defaults, including an understanding of the aforementioned differences in bankruptcy laws and jurisdiction risk.
At a portfolio level, some credit metrics are useful to identify default risk exposure. In addition to improvement/deterioration in operational metrics, gross leverage (total debt-to-EBITDA), interest coverage (EBITDA-to-net interest) or cash-to-short-term debt are among key ratios used to measure the creditworthiness of a bond issuer, a region and sectors. Looking at leverage in particular, EM high yield default rates seemed to follow increases/decreases in leverage (Figure 5): the pick-up in gross leverage since 2011 has resulted in higher default rates in the past six years.
However, as previously noted, the asset class is heterogeneous, and looking at debt metrics does not always work. While default rates in Latin America seem to follow the increased leverage of Latin American high yield bond issuers, Asia high yield bond issuers actually experienced few defaults while their leverage metrics reached what many international investors would consider unsustainable levels of debt. This is mainly due to China, as domestic investors believe that the government will continue to back acceptable outcomes through bondholder-friendly restructurings or bailouts. This moral hazard may change in the future with China currently in the process of allowing more defaults to occur. When (or if) this happens, should default rates start to follow leverage trends as is the case in other regions, we believe there may be a material uptick in defaults in Asia’s largest economy.

A look at historical default rates (Figure 1) is also clear evidence that high default rates occur during challenging economic times. There are several channels of contagion to corporates, the most common being poor domestic demand, exchange rate depreciation, high inflation fuelling increased input cost, limited access to external funding, capital control or any government interference. The elevated 15.4% default rate of EM corporates in 2002 was the result of a number of macroeconomic factors: global market weakness with the technology bubble, the debt default in Argentina, the domestic crisis in Brazil, as well as Indonesia’s struggle to recover from a long period of recession. The 2009 default rate of 10.7% was amid the global financial crisis, coupled with idiosyncratic crisis, such as the banking system blow-up in Kazakhstan. Therefore, bottom-up research is necessary but not sufficient, and macroeconomic views remain critical in selecting corporates as most defaults occur during sovereign crises, although it is never easy to identify whether a sovereign crisis is the cause of the high corporate default rates or the other way round.
According to rating agency Moody’s, 71% of EM corporate defaults occurred during time of crises between 1995 and 2008. Corroborating this analysis, investors may want to look at the more recent history. A couple of years ago, all large Ukrainian corporate bond issuers – except one – defaulted or engaged in distressed-debt exchanges while Ukraine defaulted on its sovereign bonds following heightened geopolitical tensions with Russia. In 2016, Brazil’s high-yield corporate default rate was 9.7% in the midst of the country’s worst recession ever. Yet, a sovereign crisis does not necessarily result in high corporate defaults and it remains a case-by-case analysis. Russian high yield corporate bond default rates were relatively modest at 1.2% and 0.9% in 2015 and 2016, respectively, considering that low oil prices and Western sanctions led the country into recession during the same period.
Rating agencies and bond investors are well aware of macroeconomic risks and incorporate it into their corporate credit ratings. For this reason, EM corporates, in general, are assigned a lower credit rating than their US or European peers with similar credit metrics.
The accuracy of EM ratings in measuring default risk can be analysed through a Lorenz curve. Plotting S&P’s data of EM corporate ratings and defaults between 1997 and 2015 in the curve, only 40% of defaulted issuers had a rating of CCC/C one year before default. To assess the performance of ratings, it is also interesting to look at ratings of defaulted issuers three years before default. In this case, only 20% of defaulted issuers had a rating of CCC/C three years before the actual defaults (over five years: < 20%). Although 97.2% of defaults occurred for issuers rated in the high yield category (BB+ or less) one year before default, according to S&P, in our opinion, the fact that more than half of defaulted issuers were rated B- or above is not a great track record. Is this specific to emerging markets?
According to S&P, the one-year Gini coefficient was 72.7% for EM corporates between 1997 and 2015, against a global average of 82.0% over the past 35 years. The US and Europe stand at much better coefficients of 80.4% and 90.6%, respectively. While it may be expected to see deterioration in the coefficient over several years, the accuracy gap between EM ratings and US or European peers nevertheless widens over time, according to the study by S&P. In our opinion, this is evidence that bond investors should not exclusively rely on external credit ratings to assess default risk. This proves particularly true in emerging markets.
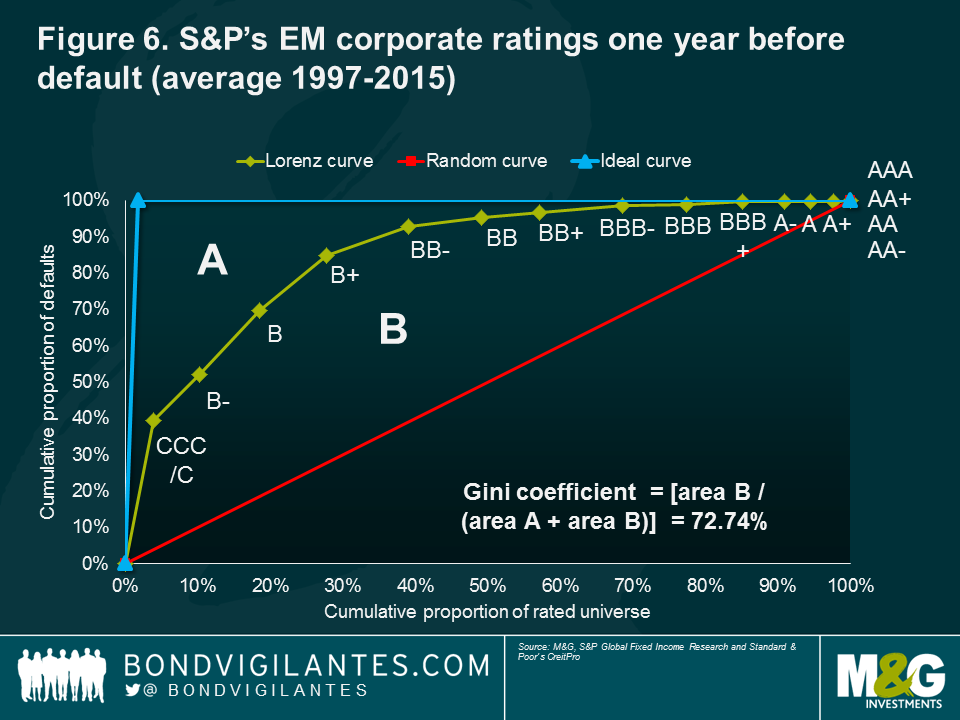
The above Lorenz curve plots ratings between the cumulative proportion of defaults (y-axis) by the cumulative proportion of rated universe (x-axis). In theory, should ratings be fully accurate, all defaulted issuers should have been rated at the lowest rating above default in the rating scale (eg, imminent default or ‘C’ for Standard & Poor’s (S&P) and Fitch) one year before the actual default. This theory is represented in the ideal curve of Figure 6, as represented by S&P in a recent study*. The rating agency also compares this ideal curve with a random curve, the latter meaning, on the contrary, that ratings only randomly measure default risk.
The Gini coefficient is another useful indicator of ratings performance because the ratio, which is calculated as [area B / (area A + area B)], translates the Lorenz curve into a single and comparable measure. If the rating distribution randomly measured default risk, the Gini coefficient would be zero. Conversely, the coefficient would be close to 100% had all defaults occurred in the lowest rating category – effectively the ideal curve.
* S&P Global Ratings: 2015 Emerging Markets Corporate Default Study And Rating Transitions, September 2016.
To use a credit rating as a single measure of default risk is therefore not sufficient. Another useful indicator is market price. The peak of defaults for EM corporates – 5.1% in 2016 – coincided with a large number of bonds starting the year in 2016 at distressed levels. 74 bonds representing 10% of the EM High Yield Index (the high yield portion of the JPM CEMBI BD Index) were trading at a cash price of below 70, as at 1 January 2016 (see Figure 7).
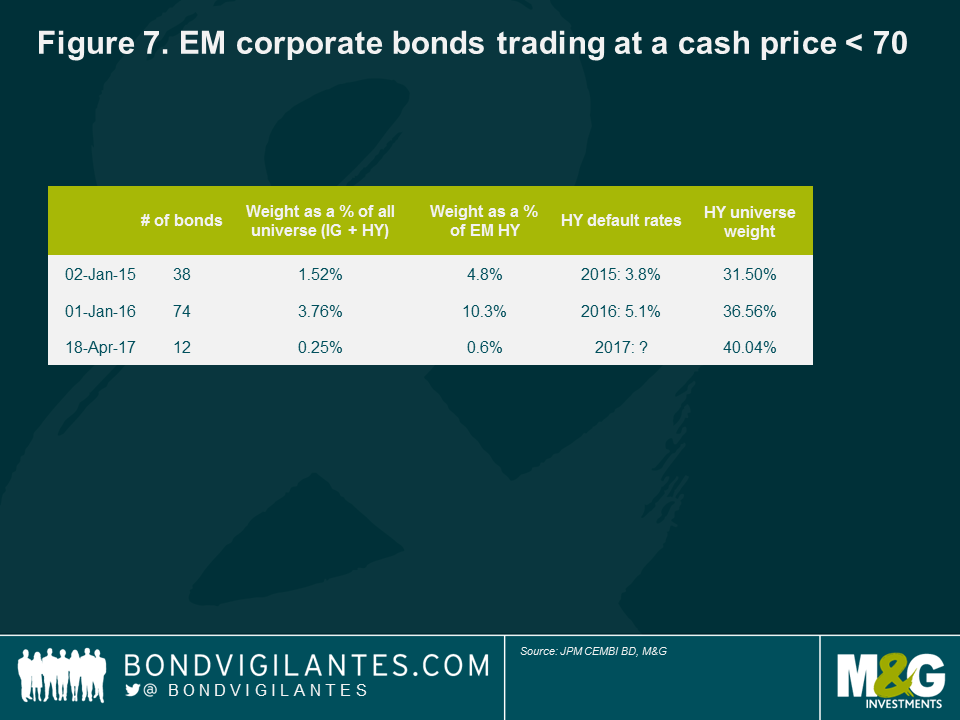
This year, we believe default rates should come down significantly. In April 2017, we have noted only 12 distressed bonds in the index, accounting for only 0.6% of the high yield index. The high yield default rate in the first quarter of 2017 was only 0.1%, a very good start of the year. In addition, most countries are seeing better refinancing conditions. This is the case for Brazil which experienced a near full closure of its corporate bond market in 2015 and early 2016. Russian corporate issuers also returned strongly to the primary market in the first quarter of 2017, while Mexican corporates were able to refinance existing maturities despite the early fears following the US election. In Asia, China continues to benefit from robust local demand. Finally, low spreads have been reducing the cost of debt (and refinancing), a welcome savings for cashflow generation after years of a deteriorating operating environment until the first quarter of 2016.
Expected lower default rates have been a major driver of spread tightening. EM high yield corporate bond spreads have fallen around200 basis points (bps) over one year to 445 bps as at April 2017. So how much are we getting paid on top of default risk; in other words, how much excess spreads do investors earn on top of spreads compensating for default risk? Based on our calculation1, we estimate that excess spreads in EM high yield are about 340 bps, assuming low single-digit default in 2017. This has come down from 430 bps a year ago, arguably making high-yield corporates less attractive on a default risk-adjusted basis than investment grade bonds. However, this analysis is really only relevant for passive investors buying an index – hence, being fully exposed to default risk – as one would expect active management and in-depth research to allow avoiding defaults and capturing both the excess spreads and spreads compensating for default risk.
Finally, default rates are not the only driver of the asset class, as tightening bond spreads have also reflected the better risk sentiment as well as the supportive technical backdrop with strong EM demand exceeding a still-negative net supply of bonds. In our view, the improving EM macroeconomic fundamentals and expected benign default rate environment continue to offer opportunities to find attractive yields in emerging debt markets.
1 We assume: (i) bond spreads reflect a six-month forward-looking view of default; and (ii) a 35% recovery value in EM high yield debt
It’s fair to say that, back at the start of 2016, few would have predicted we would end the year with president-elect Trump readying himself to move into the White House, and the British establishment at loggerheads over the form (hard? soft? somewhere in between?) that the country’s departure from the European Union should take. Add to this the odds of Leicester City winning the English Premier League, and one bookmaker was quoting potential winnings of £12.5 million on a stake of just £5. Even with sterling’s recent weakness (the currency is down 14% versus the US dollar, year to date, as I write), a return like that is hardly to be sniffed at.
Following a bear market in 2015 for many parts of the bond markets, 2016 has been more positive overall, despite significant volatility. As ever, central bank moves have proven pivotal. Since the US Federal Reserve (Fed) hiked interest rates in December 2015 – the first time in almost 10 years – it has held fire, although a December 2016 hike is now virtually priced in. At the other end of the scale, the European Central Bank (ECB) chose to extend its asset purchase programme in March, while the UK also opted for further monetary stimulus – along with a rate cut – in August, as it changed course to counteract the perceived negative impact that the Brexit vote would have on the country’s economy.
Meanwhile, spreads on investment grade credit and high yield bonds have tightened, the latter substantially. High yield defaults remain elevated compared to recent years, although this has been skewed by energy sector issuers. A gradual increase in the oil price should in any case reduce some of the pressure on these names. And after a torrid 2015 for emerging markets, the asset class experienced a far more positive ride in 2016, at least until Donald Trump’s victory in November.
A sharp sell-off in government bonds was among the key reactions in financial markets to the US election result, although it is as yet unclear whether this is just another blip, or the start of a more sustained move back towards ‘normal’ yield levels after years at close to historic lows.
Importantly, with the Republican Party in control of both the Senate and the House of Representatives, president-elect Trump should have the political power to advance his headline economic policies of significant infrastructure spending and big cuts in corporation tax. We should expect follow-through on trade protection measures as well, starting with his stated intention to withdraw the US from the Trans-Pacific Partnership on his first day in office. The repatriation of some immigrant workers and Trump’s border wall is also likely to stay on the agenda.
For bond investors, it’s a cocktail that adds up to increased government borrowing and firmer inflation prospects.
Much has been made of the similarities between the situation facing Donald Trump in 2017, and that confronted by Ronald Reagan when he took office in 1981. Back then, Reagan inherited a sluggish economy and inflation approaching 15%. His initial answer to this was the Economic Recovery Tax Act, which contained significant tax cuts (including across-the-board cuts in individual marginal income tax rates, as well as various business taxes), lower government revenues, and a reduction in government welfare spending. As a result, US Treasury yields climbed to all-time highs, with the yield on five-year US Treasuries peaking at 16.3%. And this was in an era when the debt-to-GDP ratio was just 30%, a far cry from the level of nearer 100% that president-elect Trump is inheriting today (see Figure 1).
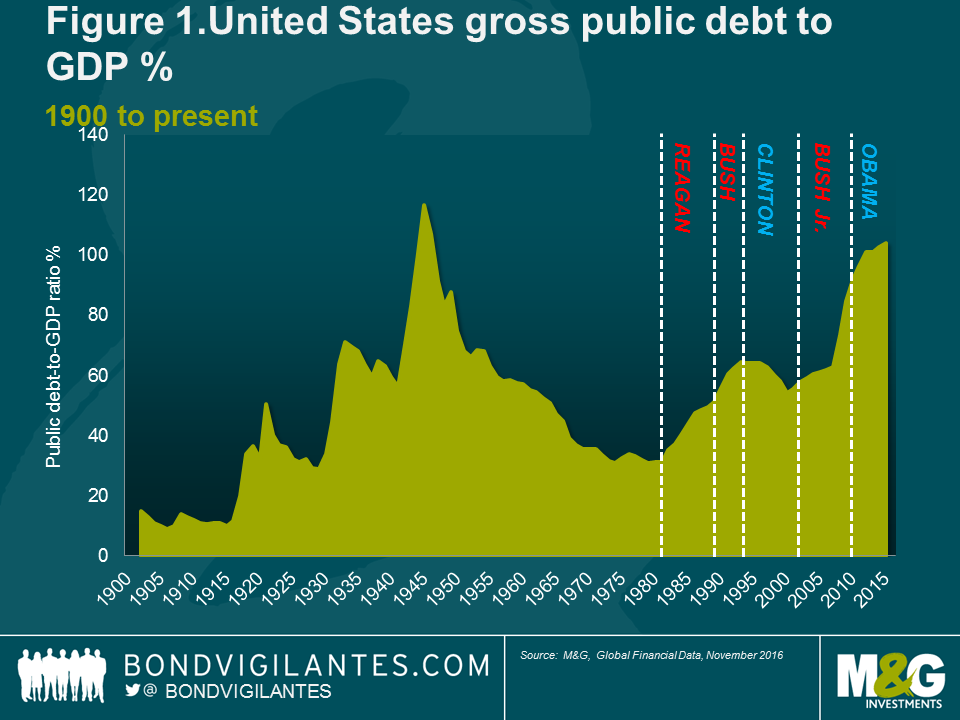
As a result, the concern is that Trump simply doesn’t have the fiscal headroom that Reagan did to proceed with Trumponomics without spooking the markets. From an inflation perspective, the increased fiscal stimulus that he proposed on the campaign trail is expected to support the upward signals that were already building as result of a tightening labour market and rising oil prices. The US is near, or even at, full employment now – again, in notable contrast with the backdrop that Reagan picked up back in the 1980s. Should Trump engage in an out-and-out trade war, the impact on inflation could be even more pronounced, with tit-for-tat trade tariffs pushing up the cost of imported goods. His pronouncements on immigration are also relevant here: the potential repatriation of workers could decrease the supply of labour and give some support to wage growth.
Against such a busy scenario, governments that borrow too much typically watch their bond yield curves steepen, as we saw from the US Treasury market’s behaviour in the weeks following the election result (see box ‘A return of the Bond Vigilantes’?).
A further concern for bond investors is Trump’s willingness to consider ‘haircuts’ as a means of managing government debt. My personal view is that while US Treasury investors have a lot to weigh up, they shouldn’t yet worry about a default from the US government. Here’s what Trump actually said:
“No. I don’t want to renegotiate the bonds. But I think you can do discounting, I think, you know, depending on where interest rates are, I think you can buy back. You can – I’m not talking about with a renegotiation, but you can buy back at discounts, you can do things with discounts. …I would refinance debt. I think we should refinance longer-term debt.” – Donald Trump, 10 May, 2016.
Trump’s victory and the UK’s vote in favour of Brexit are two of the biggest challenges in recent years to the global economic status quo. One of the main outcomes is a renewed debate about the impact of globalisation on the developed world.
On the issue of trade, the move by rich countries to locate manufacturing hubs offshore and the associated loss of jobs in rich nations have both been identified as negative consequences of free trade by populist politicians.
In order to assess the impact of globalisation on low- and middle-income households, analysts have used the ‘elephant curve’ (see Figure 2), which shows how average household incomes have grown between 1988 and 2008 for each part of the global income distribution, from the poorest on the left to the global top 1% on the right.

The chart shows that incomes for the poorest half of the world – typically those in emerging markets, in particular emerging Asian economies – have grown as fast as those of the world’s richest 1%. However, incomes for the lower middle class of the developed world (between around the 50th and 80th percentiles) have at best stagnated. As a result, it highlights how many have missed out on the much-vaunted benefits of globalisation, and helps explain the rise of nationalism across the developed world.
However, one of the economists who created the chart has suggested that his research has been misinterpreted. Branko Milanovic, a leading scholar on income inequality, has suggested the problem isn’t trade itself, which has lifted hundreds of millions out of extreme poverty. It’s that countries don’t design policies to support those that suffer as a result of lowering trade barriers. According to Milanovic: “Trade and globalisation are forces for good. The problem is that in many instances globalisation is implemented in a way that makes the playing field slanted in favour of the rich. Also, the gains from globalisation are never likely to be even for all the participants.”
Of course, the rise of populist movements is too complex to be explained by a single graph. There are many other factors at play, including protest votes on existing government policy, and issues connected with immigration. The key question that economists now face is assessing the impact that a more inward-looking US will have on the global economy. If countries begin to renege on trade agreements and begin to raise tariffs, we may see countries enter into a vicious circle of action and reaction, which would ultimately lead to a contraction of global growth. In this environment, everyone loses.
Regardless of the trend towards growing dissatisfaction with globalisation, it would be extremely difficult for advanced economies to reverse it now. Those that turn inward may be temporarily successful in boosting growth through growing private and public debt levels, but ultimately risk deep recession as inflation and unemployment begins to rise. An increase in borrowing today by consumers and governments is merely stealing growth from the future. For bond markets, this could lead to a renewed focus on the creditworthiness of government bonds, the traditional ‘risk-free’ asset, resulting in higher yields in the not-too-distant future.
“I used to think if there was reincarnation, I wanted to come back as the president or the Pope or a .400 baseball hitter. But now I want to come back as the bond market. You can intimidate everybody.”
Regular readers of our Bond Vigilantes blog will recognise this quote, from Clinton administration adviser James Carville back in 1993.
The term ‘bond vigilantes’, coined by US economist Edward Yardeni 10 years earlier, came into being to describe Ronald Reagan-era deficits and resulting US Treasury market revulsion. The term refers to the bond market’s ability to serve as a restraint on a government’s ability to overspend or borrow: investors can sell bonds, pushing yields upwards, in protest at what they see as inflationary policies.
After years when inflation was in the wilderness and austerity rather than fiscal stimulus has been in vogue, is now the time that we see bond investors start to flex their muscles once again?
Policy makers and economists, such as Harvard professor Ken Rogoff, have made elegant arguments for the benefits of a cashless society. In his latest book, ‘The Curse of Cash’1, Rogoff proposes to eliminate most paper bills. Rogoff’s argument is that in a world of negative interest rates, consumers would prefer to hoard cash than pay to save their money with a bank, thereby reducing the effectiveness of monetary policy. Denmark, Sweden, and Norway are already considering moving to a cashless economy, while the European Central Bank has ended the production of the €500 banknote.
Forcing more transactions into the banking system would make tax collection easier and reduce the size of the black market. This was the main motivation behind India recently banning 500 and 1,000 rupee notes. Rogoff argues that a large proportion of cash in circulation goes to paying off-the-book transactions and wages. Phasing out large banknotes would make it harder to transport large sums of cash, or to store in safe deposit boxes.
The ability to push interest rates deep into negative territory may become more important for central banks, particularly if their respective economies enter into a recession. As consumers react by spending rather than saving, it is hoped the economy would return to growth and interest rates and inflation would be able to rise to manageable levels again.
As well as encouraging large portions of the economy to hold cash, the other problem with negative interest rates is the destabilising effect that it has on the banking sector. The World Bank has pointed out that negative rates can erode bank profitability by narrowing interest-rate margins. Perversely, some banks in Switzerland have been raising mortgage rates as they attempt to make profits. In addition, pension and insurance companies are struggling to meet their long-term obligations in this ultra-low interest rate world.
Arguably, we have now reached the limits of what monetary policy can do. It is time for central bankers to pass the baton on to governments to inject money into ailing economies. In the immediate future, a larger investment role for the state appears warranted. Arguments around banning cash and moving to electronic money are a sideshow – it is now time for a deeper analysis of what role governments can play in stimulating economic growth.
The move to a cashless society is one example of the impact that technology may have on our day-to-day lives in the not too distant future. Many books have been written on the subject in recent years. One of the best to come out in 2016 is Economist editor Ryan Avent’s ‘The Wealth of Humans’.2
With the digital technology revolution arguably the most important since the industrial revolution, we are gradually moving away from a world in which regular paid employment is the norm towards one in which robots take over both white as well as blue collar jobs.
Avent suggests that a redistribution of wealth through a new form of social contract will be needed in order to avoid major societal unrest. But how might wealth be shared fairly, and how could we balance the fact that offering citizens an attractive, guaranteed income in lieu of work will likely encourage immigration?
Avent is optimistic that, over the long run, this empathy can lead us to an expanded sense of who deserves to share in our wealth. As he says, we should see technology as an “enormous natural resource” with all sharing in the benefits. However, as Brexit and the US elections have proven, such empathy currently seems to be in short supply.
1 Kenneth S. Rogoff; The Curse of Cash; Princeton University Press, Princeton, New Jersey, 2016.
2 Ryan Avent; ‘The Wealth of Humans: Work, Power, and Status in the Twenty-first Century; St Martin’s Press, 2016.
Nowhere have the subjects of fiscal austerity and rising inequality been as relevant as in Europe today. Stubbornly high unemployment rates combined with declining living standards have contributed to rising levels of civil and political instability over the past year. Populist and nationalist parties have been able to capitalise on this phenomenon and raise massive amounts of support from exasperated European citizens.
In Spain, for example, a caretaker government had to be put in place after two consecutive presidential elections failed to designate a clear winner. France will also face an important political test when it holds its presidential election in spring 2017. National Front leader Marine Le Pen will be trying to take advantage of the positive momentum she has built up to sweep her party to its first victory. While this would require a vast – and unlikely – swing from voters, recent events remind us that the rise of anti-establishment parties globally is not one to be underestimated. Equally, traditional polling methods seem to struggle to capture the swing to the hard right that is underway. These mounting pressures could not come at a worse time for Europe, whose 2017 political schedule looks particularly packed (see Figure 3).

The extra difficulty for Europe is that its capacity to boost growth and employment via increased public and infrastructure spending and tax cuts is more limited than other economies, for two main reasons. First of all, high levels of debt (Europe has an average debt-to-GDP ratio of 90% versus the 60% target of the Stability and Growth Pact) are forcing most European countries to rein in spending rather than increase it. Second, not having the ability to print money at an individual country level in the European Union (EU) requires each member to demonstrate even more fiscal discipline for the union to remain viable.
For those mainstream European political parties wishing to claw back votes from their more extreme rivals, the challenge is therefore as follows: to improve the living standards of hundreds of millions of Europeans, while preserving the EU’s balance sheet. This can only be achieved by implementing the right mix of pro-growth structural reforms, but some tough times could still lie ahead.
As we’ve already noted, Trump’s election has led many to speculate that the US is likely to shift to a highly expansionary budget policy. Proposed fiscal measures include a reduction in the corporate tax rate to 15% and a decline in the top rate of household income tax from 39.6% to 33%. Trump has also proposed a large increase in infrastructure spending (he likes building walls) and large increases in the defence budget.
Bond investors are worried that this will further boost already rising inflation. In response, the Fed may be forced to hike interest rates, which could, in turn, lead to a further appreciation of the US dollar. While Fed chair Janet Yellen has stated her intention to remain in post until the end of her four-year term in early 2018, Trump could slam the Fed for hiking rates and putting a brake on his economic growth plans in this environment.
The yen and euro appear particularly vulnerable given the continued expansionary stance of monetary policy set by the Bank of Japan (BoJ) and ECB, respectively. The BoJ’s transition to yield-curve targeting ensures that real yields will drop as inflation picks up, implying that financial conditions will turn increasingly loose as the recovery progresses. There are good reasons to be cautiously optimistic: after all, despite a triple whammy of feeble domestic demand, weak commodity prices, and a stronger yen, Japanese inflation measures are showing early signs of bottoming out. The Japanese government has also approved an economic stimulus package of roughly 5.5% of GDP.
The BoJ’s move to yield-curve targeting is not a new monetary policy development. In 1942, the Fed and US Treasury agreed to cap the long-term US Treasury yield at 2.5%, the 7- to 9-year yield at 2%, and the 1-year rate at 0.875%. The caps on long-term interest rates were never formally announced, perhaps to avoid embarrassment in case the policy proved unsuccessful. The US authorities pursued a policy of yield-curve targeting until 1951, when the Fed became openly frustrated with the constraints on monetary policy associated with the commitment to support yields on government securities and pushed for an end to the policy.
In the UK, Chancellor Philip Hammond’s Autumn Statement confirmed that there will be no budget surplus, there will be looser fiscal rules and lower tax receipts due to weaker average earnings and lower household consumption. In my opinion, the UK government is probably – prudently – holding back some fiscal ammunition in anticipation of the eventual triggering of Article 50 and the two-year negotiating period with the EU.
The ECB’s announcement back in March that it would extend its asset-purchasing programme (known as the Corporate Sector Purchase Programme or CSSP) to include investment grade (IG) non-bank corporate bonds only served to highlight the divergent fortunes of the US and Europe (see Figure 4).
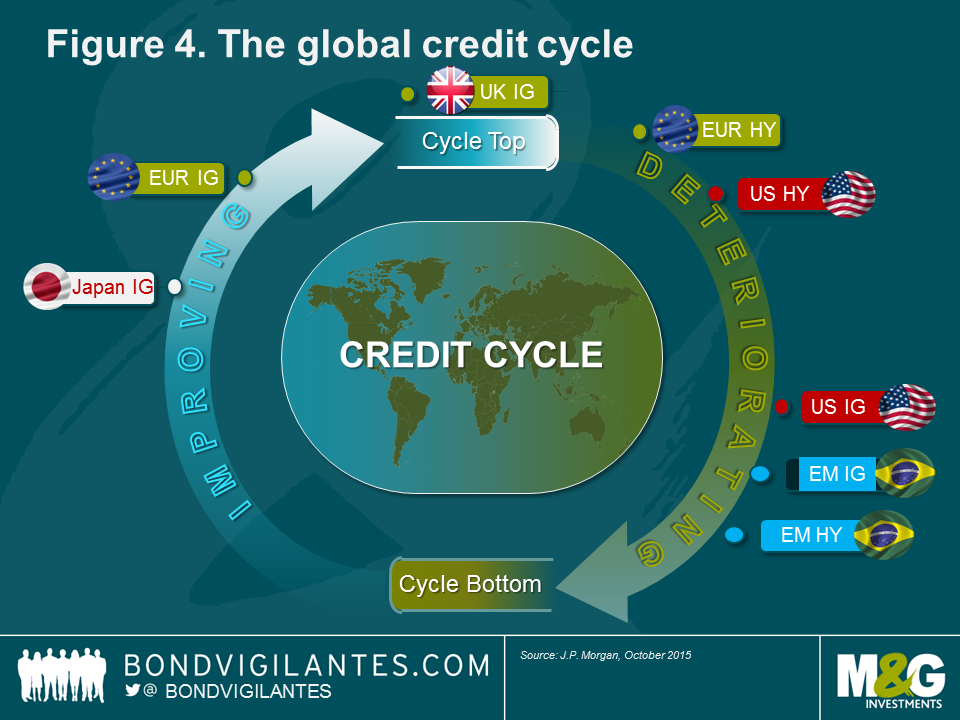
The flexibility of the programme, together with its broad purchase scope, which is spread widely over a large number of bonds across all IG ratings, curve buckets and sectors, largely took the market by surprise, and resulted in an immediate and significant tightening of credit spreads. This was not only the case for potentially eligible corporate bonds, but also for the broader European corporate bond markets, including the lower end of the IG risk spectrum.
One key implication of the move is that, with it, the ECB formally became a new, large and price-insensitive player in Europe’s corporate bond market. As such, the ECB has provided strong technical support for European credit, putting a floor under prices and driving down bond yields further. Over US$10 trillion of global sovereign debt is now trading with negative yields and until relatively recently, corporate bonds had been a notable exception to this phenomenon. Recent policy moves from the ECB and other central banks have been the primary drivers of interest rates going into negative territory.
A deliberate consequence of quantitative easing (QE) is known as the portfolio rebalancing effect, where private investors, looking to generate positive returns, have been increasingly forced to take on greater amounts of credit risk in order to do so. For many investors, this has meant having to move down, and especially out, along the credit curve in their hunt for positive yielding bonds. Nonetheless, we believe that we are still currently being overcompensated for taking on default risk both across the US dollar, sterling and euro credit markets, and across the ratings spectrum (see Figure 5).
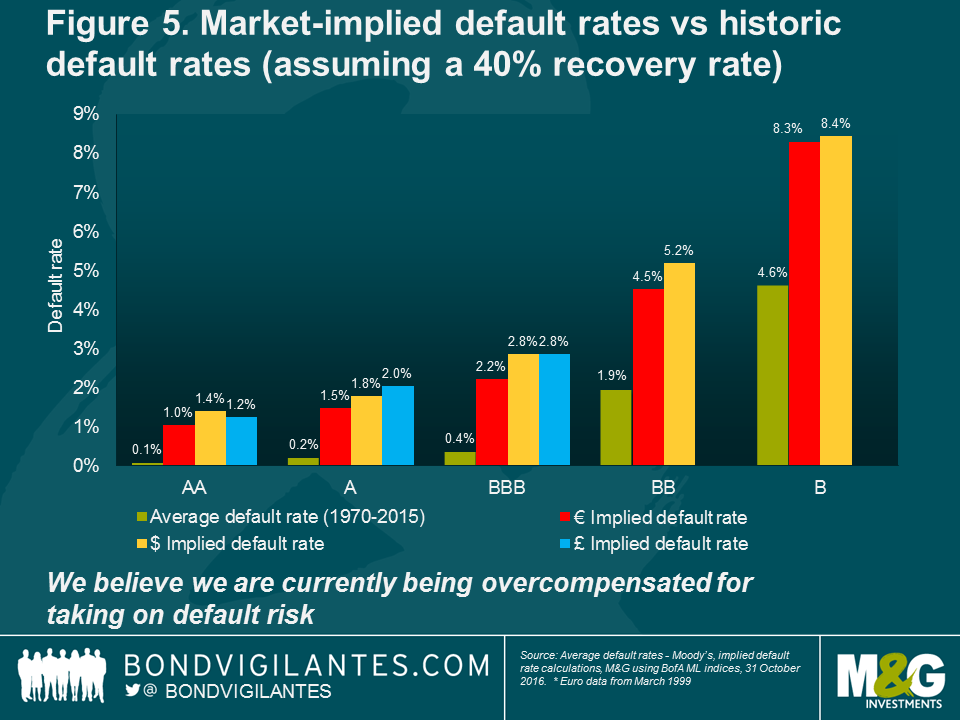
The return of supply is another effect induced by the CSPP. European corporate bond issuance had fallen to very low levels in the months preceding the programme. Since then, markets have witnessed a strong recovery in primary market activity on both gross and net supply levels.
Looking into 2017, market sentiment remains fragile. The yield advantage of US Treasuries over German government bonds is near all-time highs (see Figure 6). A similar story is playing in the corporate bond market. The more the ECB continues putting downward pressure on European corporate bond yields, the greater scope for investors to move away towards the relatively more attractive yields available in the US corporate bond market.
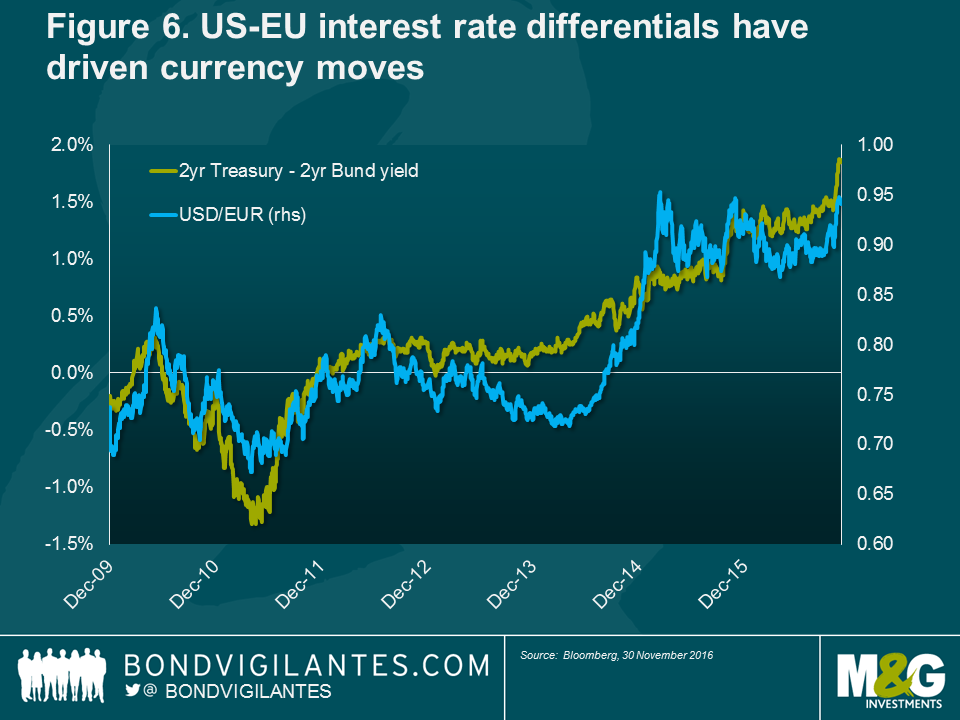
Equally, the sharp market fluctuations of 2013’s ‘taper tantrum’ and 2016’s ‘bund tantrum’ episode (which followed a Bloomberg article suggesting that the ECB was considering winding down bond purchases) offer a useful reminder of how major market corrections can take place in a short period of time. As credit markets have become increasingly complacent, the risk of asset price corrections remains high and may well be amplified by the particularly intense European political agenda ahead.
Back in March, when the CSPP was launched, Europe’s economy was in outright deflation. Since then, monthly inflation in Europe has shown a modest improvement thanks to the recovery in global commodity prices. While this is still far from the ECB’s target of close to but below 2%, the recent stabilisation in energy prices could provide temporary support to consumer prices. Over the coming months, the ECB will be closely monitoring inflation expectations to assess any further need for monetary accommodation. While the Bank may seek to continue CSPP beyond September 2017, it could also decide to end it if the path of inflation were to look consistent with its inflation aim.
Donald Trump’s victory has a number of wide-ranging implications for the emerging markets. At first glance, the result is clearly negative, given the potential risks from factors such as increased trade protectionism, large fiscal expansion, anti-immigration measures, and uncertainty in terms of foreign policy. Many emerging market bonds and currencies almost immediately reflected their concern. The Mexican peso, which had served as a bellwether for the fluctuating fortunes of Clinton and Trump during the election campaign, due to the country’s proximity and deep economic ties to the US, depreciated some 10% in the immediate aftermath of the result. If Trump is able to impound all remittance payments derived from illegal wages, El Salvador and Honduras will face a negative economic headwind given these countries have a high share of unauthorised remittances versus GDP.
However, as is often the case, the impact of a Trump presidency will not be felt uniformly across the emerging markets. There are several key emerging countries that are relatively closed economically, such as India and Brazil, which will prove relatively insulated from developments in the US.
Elsewhere, markets in Eastern Europe, such as the Czech Republic, Hungary and Romania, are much more dependent on Europe than the US for their exports. Meanwhile, Russia may benefit if the US starts easing financial sanctions against it, and the ruble rallied in the immediate aftermath of the election result.
At the same time, much attention will be focused on US relations with China. As the biggest foreign holder of US government debt, China may look to reduce its holdings to prevent its currency from depreciating too rapidly versus the dollar (see Figure 7). Any imposition of trade tariffs or move by the US Treasury to name China as a currency manipulator will be the key events to watch out for.
Although US Treasury yields have so far risen sharply since the US election result, we expect yields to gradually edge higher in a more modest and gradual manner. For a number of emerging markets, this prospect is less challenging than it might have been in previous years, as they have improved current account deficits and adjusted to having lower overall levels of US dollar-denominated debt.
However, as is always the case for all asset classes, and the emerging markets in particular, much will depend on the newsflow as we go into 2017, and on whether it turns out to be a year as full of surprises as 2016 has been.

There’s a great attraction in using demographics – i.e. trends in population growth, and changes to the composition of populations between the young and old – as an economic forecasting tool. This is because future demographic trends are largely baked in the cake, allowing us to make solid predictions. Like the famous basketball making its way through a snake, we can see where it’s been, make an informed judgement about where it’s likely to go, and at what speed. Traumatic events like wars, famines and plagues can occasionally change demographic trends (for example Russia after World War II), and there can be societal changes in birth rates (historically, tending to fall as economies get richer). That said, the composition of your population today generally tells you what it will look like in decades to come.
In addition, for much of the 20th century, understanding the demographic changes in the Western world would have allowed you to predict government bond yields pretty accurately. In the past few years, however, those old models have completely stopped working. So what is the relationship between demographics and bond yields, and why did it break down?
The traditional models worked like this. Knowing what population growth is likely to be allowed you to estimate an important input to an economy’s trend gross domestic product (GDP) growth. Trend GDP growth is often calculated as the change in working-age population plus any change in productivity growth. This estimate of trend growth is itself an important input to making a judgement about the long-term real interest rate (r*) appropriate for an economy. The changing mix between old and young in an economy is also, therefore, critically important for understanding where interest rates might go.
When the ratio of people of working age to those of non-working age (kids, retirees) is high, inflation is low and bond yields fall. The reverse also holds. Why? The first reason is driven by the supply of labour. When a society has a high proportion of workers relative to the population, workers are less able to demand high wages than at times when there is a ‘shortage’ of labour. Wage growth has historically been a driver of inflationary pressure, so weak wage growth is correlated with low consumer price inflation, and hence low bond yields.
Secondly, we can also think about the ratio of workers to non-workers as similar to the ratio of ‘producers’ to ‘consumers’. Children and the retired don’t make anything, they only consume goods and services (and are high consumers of state-provided services such as schools, universities, doctors, hospitals and carers). So within society, there is relatively more demand for goods and services compared to those involved in their production and provision. This itself is inflationary (bad for bonds), and demand for state-provided services causes higher levels of government borrowing (bad for bonds).
Finally, you can think of the working-age population being in an asset-accumulation phase of their lives – earning money and investing that cash into pensions and other assets to fund their retirement lifestyles. The retired are in an asset de-accumulation phase, selling their savings to fund consumption. It follows that when you have a large percentage of elderly people in the population there will be selling pressure on those assets (often fixed income) they had previously accumulated.
All three of these dynamics can be seen at work in Western economies over the past century. For modern investors, the biggest influence on demographics has come from the biggest basketball passing through the snake – the baby-boomers. The return of stability to much of the world after the end of World War II, together with the returning home of tens of millions of men to their homes after years away fighting, led to a huge number of babies being born in the following years (the term ‘baby boom’ was first coined in 1951). In 1938, for example, the US experienced 19 births per 1,000 population. In 1947 this was 26 births, and the birth rate remained above the 1938 level until the mid-1960s. The initial impact on economies may well have been negative, with strains put on public services and public debt rising after the initial sharp post-war deleveraging. By the time we got to the 1970s, we saw the ratio of working-age population to the young/old cohort hit a record low, falling from 53% in 1945 to below 40% in 1975 (see Figure 1). The baby-boomers had yet to fully enter the workforce and become ‘productive’.
It was a similar story in the UK. I’m currently reading Labour Member of Parliament Alan Johnson’s book Please, Mister Postman[1] about his time working in the Royal Mail in the 1970s, and he recalls the permanent struggle they had to fill vacancies.
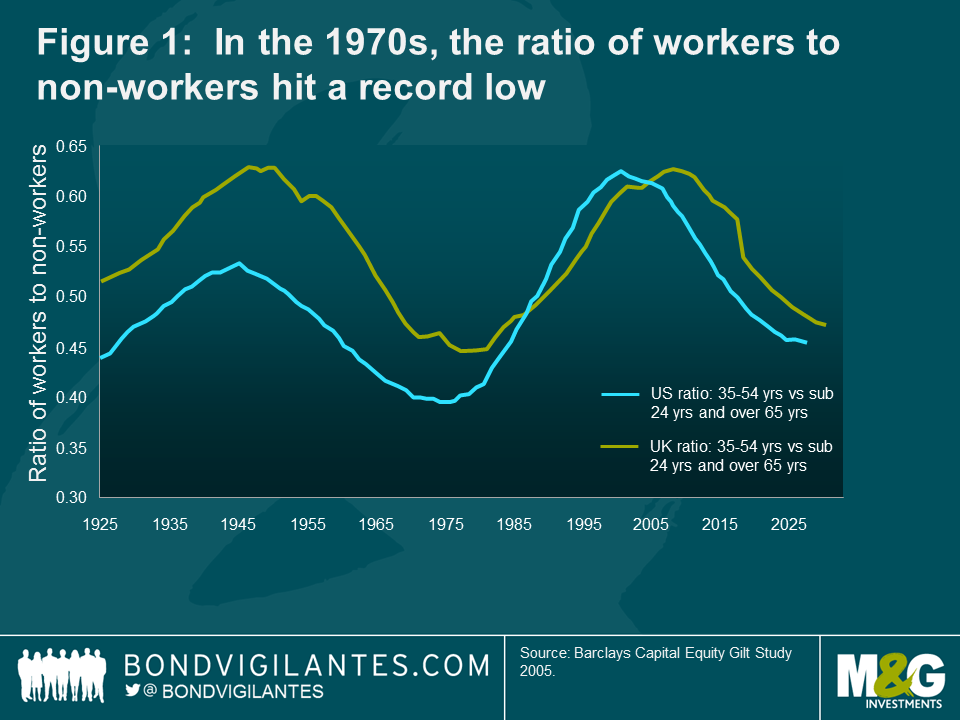
The relatively low supply of labour in the 1970s gave power to those of working age. Trade union membership peaked in the late 1970s (when 12 million people in the UK were members) and wage growth outstripped productivity growth and inflation. Government debt burdens grew, and interest rates and bond yields hit double digits. There were talks of ‘buyers’ strikes’ by institutional gilt investors in the UK.
But as the baby-boomers entered the workforce after school or college, there was a significant improvement in the demographic trends. From that low of 40% in 1975, by the end of the 1980s the ratio of workers to non-workers was back above 50%, peaking at over 60% by the end of the 20th century. The developed world had become a world with lots of workers, keeping inflation low (trade union membership shrank), producing tax revenue to reduce government borrowing (at times in the US there was even discussion about retiring the national debt), and investing in paper assets like government bonds to provide future incomes in retirement. Inflation collapsed (you could argue that central banks, despite becoming fierce inflation fighters over this period, starting with Paul Volker taking over at the US Federal Reserve in late 1979, should take little credit here; the demographics did the heavy lifting) and 10-year US Treasury bond yields halved from nearly 13% at the start of the 1980s to 6.5% by the end of the 1990s.
You can see that the demographic model of the long-dated gilt yield regressed against the ratios of demographically ‘productive’ cohorts to ‘unproductive’ cohorts fits very well with the actual outcome for the bond market (see Figure 2).
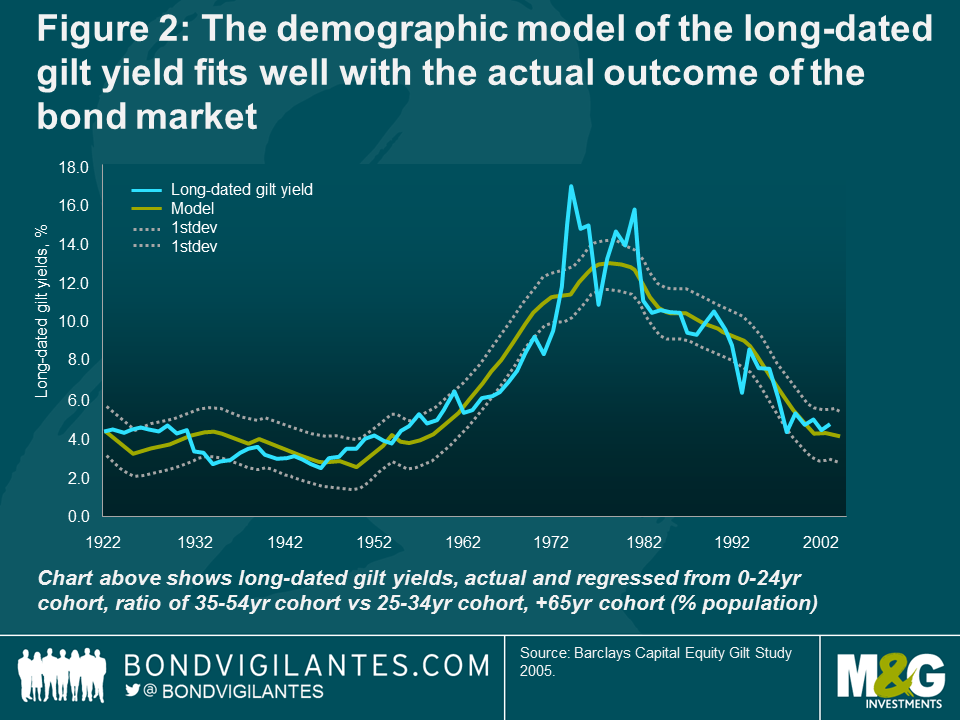
I remember being very keen on these models at the time, but I could never get a good answer to why one particular bond market had stopped behaving. Japan had already hit its peak benign demography in 1990 (about 15 years ahead of the West), and was well on the way to seeing its population’s elderly share accelerate. Life expectancy was the best in the world, and together with low birth rates and retiring baby-boomers, its dependency ratio was deteriorating rapidly. Yet despite the demographic bond models predicting rising inflation and yields, the opposite occurred. At the start of the 1990s, Japanese Consumer Prices Index was around 2.5%. By the end of 2009 it was -2% a year. Ten-year JGB yields fell from 7% to 1.3% over the same period. “Ah, Japan is ‘different’, let’s not worry about Japan”, I was told. But just as the models broke down there, they broke down everywhere.
Figure 3 shows a UK demographic model of long-dated gilt yields produced in 2005 (again, the US model looks very similar). The final forecast data point roughly corresponds to where we are now in 2016. Long-dated gilt yields should be…12%. They are currently around 1.3% at 30 years. If gilt yields actually were at 12%, the current 30-year gilt would be priced at 32 pence in the pound, rather than at £1.54. To do a very, very ‘back-of-an-envelope’ calculation, the annual interest cost of servicing the UK national debt is currently about 3% of GDP. If yields were 9.6 times higher, as predicted, the debt service cost would be 29% of GDP (or about 75% of tax revenue, using 2015 numbers). For comparison, in 2016 only Brazil, of the major emerging market economies, offers a yield of over 12%. To get 12% in the junk bond markets, investors would currently need to look at distressed energy names and weak CCCs.
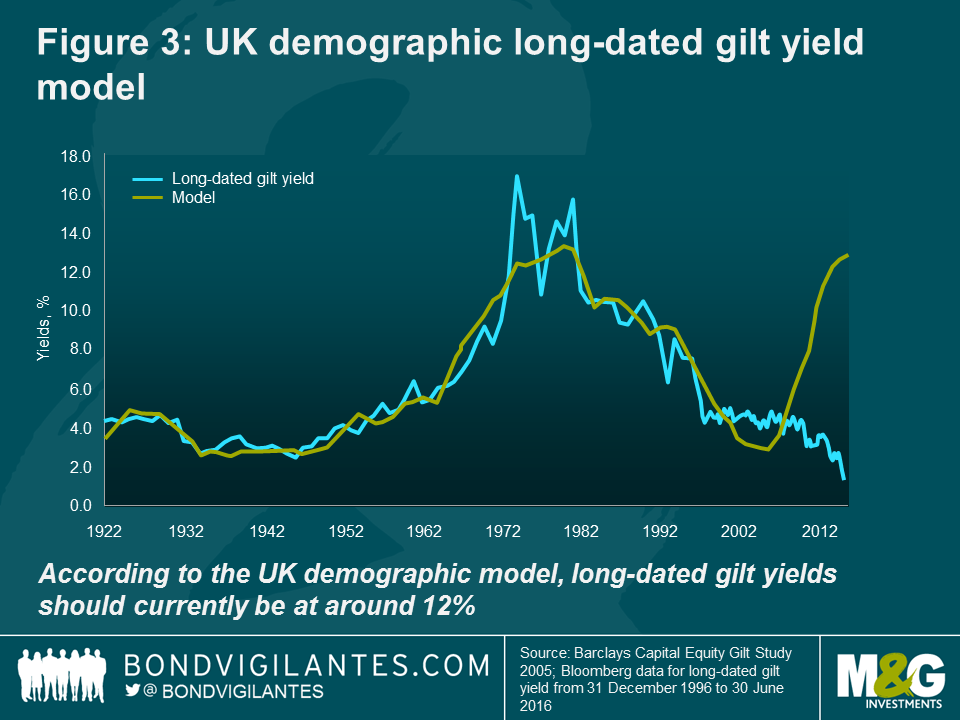
It’s clear then that what looked to be very reasonable demographic bond models 15 years ago, look foolish today as we hit all-time lows in bond yields and live with persistently low inflation and deflation. These are the reasons it all went wrong:
In short then, globalisation (both of trade and the movement of people) and technology have reduced the ‘damage’ that an ageing population can do to an economy in terms of causing inflation. And, in fact, they have overpowered demographics to leave bond yields in a different paradigm than any model might have predicted. Budgetary challenges around the provision of pensions and healthcare to older people remain key, however, especially in a globalised world where taxes are more difficult for nations to collect. The simplicity of demographic models was attractive, but what worked in a closed economy failed in a connected world.
[1] Alan Johnson, Please Mister Postman: a Memoir, Bantam Press, 2014.
[2] Martin Ford, Rise of the Robots: Technology and the Threat of a Jobless Future, Basic Books, 2015.
Conventional wisdom suggests that equity markets are more diverse and better-performing than bond markets, particularly from an active investor’s perspective. However, the evolution of the highly dynamic corporate bond market counters this view. Over time, credit markets have matured to become an increasingly significant asset class, now offering a far broader range of investment opportunities than in the past.
Historically, companies have mainly financed their activities with debt, equity, or a combination of both. Equityholders have responsibility for the operation of the firm through the election of a board of directors. The dividends that shareholders receive in return for an allocation of capital are not guaranteed and are paid at the discretion of the board. In contrast, bondholders are promised a coupon and thus know the rate of return on their investment. Bondholders have no rights of control on the company unless there is a missed coupon payment on the bonds, in which case bondholders have the right to foreclose on assets or force insolvency.
The decision to increase or decrease leverage depends on market conditions and investors’ appetite for debt. The last 20 years have generally favoured debt financing, as interest rates and bond yields have fallen and investors have gained greater access to capital markets. Investment grade companies, in particular, have increased debt issuance, while the market has also opened up for lower-rated bonds. BB and B rated companies have been raising capital through sizeable new issues of debt and equity.
In plain terms, investors looking for a combination of income and capital returns start with a choice between investing in the three main investment classes – cash, bonds and equities. Traditionally, each asset class is perceived to be progressively more risky and therefore offers more opportunity for superior investment returns. The table below describes the generalised risk characteristics of these three asset classes, with bonds appearing to be a ‘happy medium’ between cash and equities. Importantly, given the vast range of available bonds, risk and return characteristics can differ substantially within bond asset classes (for example, bond managers have a choice of investing in either low or high credit quality, and/or short- or long-term issues). This is why the traditional perception of fixed income is too simple. Within fixed income, the corporate bond market is not just an important asset class, but one that provides excellent opportunities for investors if suitable to their personal investment circumstances.
| Asset class | Credit quality | Term |
| Cash | High | Short |
| Bonds | High to low | Short to long |
| Equity | Low | Long |
In reality, the ‘happy medium’ bond market offers diversification via two dimensions: term (more commonly known as duration) and credit risk. In terms of term risk, bonds can be purchased with cash or short-term like characteristics (eg, paying a coupon that is linked directly to short-term interest rates, such as floating rate notes). Alternatively, fixed income securities can exhibit more equity-like characteristics if issued as long-term instruments paying regular coupons and maturing in the distant future (eg, in 15 years or more).
Fixed income’s second diversifying dimension is credit risk (the risk that a company may default on its debt obligations). The variety within the fixed income asset class, in term and credit risk, provides an extensive range of investment opportunities within which it is possible to generate attractive risk-adjusted returns.
Over the past 20 years, the sterling investment grade (IG) bond market has grown in size and depth, as shown by the evolution of the Bank of America Merrill Lynch Sterling Corporate Index in Figure 1.
Developments of note include:
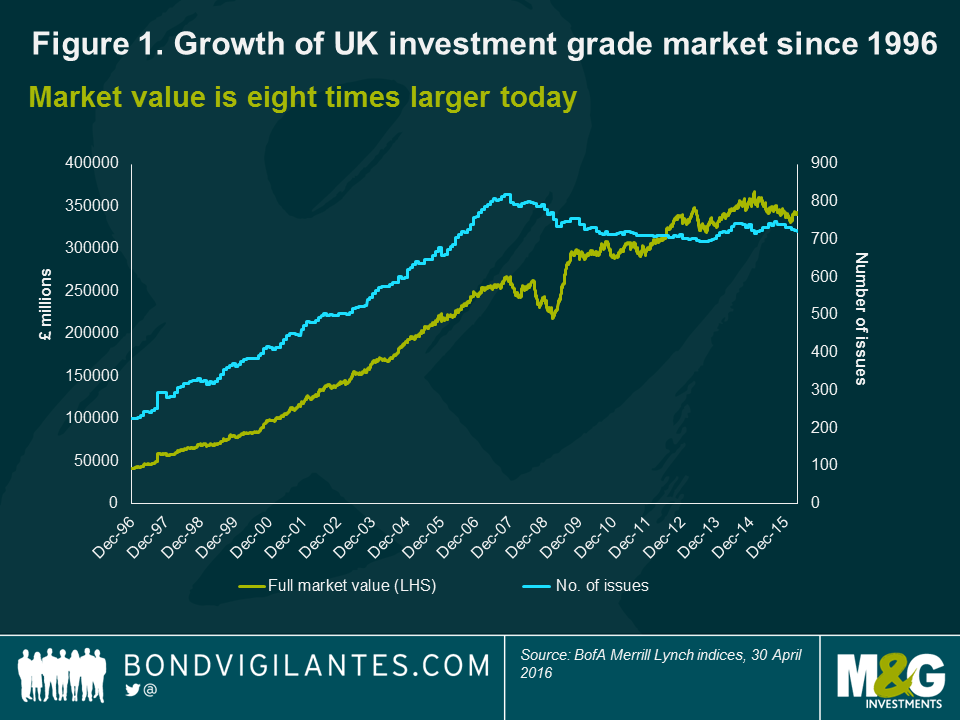
This huge growth in market size provides fertile ground for active investors and the increase in the number of issues available is a large benefit for those seeking diversification.
Having an increasing number of issues and issuers to choose from is positive, but this should ideally occur alongside an improvement in the variety of underlying sectors. As can be seen in Figure 2, the investment universe has evolved – from being dominated by a few large sectors to a much more diversified market, offering the investor greater choice. A prime example is the area of banking and financial services. Where previously these sectors made up 51% of the UK IG corporate bond market, this has halved and now represents just 24%, which highlights the growing prominence of alternate sectors. Such diversity in sectors again allows for a greater spread of risk or, if desired, the ability to focus on lending to sectors that may be considered to be currently undervalued and hence a buying opportunity.
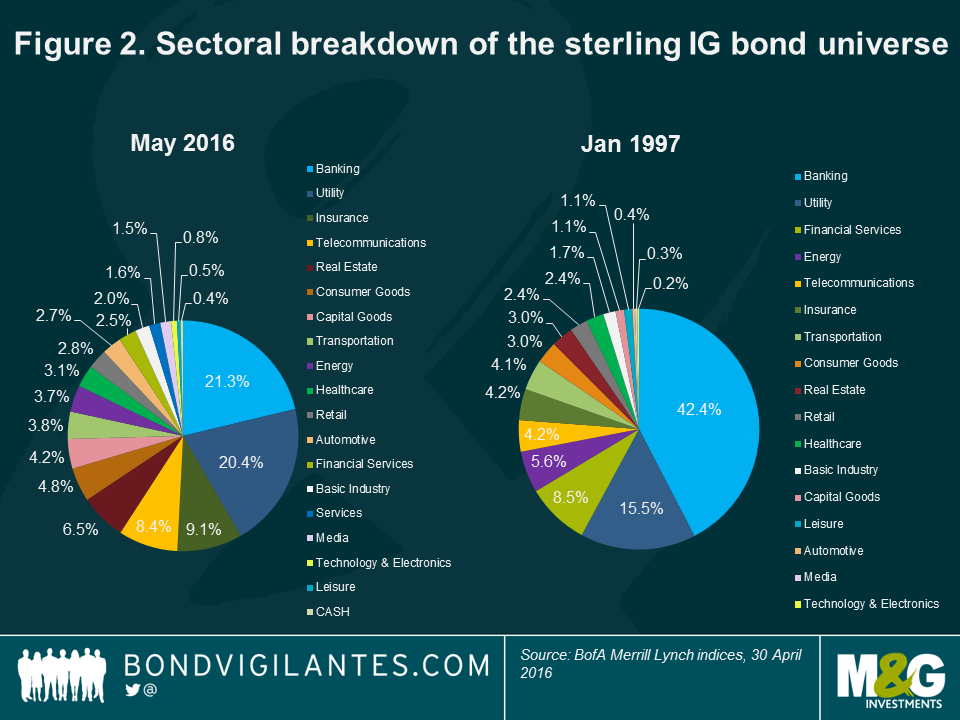
Another dimension that makes the asset class noteworthy is the spread of credit ratings within the investment grade sector. Figure 3 demonstrates how the market has moved from being dominated by high quality, highly rated bond issues in the top half of investment grade, (ie, those rated AAA and AA) relative to the low end of investment grade issues (ie, those rated A and BBB). This is important to investors as riskier, lower rated issues generally offer greater yield. As the probability of default is higher, more value can be added by thorough credit research and analysis. As well as enabling investors to focus on portfolio construction at the aforementioned issuer and sector levels, this also allows them to reduce or add particular types of credit risk at the aggregate fund level.
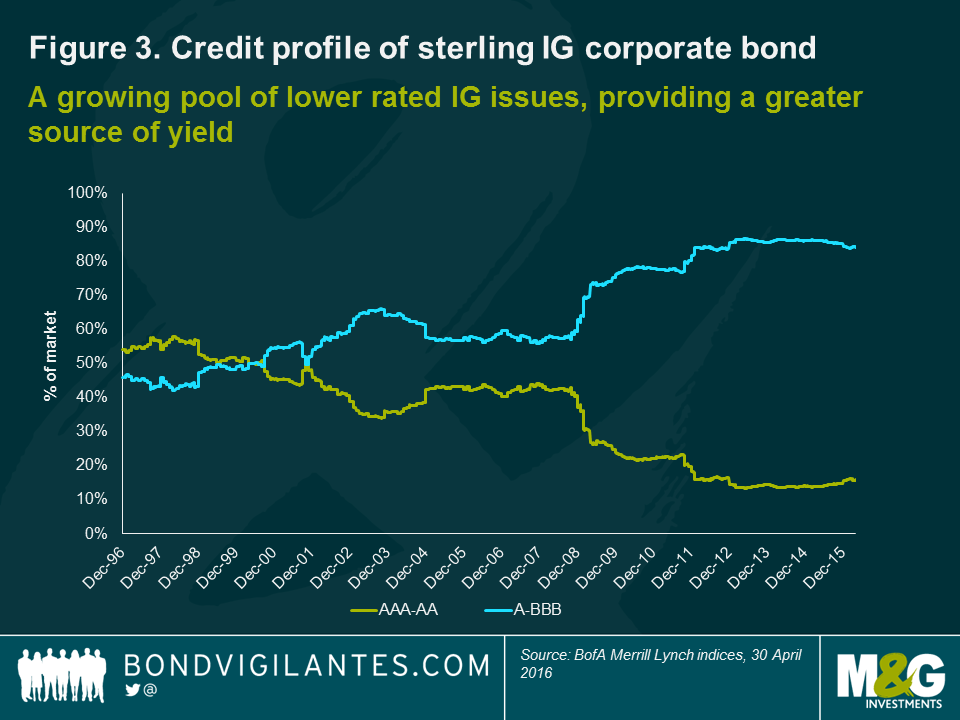
The final characteristic of the UK corporate bond market that has changed over the years is with regards to the term of investments. Figure 4 shows the average maturity range of bonds within the index and underlines how the term has dramatically increased – with 10-year plus issues asserting their dominance over the period. Term is attractive to investors as it makes the security less like cash. Additionally, it enables an investor to express a view on the underlying company. For example, does the company’s immediate future look more attractive than its long-term future? If so, shorter dated bonds may be preferred. Alternatively, if the long-term future is the appeal, it may make sense to choose the more volatile long-term investment in the company’s debt.
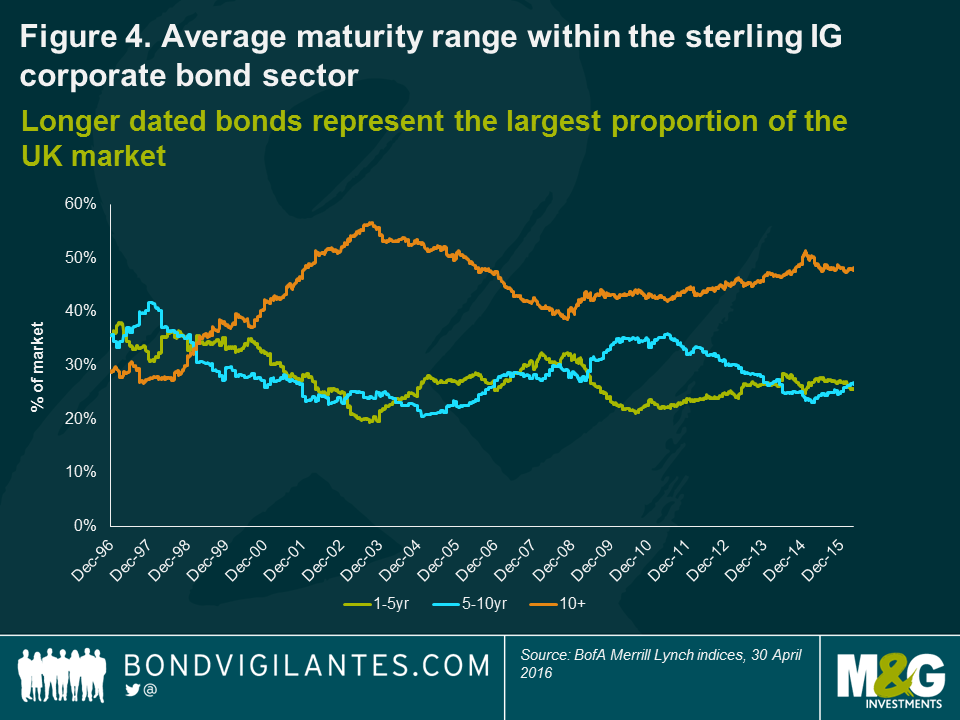
So far, we have focused on the favourable development of the UK investment grade corporate bond market over the last 20 years. However, similar changes have been witnessed in the sub-investment grade, or high yield, bond market. Figure 5 shows a comparable upward trend in both the size and diversity of the BofA Merrill Lynch Sterling High Yield Index.
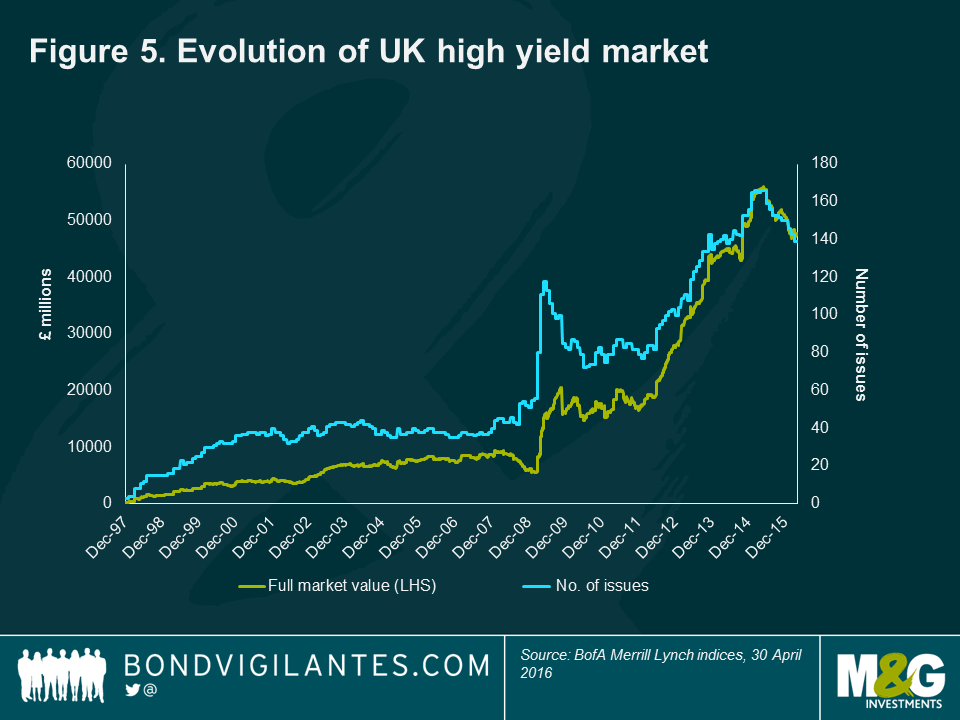
The high yield bond market introduces an even greater range of risk/return profiles available to the corporate bond investor. Given the higher yielding and riskier nature of these bonds, they share even fewer characteristics with traditional government bonds, and instead tend to behave more like equities. This is encapsulated in Figure 6, which compares the annualised return of high yield versus a range of other asset classes, including government bonds, investment grade, and equities over the last 25 years. As can be seen, high yield markets have produced equity-like returns, but with lower levels of volatility. Furthermore, the BofA Merrill Lynch Sterling High Yield Index and FTSE All-Share Index have exhibited a 0.7% correlation coefficient since 1998. As such, in a bond investor’s universe, high yield arguably serves as a credible equity alternative.
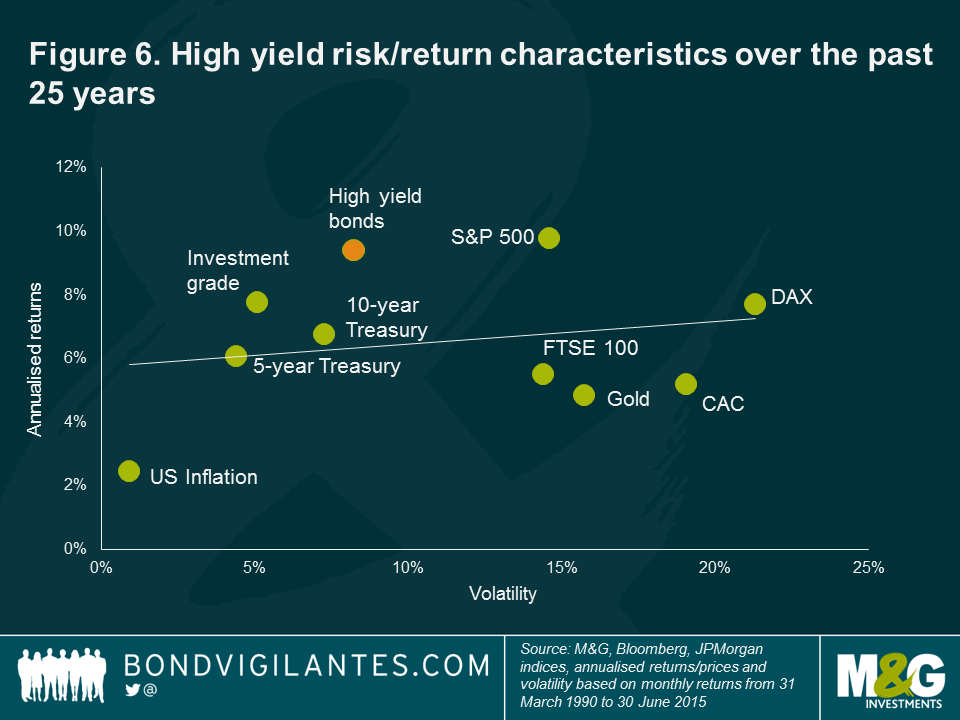
The growth and development of the corporate bond market is not just a UK phenomenon. When we perform the same analysis for the European and US corporate bond markets, a similar story unfolds. The development of the European market, in particular, was significantly aided by the implementation of the single currency, which entered physical circulation in 2002. Indeed, the growth of the lower-rated segment of this market was even more pronounced than in the UK, with A–BBB rated bonds increasing from around 20% of the BofA Merrill Lynch Euro Corporate Index to close to 90% today (see Figure 7).
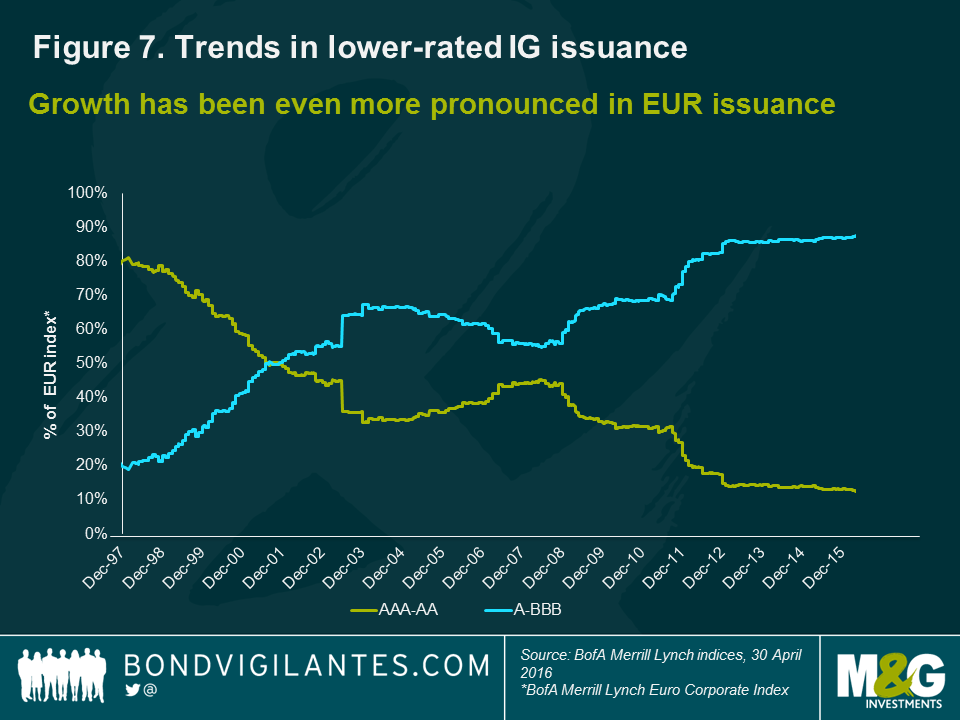
With respect to the US market, the BofA Merrill Lynch US Corporate Index exhibits a similar trend to the UK and Europe, with the number of A–BBB issues also growing significantly. This emphasises once again the growing diversity and attractive investment opportunities that are available in the corporate bond space. Where the US differs, however, is with respect to the term argument. While the UK has witnessed a steady growth in longer dated issuance, the US has experienced the reverse, with bond maturities in excess of 10 years falling from a peak of 59% in 1986 to 28% today. As a result, the three main maturity buckets (1-5 years, 5-10 years and 10+ years) have converged and are now broadly equal (see Figure 8). This is perhaps indicative of a more mature market, although it also suggests that the UK market has potential for further development in the years to come.
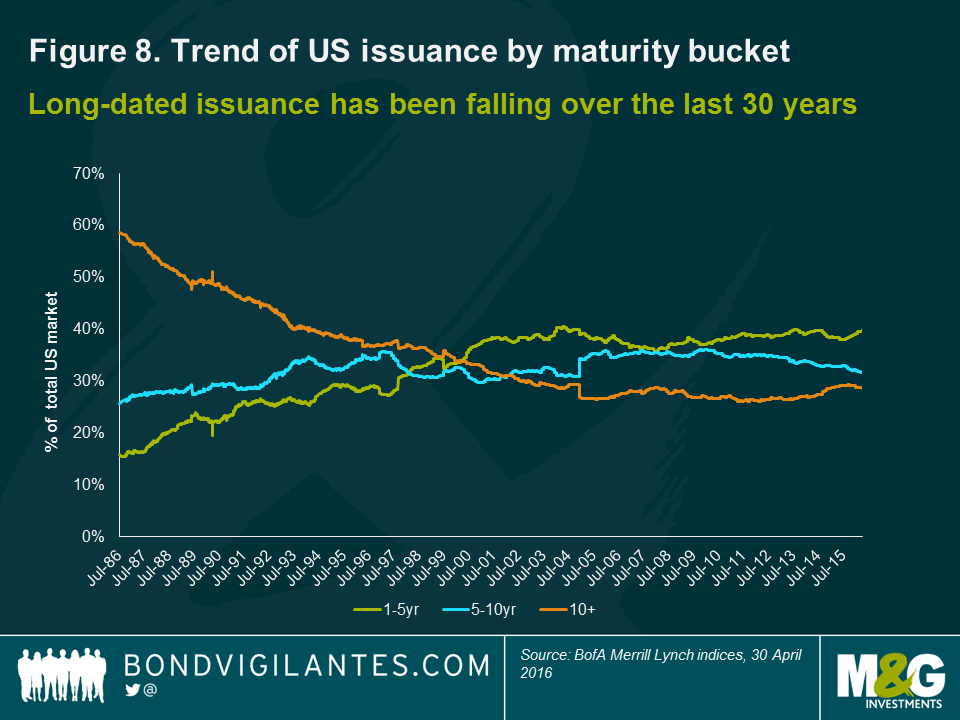
The corporate bond market has developed from a relatively small, undiversified, high-quality, cash-like alternative, to a large and varied market from an issuer, sector, rating and term perspective. It is nevertheless interesting to take a closer look at how this development compares with that of the equity market.
From a sector perspective, the UK equity universe was already reasonably well diversified, so in this respect the corporate bond market was merely playing catch up. While both markets now offer a diverse range of investment opportunities, if we delve deeper and compare corporate bonds versus equities at an individual issuer level, we can see that in some respects the bond markets offer better diversification.
For instance, in 2002 the largest 10 issuers in the BofA Merrill Lynch Sterling Corporate Index represented 32% of the investment universe, while today they account for just 20% (see Figure 9). This is favourable from a concentration risk perspective, especially compared to the FTSE All-Share Index where the top 10 issuer weightings has only fallen from 46% in 2002 to 32% in 2016. This is still a significant proportion of the index, especially as there are 636 issuers in the equity index, compared to only 274 issuers in the corporate bond index. Given the dominance of a limited number of shares and sectors in a typical equity market index, it is important that investors rebalance their equity investments on a regular basis. Failure to do so may result in unintentional stock concentration and high correlations with other asset classes.
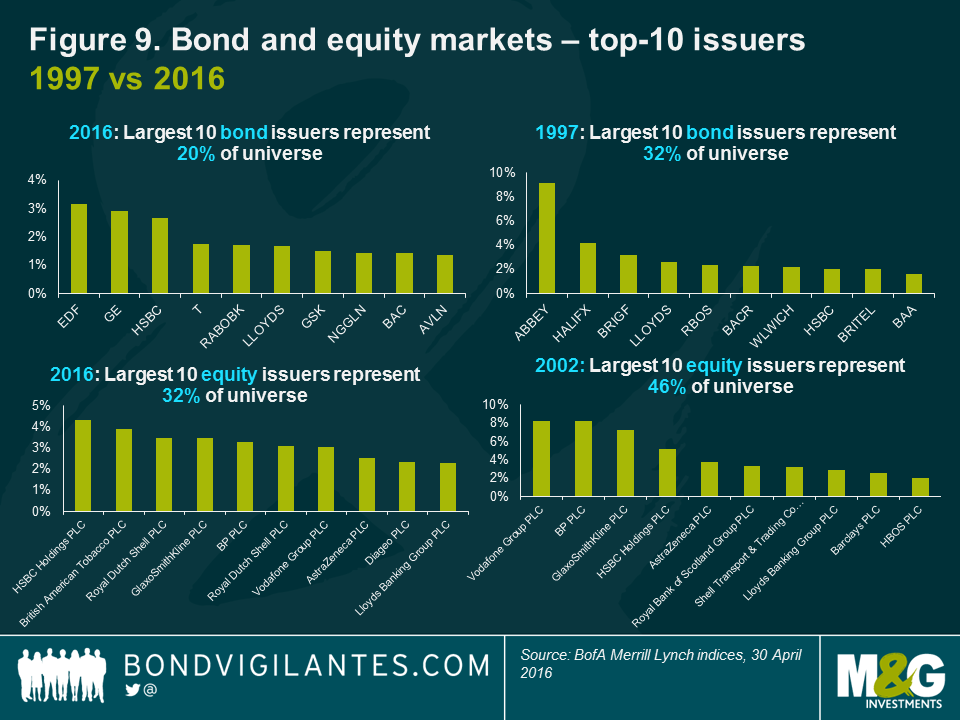
To play devil’s advocate, one of the traditional disadvantages of corporate bonds can be their lower levels of liquidity. The fact that companies issue in a variety of currencies, at different coupons and maturities, can in theory hinder an efficient marketplace. For example, Verizon is one of the largest bond issuers in the market with 77 issues outstanding, across three different currencies. This equates to an outstanding market value of US$93.2 billion versus the equity of just over US$200 billion.
This disparity in issuance perhaps makes the asset class less suitable for a short-term investor who desires liquidity. On the other hand, the fact that so many bonds exist in an imperfect market, provides the active value bond investor with an opportunity to take advantage of anomalies created across the many individual issues.
Additionally, companies will often issue several types of debt from various parts of the corporate structure. For example, banks can issue asset-backed securities, senior, subordinated and junior debt, from either the holding company or through an operating subsidiary. While this differentiation can again hinder liquidity, we believe it ultimately increases the opportunity for active investors to add value through detailed credit analysis and research.
While these sorts of opportunities do also exist in equity markets, it is to a more limited extent. For instance, preference shares are occasionally available, although they are a declining subset of equity markets. The only growing division within the equity asset class is that of voting and non-voting. This has traditionally been used either by management (eg, News Corp) or by the founders (eg, Google, Facebook) to maintain control over the company. However, this division creates little in the way of opportunity for equity investors to add value (and may even be seen as detrimental, as the rights of non-voting shareholders are subordinated to voting shareholders), especially when compared to the ample arbitrage opportunities made available from the slicing and dicing of corporate debt.
UK companies have been, and will continue to be, the main engines of sustainable growth in the real economy. Corporate bonds are an important and growing source of capital for those companies. On the other side of the coin, corporate bond markets cater for active investors seeking consistent cash flows and a greater security of capital than shares can provide.
What the UK corporate bond market may have historically lacked in terms of diversity across sectors, credit ratings, maturities and number of issuers, can no longer be said today. The market has developed from a relatively small, undiversified, high-quality, cash-like alternative, to a large and varied market – from an issuer, sector, rating and term perspective. In our view, the range of corporate bond investments now available makes this class a genuine alternative for asset allocators seeking to capture attractive risk-adjusted returns, a preserve more traditionally associated with the equity market.
As an investor or asset allocator one needs to see if the asset class itself is a potentially attractive place to be. The development of the corporate bond market has created a more exciting asset class when investing. Although, historically, equities have been considered to be the dominant asset class, if investors are looking for the best opportunity set, perhaps they should think bonds first, equities second.
It’s not felt like it somehow, but 2015 has been a bear market for US and UK government bonds, with yields up around 20 to 30 basis points (bps) at most maturities. In stark contrast, European bonds have made new record lows this year – initially as the European Central Bank (ECB) announced quantitative easing (QE) and cut interest rates to negative levels, but again ahead of its upcoming meeting in December where further easing measures are widely expected. German bund yields now have negative yields out to six years, and even Spanish and Italian debt, pricing in high default probabilities as recently as 2012, trades with negative yields at the short end of the curve.
Elsewhere in fixed income, we’ve seen stability in most investment grade corporate bond spreads in the UK and Europe, although some event risk has come back in the market (for example, spreads in VW bonds were hit badly after the emissions scandal). US investment grade bond spreads have underperformed this year as companies issued huge volumes of debt, perhaps in anticipation of yields continuing to rise as the Federal Reserve (Fed) starts to hike rates. The US market has also seen some fundamental deterioration in credit quality: leverage has risen, partly as a result of share buybacks and mergers & acquisitions (M&A) funded by borrowing. US high yield bonds were the underperformer of 2015, continuing the damage started at the end of 2014 as energy-related bonds (rigs, pipelines, exploration and refining) started to discount a prolonged fall in oil prices. And as other commodity prices (copper, iron ore) hit their lowest levels for years, bonds exposed to metals and mining also sold off. Outside of energy and commodity names, however, default expectations remain very low.
If there was a bear market for US and UK government bonds, it was nothing compared to that in emerging markets (EM). Local currency EM debt had an awful year. The Chinese slowdown created fears for global growth, with commodity-exporting developing economies suffering as a result. As these fears rose, outflows from developing world ‘yield tourists’ exacerbated the EM debt price falls. In the local currency space, many EM government bonds now yield more than 7% (Brazil yields over 15%) When coupled with falls in currency of 20-30% against the US dollar, we go into 2016 with a significant improvement in EM debt valuations.
Talking of the dollar, as Fed rate hike expectations grew, the US currency had another very strong 12 months. As one of my highest conviction positions for the last two years, it’s time to ask whether the dollar’s valuation already reflects a world of rising US rates and slow growth elsewhere in the world.
The missing ingredient in the global economic recovery since the Great Financial Crisis has been wage growth. As economies recovered, and corporate profits grew, incomes have improved only modestly. Without consumers seeing improvements in living standards, ongoing demand for goods and services was likely to stagnate. I’ve always said that there will be a time to worry about inflation, and a time to take outright short positions in bond markets, but that time wouldn’t come until wages started to rise at a meaningful rate. As we end 2015, it’s possible that that moment is about to happen – we may be at the non-accelerating inflation rate of unemployment. The NAIRU.
Economists love playing the NAIRU game. Where is it? Has anyone found it? Is it higher or lower than before? Despite the elusiveness of this theoretical concept and building block of modern macroeconomic theory, the implications are wide-ranging and touch everyone earning a wage.
As the prime theory that an economy is operating at full-employment, the NAIRU is of upmost importance to central bankers around the world. Left unchecked, an environment of rapidly rising wages can lead to higher inflation as businesses look to retain profit margins by hiking prices on consumers. It is for this reason that economists closely monitor wage price developments to see if there is any sign that labour-market tightness is leading to higher wages for workers.
In the US and the UK, we now know what the NAIRU is. With the unemployment rate close to 5% in both countries, we have now begun to see the pick-up in wages that central bankers have been waiting for as a sign that their respective economies were on a self-sustaining growth trend (see figure 1).
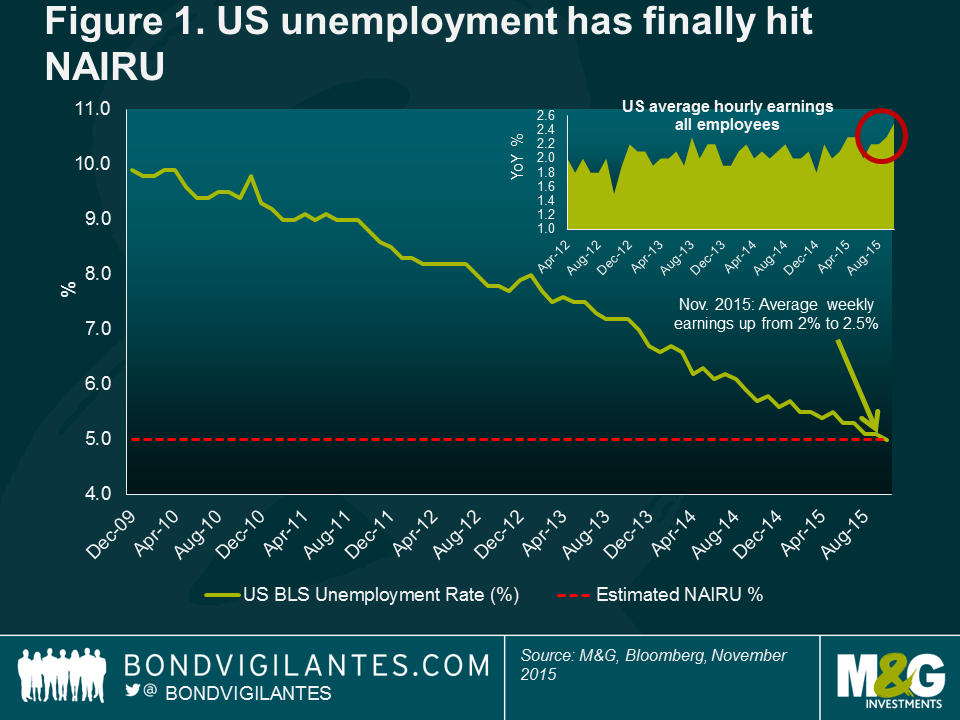
For the Fed, in particular, this is a big deal. Historically, a rising employment cost index (ECI) has been associated with interest rate hikes. Indeed, in the 1990s and 2000s, the Fed increased interest rates in anticipation of a pick-up in the ECI (see figure 2).
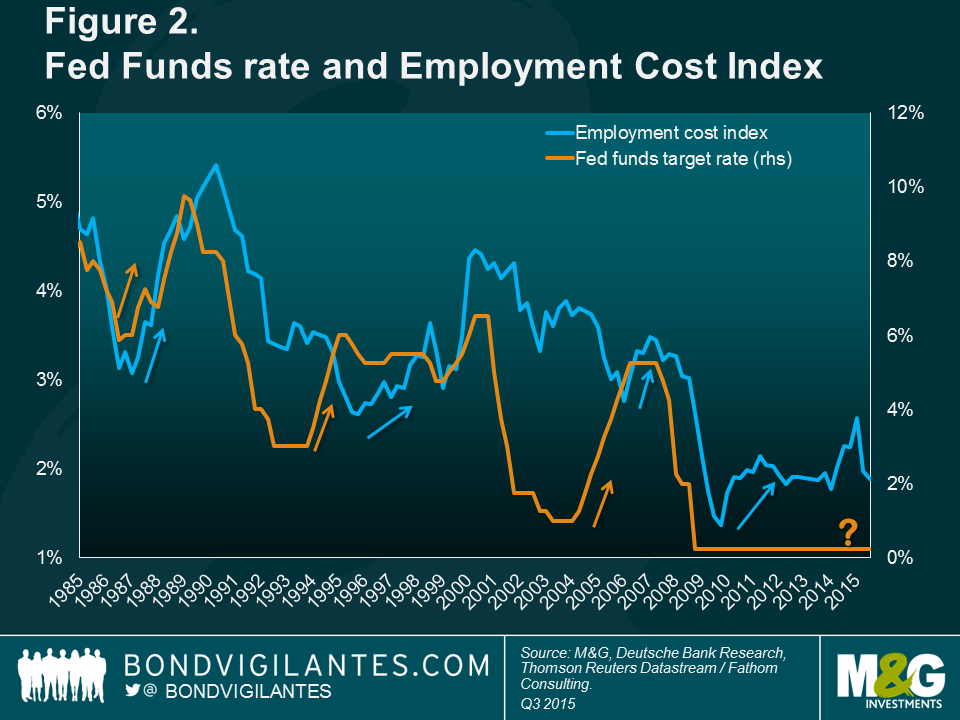
Given the US economy is operating at full employment, we expect the Fed is now ready – finally – to increase rates. The timing of a rate hike from the Bank of England (BofE) is more difficult to call, given the uncertainty surrounding a potential referendum on Britain’s membership of the European Union (EU) in 2016. We don’t think the timing of any rate hike is as important as determining the terminal Fed Funds rate (the rate at which the Fed will stop hiking) in this cycle.
Fed tightening in this cycle will likely be unusually slow, cautious and well communicated to markets. If this is the case, then the reaction in bond markets would likely be relatively benign compared to prior Fed rate hikes. The first move of this cycle is likely to be the so called ‘dovish hike’ – rates go up, but the messaging is designed to not spook global markets. Nevertheless, historically, Fed Chair Janet Yellen’s framework for rate rises (the ‘Optimal Control’ path) suggested that the central bank’s reaction function would be to delay the first hike for as long as possible (tick) before an aggressive, steep hiking cycle. The fragilities of the global economy make this seem unlikely, but if wages continue to accelerate we should brace ourselves for a swifter normalisation of rates than is currently priced into bond markets.
Central banks are currently doing a poor job of meeting their inflation targets, with many economies in the developed world either in or flirting with deflation. The reasons are predominantly the collapse in commodity prices, particularly oil and energy.
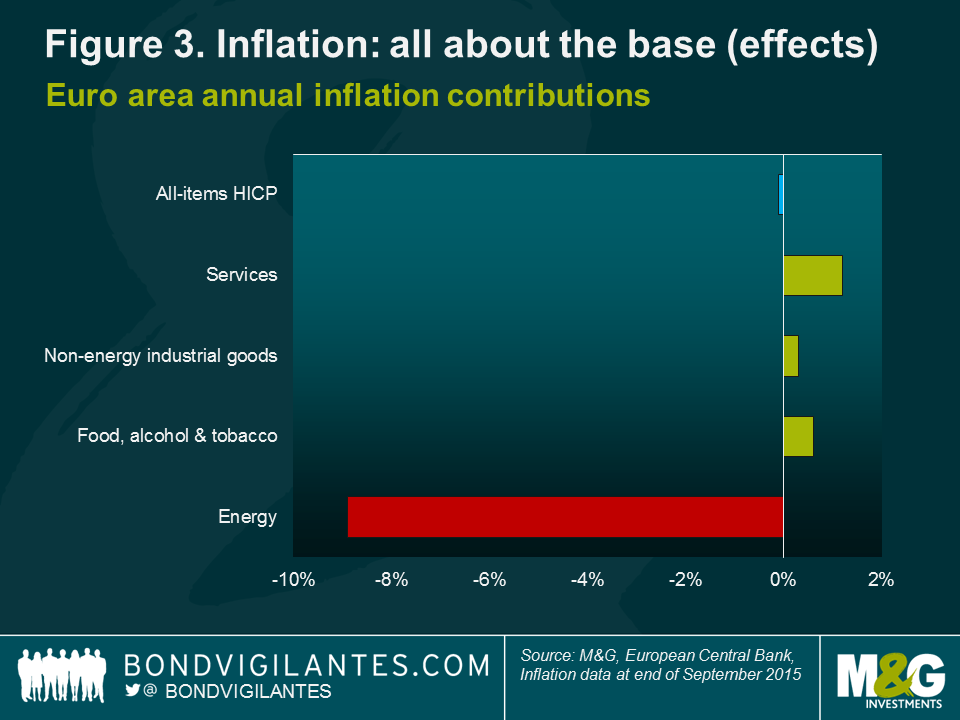
Energy represents 10-15% of consumer price index (CPI) baskets in developed economies, so oil price fluctuations have a significant feed-through effect on headline inflation rates (recent eurozone numbers demonstrate that the energy component of the CPI fell by 9% – see figure 3). This is particularly true in the US where relatively less tax is paid on petrol at the pump (in comparison to Europe where the bulk of the pump price comprises duty and VAT), resulting in a greater direct effect of oil price volatility on the inflation numbers.
It is therefore important to remember the base effects. Base effects occur because inflation is calculated on a year-on-year basis, and therefore the movements in inflation a year ago are just as important in calculating the new inflation number as the recent movements. Because the price of oil fell significantly towards the end of 2014 and early 2015, going forward its effects on inflation are going to drop out. In figure 4, we simulate the effects on inflation in the future should the CPI energy component (of which oil is a big part) stay the same.
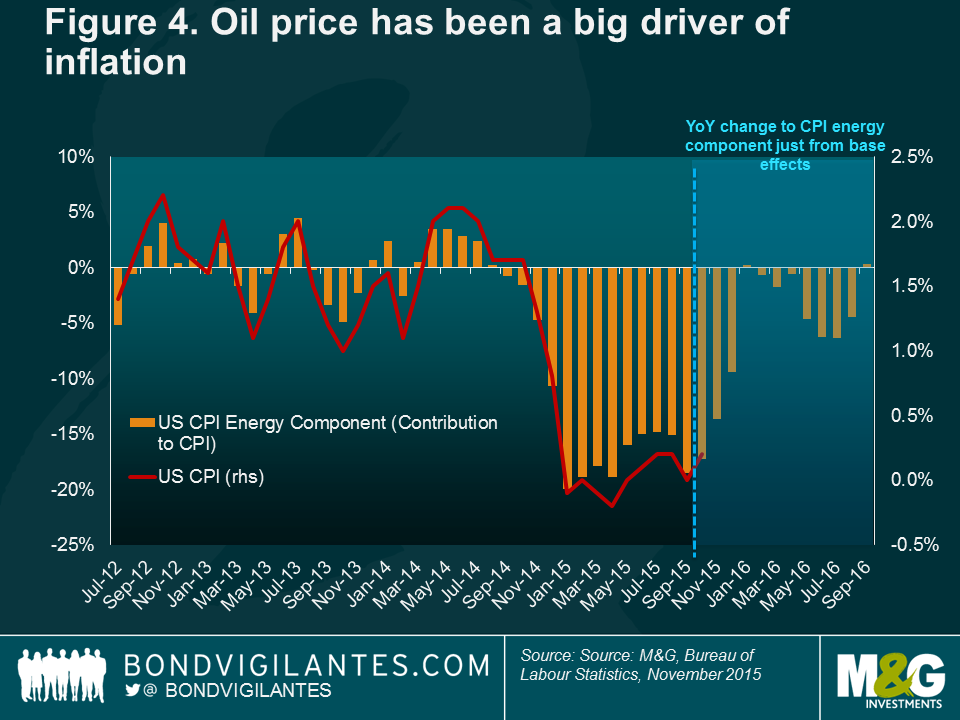
Though not an argument for significant inflation, or even inflation hitting its targets, this does mean that there is currently value in inflation-linked bonds across developed markets.
Quantitative easing (QE) is the process by which central banks inject cash into economies by buying vast amounts of government debt and other assets. This both increases the money supply, and also lowers bonds yields to reduce borrowing costs for corporates and individuals. There’s no agreement about how powerful these impacts are, but almost all estimates suggest that QE works in boosting both growth and inflation. But if QE works on the way in, what happens on the way out, when central banks stop buying bonds, and instead actually start selling down their holdings? Most of us think that large-scale selling of the QE bond holdings is unlikely (the BofE has said that sales wouldn’t commence until we’ve had a series of rate hikes to 2%), but there is another place that a quantitative tightening (QT) effect (higher yields leading to lower growth) could come from (see figure 5).
After years of stockpiling foreign currency reserves, the financial community is currently debating the impact of emerging economies turning from massive buyers to massive sellers of reserve currencies and bonds. QT is the theory that capital outflows from EM economies have resulted in large declines in foreign exchange reserves as EM central banks raised cash to facilitate a fiscal easing and to support exchange rate intervention. Because these reserves are typically held in government bonds – like US Treasuries and German bunds – this process has resulted in a surge of bond sales by EM central banks. This is particularly true in China, where foreign exchange reserves have fallen by over $500 billion in the past year as the government has been selling government bonds to control the depreciation of the renminbi.
While we should be nervous about the impact of continued liquidation of US Treasuries, gilts and bunds as EM growth remains weak, there is another powerful opposing force that continues to support the US Treasury market, in particular. Since European interest rates went negative (in the eurozone, Denmark, Switzerland and Sweden) and sent yields tumbling across the curve, investors in the region have been desperate to find attractive income-bearing opportunities. Many have fixed liabilities to match that can no longer be satisfied in the European bond markets. So capital has been gushing into the US, and so far, at least, foreign ‘non-official’ purchases of US Treasuries are outweighing the sales from the EM central banks. Even when fully hedged to remove currency risk, selling domestic bunds and buying dollar-based Treasuries results in a significant yield pick-up, with no additional credit risk. The balance of these two dynamics – QT versus European yield hunting – will be critically important for both the speed of any US Treasury sell-off and the future path of the US dollar.
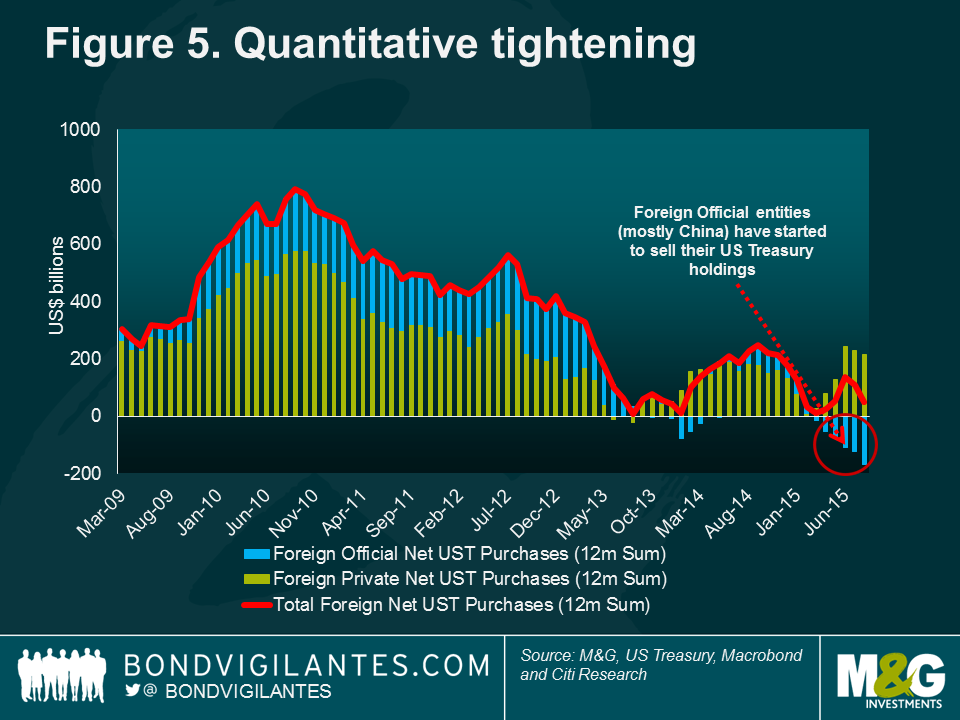
The Federal Open Market Committee (FOMC) meets eight times a year and currently consists of 10 participants, each of whom casts a single vote on the interest rate policy for the US. These voters consist of the five-person Federal Reserve Board of Governors (appointed by the US President) and five Federal Reserve regional bank presidents. Of the latter, one vote stems from the Federal Reserve Bank of New York President (William Dudley) who serves on a continuous basis and the remaining four votes originate from regional bank presidents who serve one-year terms on a rotating basis. An additional seven non-voting Reserve Bank presidents therefore attend the meetings of the committee, participate in the discussions and assess the risks to the long-run FOMC goals of price stability and full employment. All 17 members contribute to the FOMC ‘dot plot’ forecast for the path of future interest rates.
On 1 January 2016, the current four voting FOMC regional bank presidents will be rotating, replaced with four members from the non-voting pool of regional bank presidents. Heading out are presidents Lacker, Lockhart, Williams and Evans – most of whom are known for their ‘dovish’ lean and propensity to keep rates on hold given their labour market concerns. These FOMC doves are being replaced with the incoming Rosengren, Bullard, Mester and George – the latter three being some of the most vocal Federal Reserve ‘hawks’; bullish on the US economy, concerned about the inflation outlook and more inclined to raise rates sooner rather than later (see figure 12). (Although Rosengren is a dove, he is considered less dovish than predecessor Evans). On face value, one could surmise that this hawkish swing will result in a more definite and quicker pace of interest rate hikes in 2016.

What’s a central bank president to do? Having averted the eurozone crisis with his famous “whatever it takes” speech in 2012, and convincing the more hawkish members of the ECB Governing Council to embark upon QE to the tune of €1.1 trillion this year, ECB President Mario Draghi continues to desperately seek an answer to the deflationary malaise in which the economy currently finds itself. In November this year, Draghi told markets that the ECB “…will do what we must to raise inflation as quickly as possible. That is what our price stability mandate requires of us.”
There is widespread speculation that the ECB will undertake further easing measures in order to deliver on its price stability mandate of close to, but below, 2% inflation. These include expanding and extending its asset-purchase programme, adding to the composition of asset classes that are eligible for ECB purchases, as well as cutting interest rates further into negative territory. Previously, Draghi said that “we are at the lower bound”. This appears premature; the central banks of Switzerland, Sweden and Denmark have all maintained negative interest rates into 2016 (see figure 6). There is no reason why interest rates could not go deeper into negative territory.
With the ECB likely to lower its forecast for economic growth in 2016-17 and given the extent of monetary easing that has already taken place, it is clear that the eurozone economy is not in a healthy state despite signs of improving consumer confidence. Concerns around the possibility of Greece leaving the eurozone, political risk in Spain and Portugal, and a lack of any real progress towards a fiscal and political union are likely to continue to weigh heavily on investors’ minds in 2016 and beyond.
The trends evident within the European macroeconomic landscape have several implications for investors. Firstly, the euro is likely to come under further pressure given the different policy biases of the ECB and the Fed. A gradual decline in the euro may result over the course of 2016, with parity to the US dollar a potential reality. A negative ECB deposit rate and higher Fed Funds rate is at the core of this prospect as capital flows out of the euro area in search of a positive return.
Secondly, ECB action is likely to support the front end of the yield curve in the short term and may see support for yields with longer-term maturities. However, we see little value in owning European government bonds at these low yield levels, given the risk of an upward surprise in inflation rates and limited potential for upside capital returns. Indeed, with a third of the European government bond market trading with a negative yield, it seems preposterous to lock in a negative return unless you believe that Europe is entering into an economic depression.
Thirdly, European corporate assets – like asset-backed securities and corporate bonds – may increasingly come into scope for ECB asset purchases as it attempts to encourage banks to lend into the real economy. In this type of environment, high-quality corporate bonds may be the biggest beneficiary of a large buyer like the ECB stepping into the market.
Finally, a further cut in ECB deposit rates could have a negative impact on bank profitability as net interest margins are further squeezed by lower interest rates. There are also fears that domestic lenders in Spain could be forced to pay billions of euros in compensation to customers whose mortgage contracts were found to have illegal interest rate floors. Additionally, life insurance companies face further pressure in an environment where it is difficult to generate positive real yields from risk free assets.
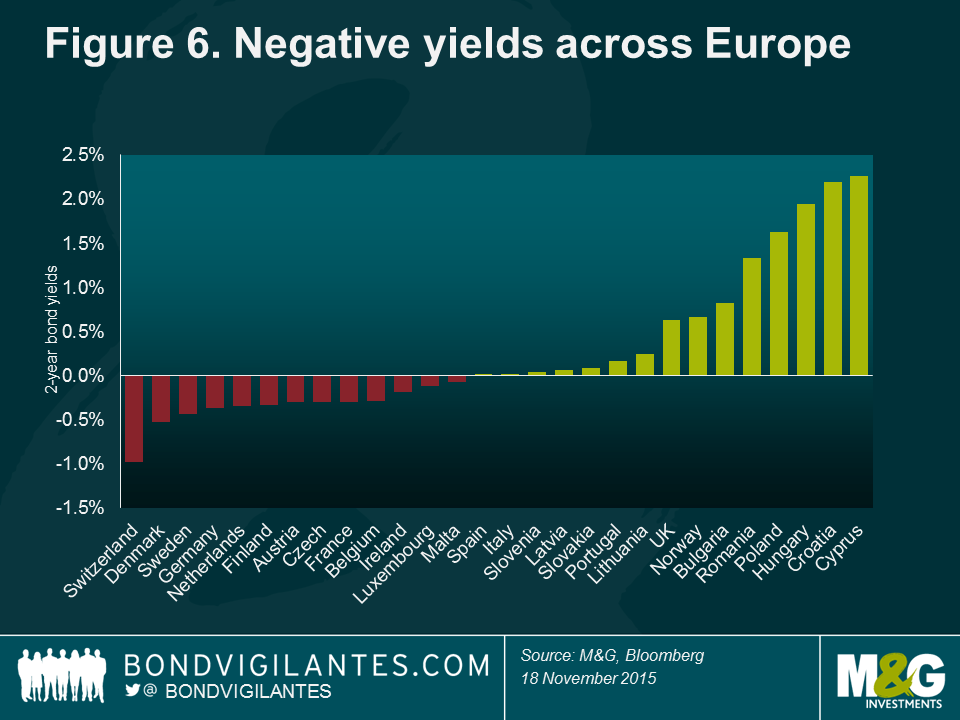
There are two significant supports in place for credit markets as we go into 2016. First of all, credit spreads in both investment grade (IG) corporate bonds and in high yield (HY) are likely to overcompensate for expected default rates (so hold-to-maturity credit investors are likely to outperform investments in government bonds); secondly, in a world of low or negative yields in government bonds, investor demand for credit remains firm.
In particular, we think there’s some excellent fundamental value in long-dated US BBB rated bonds, where we can find spreads of 250-300 bps over US Treasuries in companies we like (see figure 7).
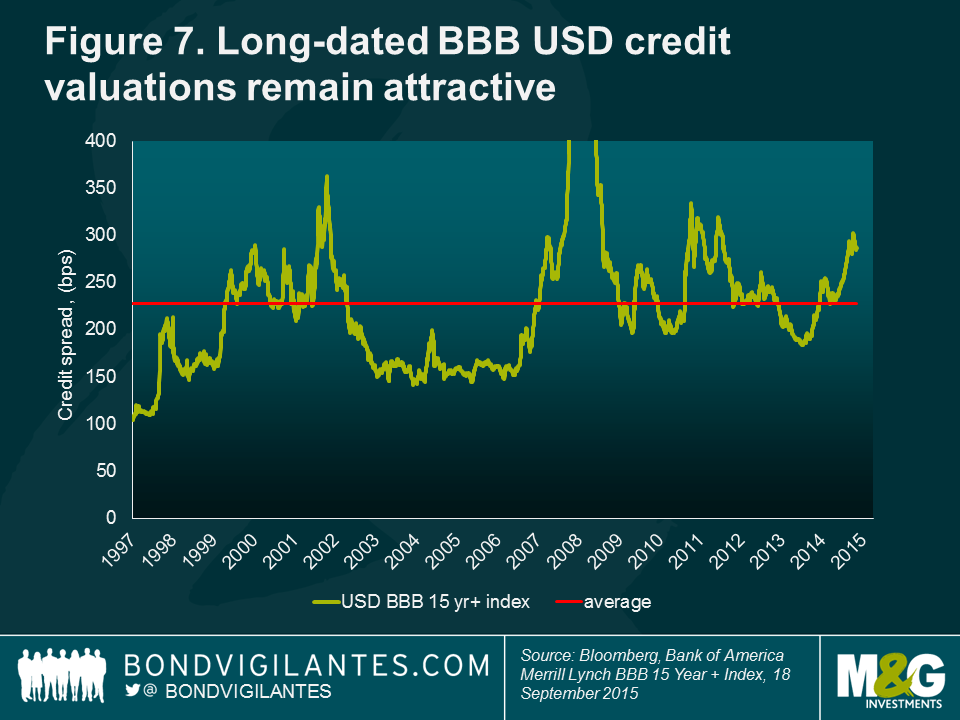
US investment grade underperformed in 2015 due to the weight of issuance there as companies anticipated the start of the Fed hiking cycle. As a result, the pick-up in yield over European investment grade debt is now over 2% at the index level (see figure 8).
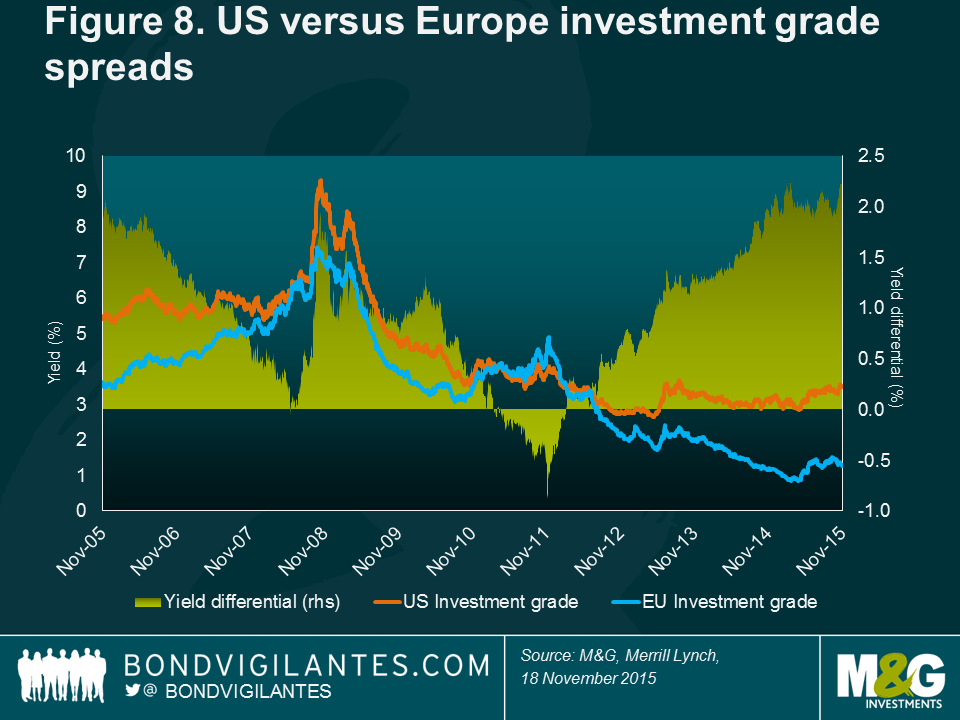
While there is a perception that credit is expensive, it’s worth noting that over the past 20 or so years global corporate bond spreads have been tighter than they are now 73% of the time and, after the widening in spreads we saw in August and September, my global bond strategy was to add credit risk, both in investment grade and high yield.
This doesn’t mean that there aren’t challenges. We think a good portion of the ‘overcompensation’ that credit investors get for investing in the asset class isn’t about credit risk, but liquidity risk. There were a couple of days in 2015 when credit markets all but closed down as risk appetite disappeared. Managing liquidity risk in a portfolio is equally as important as choosing the companies you lend to: this might mean running with more cash or government bonds than you might like ideally, it might mean avoiding smaller or complex bond issues, and the use of credit default swap (CDS) indices is important as an extremely liquid way of adding or removing credit risk from a fund.
Other challenges relate to increasingly poor behaviour from corporate bond issuers. For example, bond investors don’t like debt-financed M&A that results in ratings downgrades, or bonds being issued to do share buybacks (or to buy the business owner a third yacht). This kind of issuance is coming back to the market, and corporate leverage is edging up. So the tailwinds of improving corporate fundamentals are no longer with us, and there’s also been a pick-up in idiosyncratic risk (the VW emissions scandal, for example, which saw its 10-year bonds fall by around 10%) and a sector-specific pummelling: high yield energy bonds have seriously underperformed as the oil price collapsed (see figure 9), with many bonds now priced at distressed levels (commodity names, like Glencore, suffered as well). Defaults will pick up from the 2.5% global high yield annual rate, but with high yield spreads at 6% over government bonds there is room for the asset class to outperform.
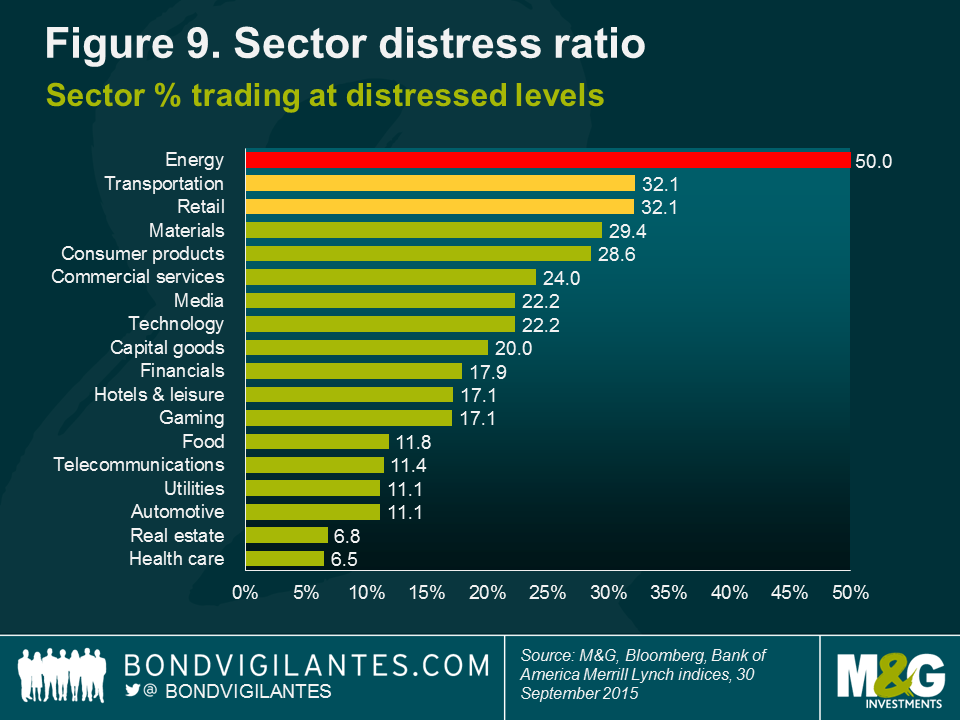
Emerging Market (EM) countries have been an important source of economic growth since the financial crisis of 2007-09. Initially, it was the huge fiscal stimulus, particularly in China, that gave global trade and activity a lift. More recently, it has been a significant leveraging of EM corporate balance sheets that has helped to support growth. In 2015, these factors began to diminish, resulting in lower global growth and turmoil in many EM asset classes.
EM assets were hit by a number of key events throughout 2015. The unwinding of a multi-year bull market for commodities has been damaging for even those countries that would have normally benefited from lower input prices. For example, Turkey should have been a huge beneficiary of lower oil prices, as oil imports represent roughly 60% of the country’s trade deficit. Yet, a toxic combination of geopolitical worries and policy mistakes overwhelmed Turkey’s sovereign balance sheet improvement. In Brazil, the currency plummeted after a corruption scandal and continued wavering on economic reforms by President Dilma Rousseff. Turning to Asia, the region has suffered negative growth spillovers from China, resulting in a slowdown in trade within the region.
We have held back from investing in EM assets over the past few years, waiting to see what impact a slowdown in Chinese growth would have on EM bonds and currencies. Additionally, we observed that companies in EM economies were gorging on cheap foreign currency funding since the Great Financial Crisis and credit valuations, in particular, appeared expensive to us. EM economies now face rising credit costs, slowing bank earnings, decelerating credit growth and weaker economic performance. Particularly worrying was the impact that higher US interest rates and weaker domestic currencies would have on the ability of sovereigns and corporates to meet their debt obligations. In this environment, EM companies with structural advantages, like low dollar-denominated debt and strong currency hedging practices, are likely to perform better than their peers.
One mitigating factor could be EM currency reserves, but we note that these now appear to be falling. Also, an important distinction between the 1990s and early 2000s is that the build-up of private sector debt (compared to public sector debt previously) means that the risk of default is now more spread out (see figure 10).
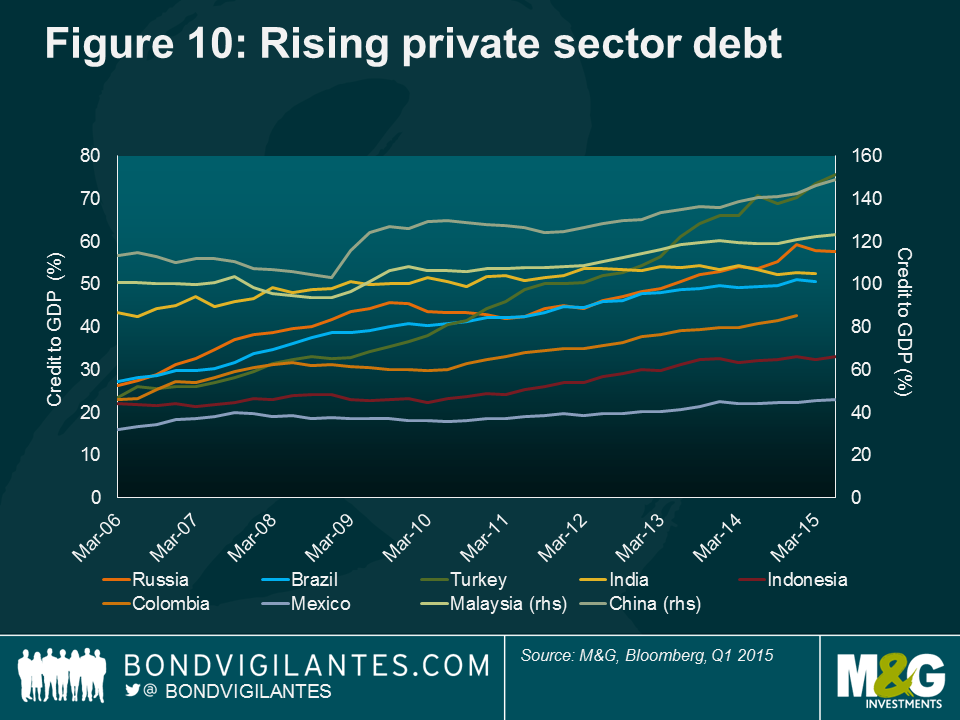
The impact of foreign remittances as workers employed in the large developed world economies send money home to their families was another positive for EM. But from a trading standpoint, the memory of prior EM episodes could continue to restrain risk-taking in EM markets. Any further reversal of capital flows, especially portfolio investment, could continue to reduce the ability of spreads to compress in 2016. While EM has witnessed significant outflows since the 2012 ‘taper tantrum’, reducing the risks of a wholesale exodus, there are still significant risks of further capital flight.
Despite these worries, the tough environment for EM assets in 2015 means that EM valuations are now not as rich as they once were. Emerging economies have been better managed over the past decade and monetary policy is more credible, inflation expectations are better anchored, banking systems are more robust and financial regulatory and oversight has improved. Nonetheless, the two massive elephants in the room – foreign currency liabilities and capital flight risks – present significant tail-risk scenarios for EM. How these risk factors evolve will be a key factor in our determination of the appropriate time to increase exposure to EM bonds and currencies.
Since the middle of 2014, the US dollar index is up by nearly 25%. The dollar’s safe-haven status in a world of renewed geopolitical tensions (Ukraine, Syria), and the economic weakness spreading from China to the rest of the emerging markets explains some of this appreciation. But the rest can be explained by what might be the financial ‘Word of the Year’ in 2016: divergence. Rates are not only likely to rise in the US during 2016, but for the eurozone, Japan and those emerging economies more monetary stimulus rather than less is likely.
In January this year, two-year US Treasury bond yields were at 0.4%, and those in Germany were at -0.1%, a spread of 50 bps (see figure 11). As we move towards the end of 2015, the bond markets are pricing in rate moves in opposing directions, with a 70%+ chance of a December Fed hike now discounted, and the ECB expected to cut its deposit rate down to negative 35 bps. The spread between the two-year yields in the US and Germany is now over 120 bps, making Treasuries look much more attractive and encouraging capital flows into US assets and the dollar.
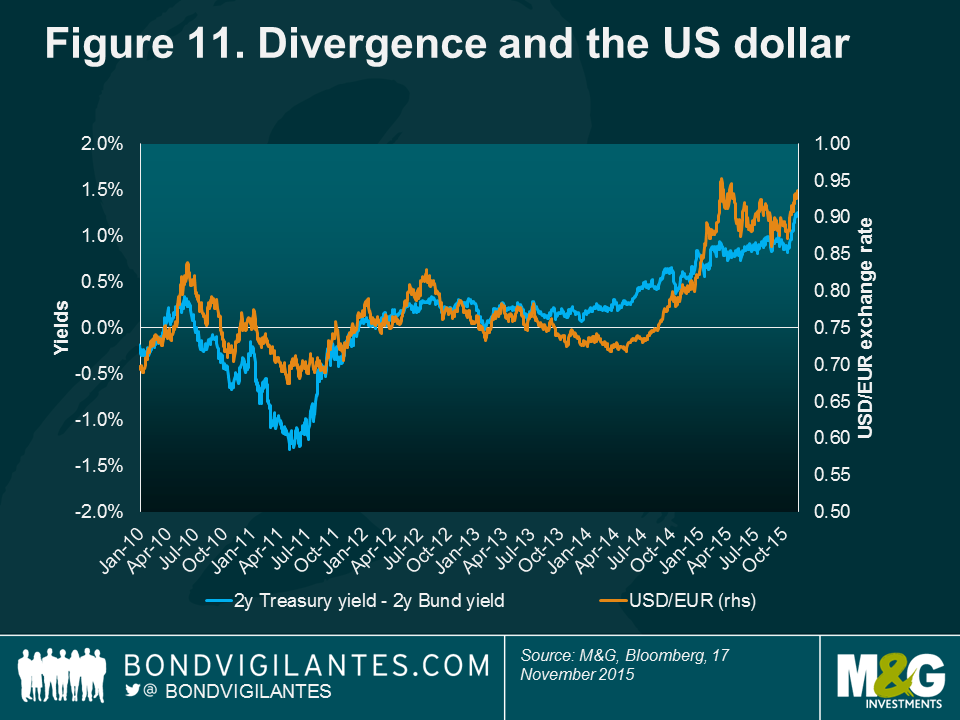
European rates are expected to be negative for at least two years, by which time markets think the Fed will be approaching a 2% funds rate. As a result, both investment and speculative flows into the dollar have increased, perhaps to a level that might limit the potential for future appreciation (a recent investment bank survey showed that long dollar positioning was believed to be the most ‘crowded’ trade in global financial markets). We remain positive on the US dollar, although following the steep falls in emerging market and related currencies (such as the Australian and New Zealand dollars) we have closed out many of our short positions against the greenback.
As divergence continues, we would expect the euro to continue to underperform; but we’re likely to be nearer the end of these currency movements than the beginning. History shows us that the bulk of a cyclical dollar rally occurs in the run-up to the first Fed hike, and some of the fundamental valuation methods for the US currency now don’t make it look so stellar. Purchasing Power Parity (PPP) looks at the relative currency-adjusted prices of goods in different economies and suggests that there should not be significant differences across geographies and they should be able to be arbitraged away. Practically, PPP differentials can persist for long periods thanks to imperfect markets and structural differences, but there is evidence of long-term mean reversion. PPP now has the dollar looking expensive against most other currencies (The Economist’s PPP proxy, the Big Mac Index, has only Switzerland and the Nordic currencies as overvalued versus the US dollar). Other valuation methodologies that look at inflation-adjusted trade balances (Real Effective Exchange Rates) also show the dollar to be dear. At the other end of the scale, despite a perception that it’s a furiously expensive place to visit, the Japanese yen is cheap.
We mustn’t forget also that if the dollar continues to strengthen it will do the Fed’s job for it. Monetary conditions have tightened as a result of the trade-weighted dollar appreciation (although the US is a relatively closed economy, so the impact isn’t as big as it would be for the UK, for example, where we are addicted to imported goods). The pain of the strong dollar has been felt predominantly in the corporate sector (a Fortune magazine headline from October reported: “American companies are in a profits recession: You can blame King Dollar”). US earnings per share fell in the second quarter and are expected to have fallen in the third quarter too, as overseas revenues shrank in dollar terms. In the 1980s, the US dollar appreciated by around 50% against the pound, Deutschmark, French franc and yen, leading to the Plaza Accord in 1985. As calls for protectionist policies grew from US companies and politicians, global central banks met to successfully coordinate a devaluation of the dollar. It doesn’t feel like we’re anywhere near that point yet – and maybe the US can best afford to be the sole ‘loser’ in the currency wars?
Cleveland, 1954. Henry Ford II was showing the head of the auto workers’ union around a new semi-automated Ford car factory and cheekily asked him who would be paying union fees in the future. The union boss replied, “and who’s going to be buying your cars?” This apocryphal story encapsulates the two fears that have taking robotics out of the pages of the New Scientist and into those of The Economist. Firstly, that technology is advancing so rapidly now that robots are “eating our jobs” – and, whereas historically robots replaced tools, they are now replacing workers and increasingly moving up the skills curve. Robots and Artificial Intelligence (AI) no longer just do routine assembly work, but are replacing higher skilled workers in areas like medicine, education and the law. Whilst technology also creates jobs, the start-up success stories of recent years (eg, Google) have extremely small workforces. Secondly, as robots replace higher paid workers, the aspirational middle classes suddenly find themselves unable to buy the ‘stuff’ that keeps our modern economies going. Consumption falls and a deflationary spiral begins. In The Rise of the Robots, Martin Ford’s brilliant book about this process, he suggests that even better education won’t save the next generations from being replaced by machines. To prevent social disaster and economic collapse, we therefore need to consider a guaranteed income for all citizens.
Elsewhere, technology is starting to affect fund managers in other ways. For example, in the last few weeks we’ve been offered satellite analysis of retailers’ car parks to help forecast their sales, and CO2 data from China as a ‘nowcast’ of GDP growth there. The Billion Prices Project scrapes internet data to generate a daily CPI number that tracks the official number (released a month later) pretty well. A company tried to sell me a high-speed internet connection to the ECB’s press conference that was claimed to be several seconds quicker than the mainstream broadcasters’ feeds. This exponential technological progress is already transforming our understanding of the global economy.
In a blog in April 2012, I suggested that a relatively painless way to reduce the UK’s ever-expanding debt burden might be to ‘cancel’ the gilts held on the Bank of England’s balance sheet as part of the QE programme. It’s fair to say that there was some robust pushback from readers (although not as much as I got when writing about Scotland, or electronic money…). Fast forward to today, and this seems like it might be an idea whose time has come, although I’d argue that with the UK economy growing again the need for such extreme measures is much lower now.
But others disagree. There’s a growing academic movement that suggests that a bonfire of both public and private sector debt is urgently needed. And money printing is back in fashion. Modern Money Theory (MMT) suggests that no government that can print its own money should ever find itself fiscally constrained. At times of economic stress, governments should actively create ‘fiat money’ to spend on projects that create full employment. Mass unemployment need not be tolerated. Don’t worry, because resource constraints rather than the money supply cause inflation.[1] Linked to this idea, and central to the ideas of Adair Turner (who has also subsequently called for the cancellation of the QE gilts) in his new book Between Debt and the Devil[2], is a criticism of bond market-funded credit expansion via the banking sector. And as the Bank of England discusses unwinding QE (it will do so when rates in the UK hit 2%), new Labour leader Jeremy Corbyn has said that his government would introduce ‘people’s QE’, with printed money financing infrastructure projects and increased government spending.
While it doesn’t feel as though the UK or US have passed the point where money printing is needed (Europe and Japan on the other hand…), we do need to look at the ever-increasing stocks of both public and private debt in the developed world and ask ourselves whether either economic growth or inflation will naturally erode them. If not, then default, restructuring, or the printing presses may eventually come into play.
[1] For my recommended read on this, see Modern Money Theory: A primer on macroeconomics for sovereign monetary systems, by L. Randall Wray, Palgrave Macmillan, August 2012.
[2] Princeton University Press, October 2015.
A central bank policy member told me recently that, “the least likely path of monetary policy is that priced in by bond markets”. The US interest rate futures market expects a gradual pace of rate hikes towards 2% over the next couple of years. This policymaker’s view was that growth and inflation outcomes are likely to be binary. The inflation soft patch we are in now could be symptomatic of deep problems in the global economy, in which case further monetary easing and unconventional policies will be needed. Or, if the recent wage developments are maintained, inflation could return to target sharply, and rates will need to rise much more quickly than the market expects. We think it’s more likely that we have reached full capacity in many areas of the labour market in the US and UK, and that there is little value in their government bonds.
If we’re right, and recent wage inflation is sustainable, then we should see inflation rates heading back above 1% in the developed economies. A return to CPI levels above central bank 2% targets will take longer, but with inflation-linked bonds pricing in persistent disinflation, we want to buy them. Insurance is a better buy when it’s cheap, and inflation protection is no different.
In corporate bonds, it’s hard to see why default rates should rise much from current levels. Fundamentals are slowly deteriorating, but outside of energy and commodity names, spreads appear to overcompensate investors for the credit risks they take. Liquidity risks remain high though, as the corporate bond market asset growth has been accompanied by a shrinking of the investment banks’ ability and willingness to hold bonds on their balance sheets. We believe investors need to be compensated for both credit and liquidity risk, and to run more in cash and liquid fixed income instruments than they might want to purely from an investment standpoint.
The sell-off in emerging market debt and currencies looks to be the biggest valuation opportunity in global fixed income. Significant risks remain, however, both from the continued slowdown in global trade, but also from domestic politics and fiscal deterioration. We’ve closed out our EM short positions, but are not yet ready to be fully bullish on the asset class.
The dollar tends to do well until the Fed starts its hiking cycle. While the strengthening of the US currency is relatively modest compared to some of its previous bull cycles, and we expect it to continue to outperform into next year as the great ‘divergence’ continues, on some fundamental valuations, and taking into account heavy investor positioning in it, the upside potential is not as great as it was.
2016 could be the year that the UK votes to leave the European Union. Prime Minister David Cameron has said that an In/Out referendum on membership will take place by the end of 2017, and many expect the vote to be held during 2016. Whilst opinion polls during much of 2015 supported the ‘stay in’ vote, the latest data suggests that the majority of responders would now like to ‘get out’. Ongoing economic problems in the eurozone, and perhaps most importantly the perception that Europe’s open borders encourage UK-bound immigration, have recently reversed the tide in favour of Brexit (see figure 13).
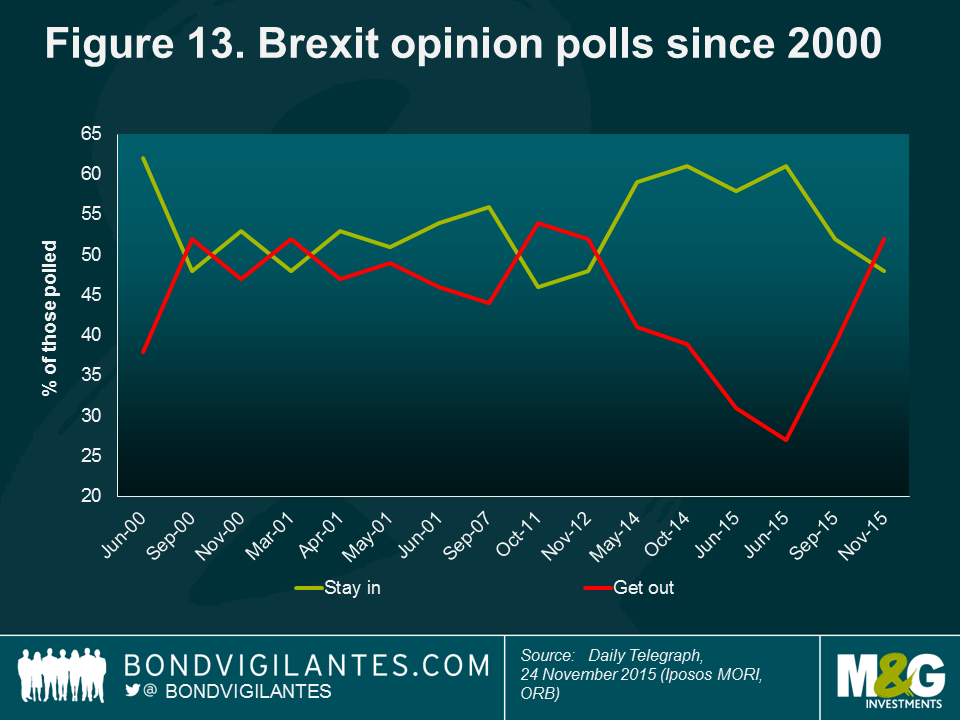
Would Brexit matter? Eurosceptics point to the fact that European companies need the UK more than the UK needs them, given that Britain is a large net importer from the eurozone. They also point to the success of non-EU European states such as Switzerland and Norway, which have free trade agreements with the Union. But with a third of the UK’s gilt market owned by foreign investors, a record current account deficit needing to be financed, and ratings agency Standard & Poor’s suggesting that a two-notch downgrade would follow a Brexit vote, it’s difficult to be too relaxed about the impact of an ‘Out’ vote. The pound has been strong in 2015, largely thanks to rate hike expectations, but it’s probably rational to be nervous about UK assets as the referendum date nears.


Sign up to the Bond Vigilantes mailing list to ensure you never miss a great article from our expert Bloggers. We will email all new articles to your inbox, meaning you can stay on top of the world of Bonds.
I confirm that I would like to receive information about Bond Vigilantes and products and services from M&G Securities Limited.
We will use the email address and personal data you have shared with us to send you this information. For existing customers, submitting your contact details and requesting to receive this information from us, will replace any earlier choices you have made in respect of marketing information.
You can unsubscribe from marketing at any time, at which point we will not send any further marketing information to you, by selecting the unsubscribe link in all communications.