


Emerging market corporate bonds – falling default rates and high yields. Too good to be true?
An improving picture in 2017
With only one issuer defaulting in the first quarter of 2017 (compared to eight in the same period 12 months ago), the emerging market (EM) corporate external bond asset class has until now met expectations that its default rate could be significantly lower in 2017. Improvements in both macro and corporate fundamentals have helped this outcome, providing relief for many EM bond managers who recently had to navigate through a particularly punishing time – following two years of significant macro headwinds and low commodity prices, the EM corporate default rate of high yield issuers peaked at 5.1% in 2016.
There are a lot of misconceptions about defaults in EM debt. Too often, EM corporates are either considered ‘serial defaulters’ compared with their developed market peers, or seen as a single and homogeneous geography. In reality, default rates follow economic cycles, and having a regional, if not country, approach to default risk remains paramount due to different jurisdictions and various recovery values between regions and countries.
Investors also must assess key questions such as whether credit ratings are good indicators of future defaults, along with which countries have experienced the largest number of corporate defaults. This Panoramic Outlook aims to provide an insight into EM corporate default risk within the ever-expanding EM corporate external bond universe.
Defaults, default rates: what do they mean?
Rating agencies have various, albeit comparable, definitions of a default. A widely market-accepted definition is as follows: a missed coupon/principal payment, bankruptcy or liquidation. In addition, when an issuer avoids the aforementioned events of default by compensating bond investors below par, then distressed exchange, buyback and/or restructuring are also regarded as defaults.
Default rates are more problematic, in terms of methodology. Rating agencies all use an issuer-weighted measure which calculates the number of defaulted issuers out of the total sample of issuers under coverage. Some banks also use a similar methodology. Over this method, we prefer the par-weighted measure which calculates the face value of defaulted bonds out of the total stock of bonds in the market or index. In our view, this is a better measure of risk for investors as some issuers have several billions of bonds outstanding while others may have issued only one small bond. If Petrobras defaulted, for example, arguably it would be a bigger event for markets than a small Brazilian corporate with a single US$50 million bond issue. The default rates mentioned in this note, unless stated otherwise, are therefore using the par-weighted method.
EM corporates – not the serial defaulters you may think
Emerging market corporate bonds have become a very large asset class. As at January 2017, hard-currency corporate bonds totalled US$1.85 trillion, of which a majority of outstanding bonds were investment grade (60%), despite the significant number of ratings downgrades that occurred in the past couple of years. Unlike developed markets, most open-ended fixed income funds have a mandate to invest across the universe as a whole, and there are fewer separate mandates by credit quality, in other words, looking only at EM high yield (HY) or only at EM investment grade (IG), as is the case for the US or Europe.
The JP Morgan Corporate EMBI index (CEMBI), one of the most widely used indices for EM corporate bonds, currently yields 4.7%. It can be a commonly made mistake, however, to compare the yield on offer for EM corporates as a whole (IG and HY) with high yield default rates. More relevantly, Figure 1 presents the historical default rates of EM corporates as a whole and for the EM HY segment only: the blue line shows default rates as a percentage of high yield bond stock, while the green line shows default rates as a percentage of total EM corporate bond stock (IG + HY). The former is useful for comparison purposes with developed markets, but the green line is most representative of the actual default risk exposure of investors in the asset class. Between 2012 and 2015, the CEMBI had an average yield of 5.3% while default rates averaged 1.2% in the same period, thus representing an attractive risk/return profile for EM investors.

Another common misconception is that high yield default risk is higher in EM than in Europe or the US. Looking at Figure 2, EM high yield corporate defaults are very much in line with those of European high yield or US high yield. During the last global financial crisis in 2008-09, the EM high yield segment had a lower peak in the default rate than its developed market counterparts.

Bankruptcy laws are critical for foreign bond investors
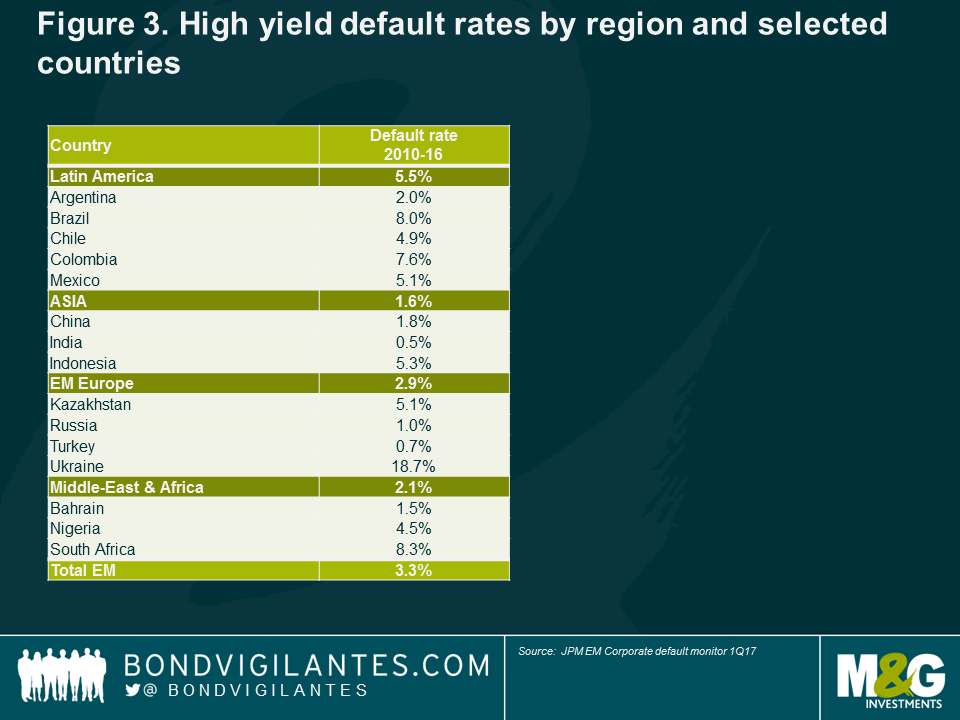
Bond investors, therefore, face similar default rates in EM and developed markets. But it is still necessary to pick the right country. Looking at EM default risk as a single asset class has many flaws because different countries have different sovereign and corporate debt leverage dynamics, banking systems or jurisdiction risk, among other factors. Figure 3 shows that in the past seven years, EM investors experienced significantly more default risk in Latin America (5.5%) – due to high leverage and a few very sizeable bond defaults – than in Asia (1.6%) or in EM Europe (2.9%). Some countries seem to encounter more defaults than others: South Africa (8.3%), Brazil (8.0%) and Ukraine (18.7%) stood out as a poor geographical region to invest during the period in terms of EM high yield corporate default risk.
In addition to the actual default rate, bond investors should pay close attention to jurisdiction risk and recovery values. Best practice should identify bondholders’ rights in an in-court restructuring situation. Is this country bondholder-friendly or is the law rather accommodative with shareholders? The complexity, variety and sometimes lack of evidence of bankruptcy/restructuring laws never make it easy to determine. However, history tells us, for example, that South Africa is seen as a rather bondholder-friendly jurisdiction, while Indonesia has a track record of poor treatment for bondholders.
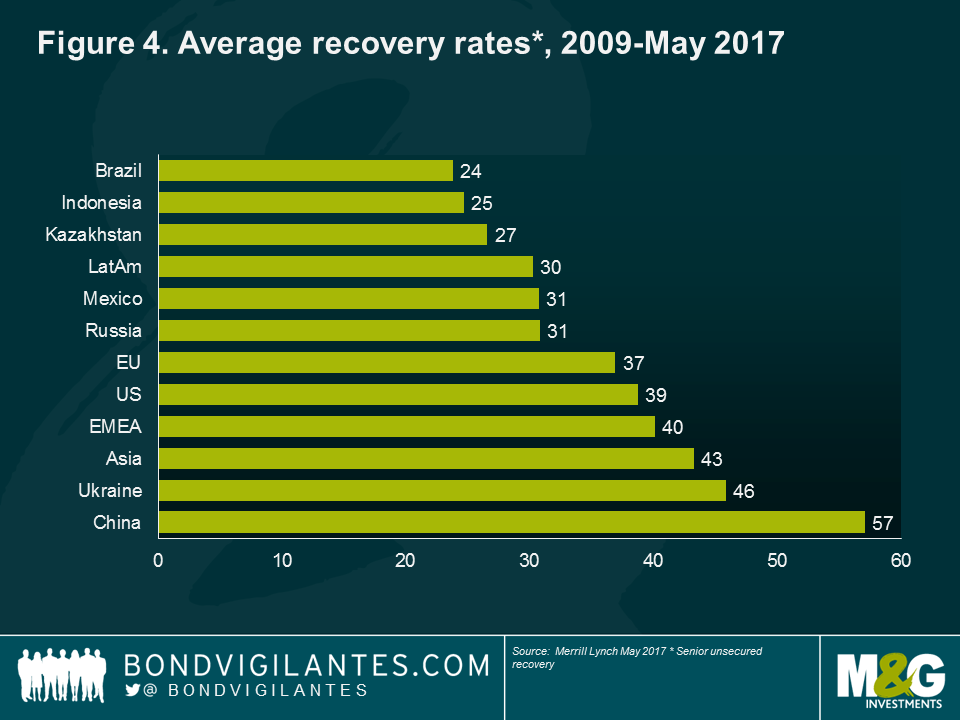
The second step is to identify whether or not foreign bondholders, while on paper often rank pari passu in claims with local banks and local investors, in practice, may end up subordinated to locals in a restructuring. For highly indebted companies in default, this situation may result in poor recovery value for foreign bondholders. For instance, Brazil’s average recovery rate (2009 to May 2017) is only 23.8%, which, coupled with its already very high average default rate, makes Latin America’s largest economy a risky location for EM investors. Kazakhstan and Indonesia are not particularly attractive either, while China and Ukraine top the rankings with 57.1% and 45.8%, respectively, of average recovery values since 2009. At a regional level, Latin America’s recovery rate averages 30.3% and is well below EMEA (Europe, the Middle East and Africa) (40.1%) and Asia (43.2%). It is worth highlighting that the recovery values in the US and Europe averaged only 38.7% and 36.9%, respectively, during the same period and under the same methodology.
Default rates in China defy the laws of traditional credit analysis
Stating the obvious, in-depth and timely fundamental research is critical to avoid single-name defaults, including an understanding of the aforementioned differences in bankruptcy laws and jurisdiction risk.
At a portfolio level, some credit metrics are useful to identify default risk exposure. In addition to improvement/deterioration in operational metrics, gross leverage (total debt-to-EBITDA), interest coverage (EBITDA-to-net interest) or cash-to-short-term debt are among key ratios used to measure the creditworthiness of a bond issuer, a region and sectors. Looking at leverage in particular, EM high yield default rates seemed to follow increases/decreases in leverage (Figure 5): the pick-up in gross leverage since 2011 has resulted in higher default rates in the past six years.
However, as previously noted, the asset class is heterogeneous, and looking at debt metrics does not always work. While default rates in Latin America seem to follow the increased leverage of Latin American high yield bond issuers, Asia high yield bond issuers actually experienced few defaults while their leverage metrics reached what many international investors would consider unsustainable levels of debt. This is mainly due to China, as domestic investors believe that the government will continue to back acceptable outcomes through bondholder-friendly restructurings or bailouts. This moral hazard may change in the future with China currently in the process of allowing more defaults to occur. When (or if) this happens, should default rates start to follow leverage trends as is the case in other regions, we believe there may be a material uptick in defaults in Asia’s largest economy.

Macro matters
A look at historical default rates (Figure 1) is also clear evidence that high default rates occur during challenging economic times. There are several channels of contagion to corporates, the most common being poor domestic demand, exchange rate depreciation, high inflation fuelling increased input cost, limited access to external funding, capital control or any government interference. The elevated 15.4% default rate of EM corporates in 2002 was the result of a number of macroeconomic factors: global market weakness with the technology bubble, the debt default in Argentina, the domestic crisis in Brazil, as well as Indonesia’s struggle to recover from a long period of recession. The 2009 default rate of 10.7% was amid the global financial crisis, coupled with idiosyncratic crisis, such as the banking system blow-up in Kazakhstan. Therefore, bottom-up research is necessary but not sufficient, and macroeconomic views remain critical in selecting corporates as most defaults occur during sovereign crises, although it is never easy to identify whether a sovereign crisis is the cause of the high corporate default rates or the other way round.
According to rating agency Moody’s, 71% of EM corporate defaults occurred during time of crises between 1995 and 2008. Corroborating this analysis, investors may want to look at the more recent history. A couple of years ago, all large Ukrainian corporate bond issuers – except one – defaulted or engaged in distressed-debt exchanges while Ukraine defaulted on its sovereign bonds following heightened geopolitical tensions with Russia. In 2016, Brazil’s high-yield corporate default rate was 9.7% in the midst of the country’s worst recession ever. Yet, a sovereign crisis does not necessarily result in high corporate defaults and it remains a case-by-case analysis. Russian high yield corporate bond default rates were relatively modest at 1.2% and 0.9% in 2015 and 2016, respectively, considering that low oil prices and Western sanctions led the country into recession during the same period.
Rating agencies and bond investors are well aware of macroeconomic risks and incorporate it into their corporate credit ratings. For this reason, EM corporates, in general, are assigned a lower credit rating than their US or European peers with similar credit metrics.
Are credit ratings a good indicator of default risk?
The accuracy of EM ratings in measuring default risk can be analysed through a Lorenz curve. Plotting S&P’s data of EM corporate ratings and defaults between 1997 and 2015 in the curve, only 40% of defaulted issuers had a rating of CCC/C one year before default. To assess the performance of ratings, it is also interesting to look at ratings of defaulted issuers three years before default. In this case, only 20% of defaulted issuers had a rating of CCC/C three years before the actual defaults (over five years: < 20%). Although 97.2% of defaults occurred for issuers rated in the high yield category (BB+ or less) one year before default, according to S&P, in our opinion, the fact that more than half of defaulted issuers were rated B- or above is not a great track record. Is this specific to emerging markets?
According to S&P, the one-year Gini coefficient was 72.7% for EM corporates between 1997 and 2015, against a global average of 82.0% over the past 35 years. The US and Europe stand at much better coefficients of 80.4% and 90.6%, respectively. While it may be expected to see deterioration in the coefficient over several years, the accuracy gap between EM ratings and US or European peers nevertheless widens over time, according to the study by S&P. In our opinion, this is evidence that bond investors should not exclusively rely on external credit ratings to assess default risk. This proves particularly true in emerging markets.
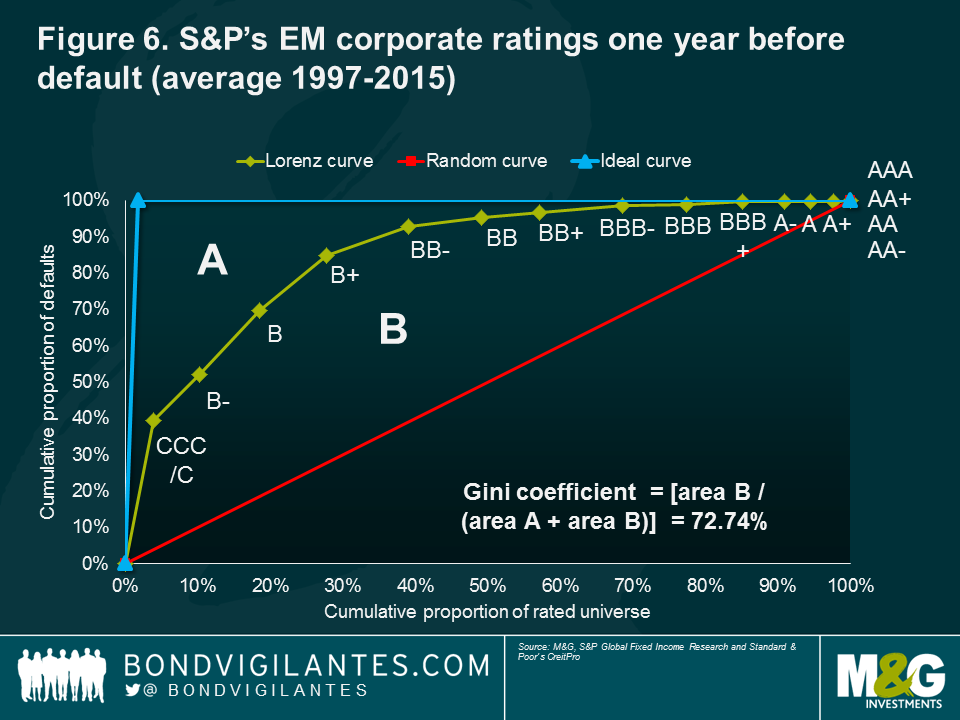
The above Lorenz curve plots ratings between the cumulative proportion of defaults (y-axis) by the cumulative proportion of rated universe (x-axis). In theory, should ratings be fully accurate, all defaulted issuers should have been rated at the lowest rating above default in the rating scale (eg, imminent default or ‘C’ for Standard & Poor’s (S&P) and Fitch) one year before the actual default. This theory is represented in the ideal curve of Figure 6, as represented by S&P in a recent study*. The rating agency also compares this ideal curve with a random curve, the latter meaning, on the contrary, that ratings only randomly measure default risk.
The Gini coefficient is another useful indicator of ratings performance because the ratio, which is calculated as [area B / (area A + area B)], translates the Lorenz curve into a single and comparable measure. If the rating distribution randomly measured default risk, the Gini coefficient would be zero. Conversely, the coefficient would be close to 100% had all defaults occurred in the lowest rating category – effectively the ideal curve.
* S&P Global Ratings: 2015 Emerging Markets Corporate Default Study And Rating Transitions, September 2016.
Default rates expected to decline in 2017
To use a credit rating as a single measure of default risk is therefore not sufficient. Another useful indicator is market price. The peak of defaults for EM corporates – 5.1% in 2016 – coincided with a large number of bonds starting the year in 2016 at distressed levels. 74 bonds representing 10% of the EM High Yield Index (the high yield portion of the JPM CEMBI BD Index) were trading at a cash price of below 70, as at 1 January 2016 (see Figure 7).
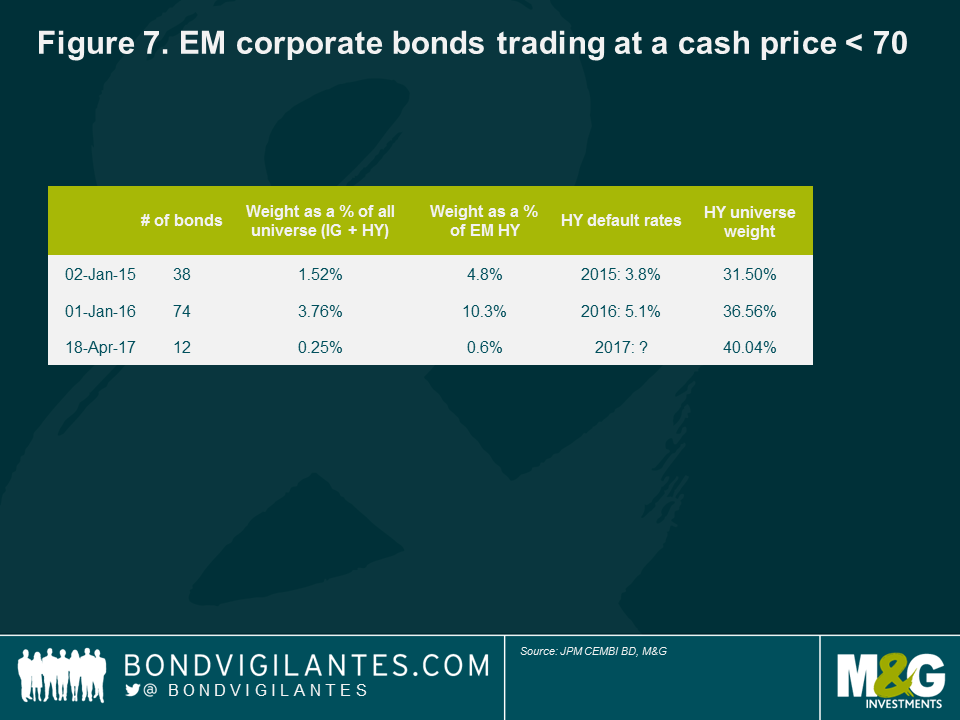
This year, we believe default rates should come down significantly. In April 2017, we have noted only 12 distressed bonds in the index, accounting for only 0.6% of the high yield index. The high yield default rate in the first quarter of 2017 was only 0.1%, a very good start of the year. In addition, most countries are seeing better refinancing conditions. This is the case for Brazil which experienced a near full closure of its corporate bond market in 2015 and early 2016. Russian corporate issuers also returned strongly to the primary market in the first quarter of 2017, while Mexican corporates were able to refinance existing maturities despite the early fears following the US election. In Asia, China continues to benefit from robust local demand. Finally, low spreads have been reducing the cost of debt (and refinancing), a welcome savings for cashflow generation after years of a deteriorating operating environment until the first quarter of 2016.
Valuations already reflect the improvement in default rates
Expected lower default rates have been a major driver of spread tightening. EM high yield corporate bond spreads have fallen around200 basis points (bps) over one year to 445 bps as at April 2017. So how much are we getting paid on top of default risk; in other words, how much excess spreads do investors earn on top of spreads compensating for default risk? Based on our calculation1, we estimate that excess spreads in EM high yield are about 340 bps, assuming low single-digit default in 2017. This has come down from 430 bps a year ago, arguably making high-yield corporates less attractive on a default risk-adjusted basis than investment grade bonds. However, this analysis is really only relevant for passive investors buying an index – hence, being fully exposed to default risk – as one would expect active management and in-depth research to allow avoiding defaults and capturing both the excess spreads and spreads compensating for default risk.
Finally, default rates are not the only driver of the asset class, as tightening bond spreads have also reflected the better risk sentiment as well as the supportive technical backdrop with strong EM demand exceeding a still-negative net supply of bonds. In our view, the improving EM macroeconomic fundamentals and expected benign default rate environment continue to offer opportunities to find attractive yields in emerging debt markets.
1 We assume: (i) bond spreads reflect a six-month forward-looking view of default; and (ii) a 35% recovery value in EM high yield debt
The value of investments will fluctuate, which will cause prices to fall as well as rise and you may not get back the original amount you invested. Past performance is not a guide to future performance.
19 years of comment
Discover historical blogs from our extensive archive with our Blast from the past feature. View the most popular blogs posted this month - 5, 10 or 15 years ago!


Bond Vigilantes
Get Bond Vigilantes updates straight to your inbox