


High Yield Floating Rate Bonds
With many of the conditions for the economy to normalise now met, the point at which interest rates also begin to normalise is getting closer.
Bank of England Governor Mark Carney, Liverpool, 9 September 2014
… with the economy getting closer to our objectives, the FOMC’s emphasis is naturally shifting to …. the question of under what conditions we should begin dialling back our extraordinary accommodation.
Federal Reserve Chair Janet Yellen, Jackson Hole, 22 August 2014
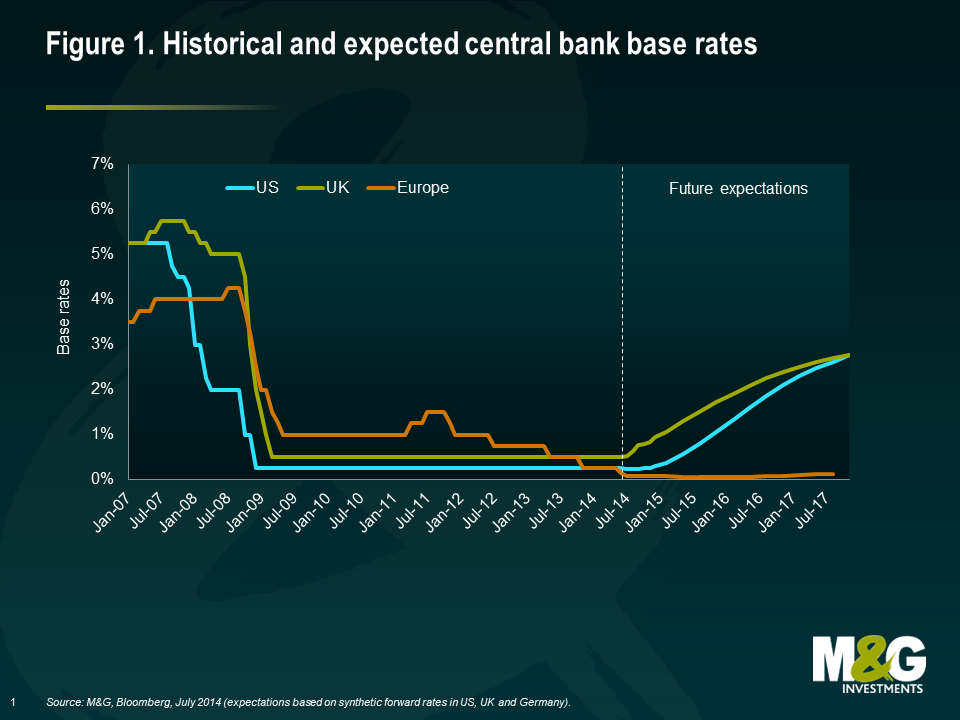
We are entering a new era for interest rates in the developed world. The extended period of ever looser monetary policy is starting to draw to a close. In the wake of the tapering of quantitative easing (QE) from the Federal Reserve (Fed), investors now expect to see the first interest rate hikes in many years, initially in the UK and shortly afterwards in the US (see figure 1). The principal focus of the debate is over the questions of “when?” and “how fast?” interest rates should rise, not “if?” For bond investors in particular, this transition has thrown up a lot of difficult questions. Having benefited greatly from falling yields and tightening credit spreads, the move to a more hawkish cycle will create many more headwinds and challenges when it comes to delivering returns for many fixed income asset classes.
Consequently, any product or instrument that can help investors navigate this environment has rightly been receiving a lot of interest and attention. In the latest in our series of the Panoramic Outlook, we will focus on one such instrument, the high yield floating rate bond. In recent years, this instrument has gained popularity with many issuers and the market has grown to a total US$44 billion.
A high yield floating rate note (FRN) has two key defining features: (1) a floating rate coupon that is automatically adjusted in line with changes in interest rates; (2) a relatively high credit spread that reflects the additional credit risk of a non-investment grade issuer.
It is the combination of these two features which not only enables investors to receive an attractive income stream now, but also allows them to benefit from higher coupons should interest rates increase with no associated loss to capital. This last element, the lack of a hit to capital in a rising interest rate environment, is the key difference to the traditional universe of fixed coupon bonds which suffer from price declines as yields move up.
In this issue, we will take an in-depth look at the characteristics and make-up of the high yield floating rate bond market. We will also consider the key drivers of returns, as well as some of the risks and how these can be managed.
High yield floating rate bonds 101
The key features of high yield floating rate bonds can be summarised as follows:
- It is a bond issued by a company that has a below-investment grade credit rating
- The coupon, usually paid quarterly, is made up of:
- a variable component which is adjusted in line with a money market reference rate, typically every three months (throughout this article we will refer to this measure as ‘3-month Libor’)
- a credit spread, which is fixed for the life of the bond and reflects the additional credit risk of lending to a company
- The bond has a fixed maturity (typically 5-7 years at the time of issue)
- The bond is a publicly traded instrument that can be bought and sold like any other corporate or high yield bond
- As an example, suppose that a 5-year bond is issued with a coupon of 3-month Libor + 450 basis points (bps). For the first year, 3-month Libor is 50bps, so the coupon is 500bps (or 5%) over that period. In the second year, 3-month Libor rises to 75bps, so the coupon increases to 75+450 = 525bps, or 5.25%, during that period.
Market characteristics
| Table 1: High yield floating rate market compared with other fixed coupon bond markets | ||||
|---|---|---|---|---|
| Index | Global High Yield Floating Rate | Global Government Bond | Global Corporate | Global High Yield |
| Average maturity (years) | 4.5 | 8.9 | 8.7 | 6.1 |
| Effective duration (years) | 0.03 | 7.2 | 6.2 | 4.2 |
| Spread duration (years) | 2.1 | 6.9 | 6.1 | 4.1 |
| Face value (US$ billion) | 44 | 23,081 | 7,964 | 2,057 |
| Yield to maturity (%) | 4.5 | 1.3 | 2.7 | 6.1 |
| Spread (vs government bonds, bps) | 400 | 14 | 110 | 435 |
| Composite rating | B1 | AA1 | A3 | B1 |
| Source: M&G, BofA Merrill Lynch, 5 August 2014. |
Table 1 highlights some of the characteristics of the high yield floating rate market and compares it with the more traditional government, corporate and high yield fixed coupon bond markets using data from Bank of America Merrill Lynch’s fixed income indices.
In terms of credit risk (measured by the composite rating) and credit spread (the yield premium above government bonds that compensates investors for the higher risk of default), the high yield floating rate market is very similar to the traditional high yield market. This is to be expected as there is a great deal of commonality between the two in terms of underlying issuers.
The big difference is revealed when we start to look at the effective duration numbers. Effective duration measures the sensitivity of bond prices to changes in yields. A duration of 4.2 years means that for every 1% increase in yields, there will be an approximately 4.2% loss of capital. The effective duration of the High Yield Floating Rate Index is very close to zero (due to the regular re-setting of coupons, cashflows are only fixed for a very short time). This means that if, all other things being equal, there is a broader sell-off in the government bond markets and all fixed income yields need to adjust upwards, the capital loss would be close to zero.
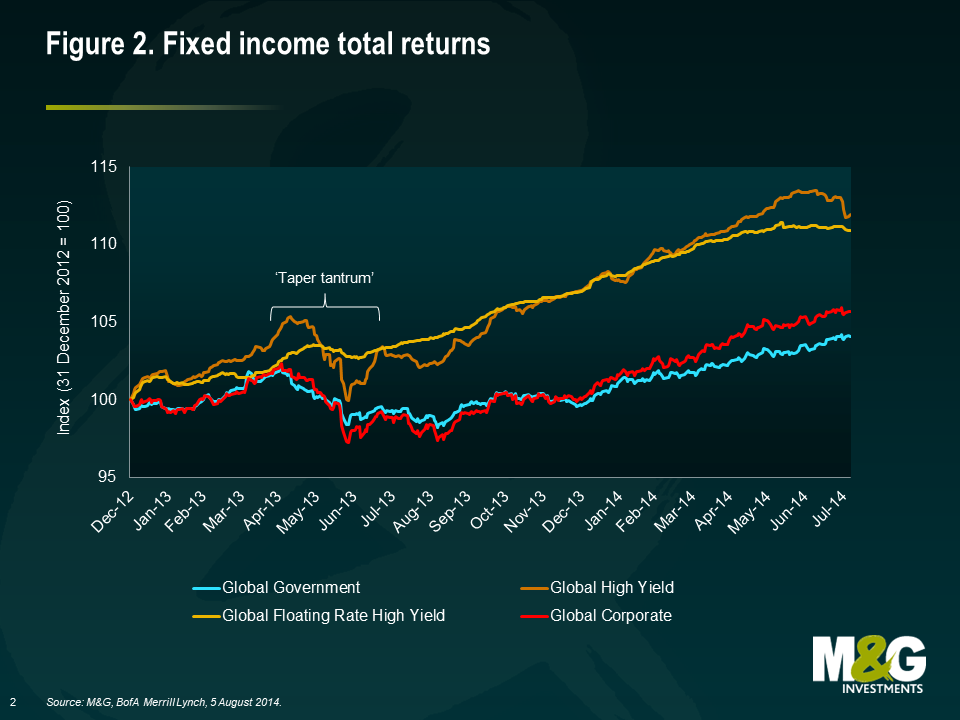
This limited exposure to moves in the broader yields means that the high yield floating rate market tends to be much less sensitive to any wider interest rate inspired volatility in the market. Indeed, during the so-called ‘taper tantrum’ of 2013 when former Fed Chairman Ben Bernanke first introduced the idea that QE would begin to be phased out, the high yield floating rate market was much more resilient in terms of price impact than the other major bond markets as investors adjusted to the concept of tighter monetary policy (see figure 2).
We can also see how this might play out at an individual bond level. In July 2014 Iceland Ltd, a UK supermarket, issued both a £350 million FRN, paying Libor + 425bps maturing in 2020, and a £400 million 6.25% bond maturing in 2021. Both bonds are pari passu senior secured liabilities that are issued by the same company. In other words, the credit risk in both instruments is effectively identical. However, the interest rate risk exposure is very different. Take the following hypothetical scenario:
- Both bonds start the year priced at 100% of par
- For the first six months of the year, 3-month Libor is at 0.56%
- Halfway through the year, the Bank of England unexpectedly increases the bank rate by 50bps, which pushes 3-month Libor to 1.06% and re-prices gilt yields up by the same amount across the curve
- Credit spreads remain the same throughout the year
While this is an unlikely scenario, it does help to simplify the maths. The interest rate duration of the 6.25% 2021 bond is close to 5.5 years, so a 50bps move in underlying yields means a capital hit of around 2.7%. This is offset by 6.25% of income from the coupon, so the total return over the course of a year is 3.6%.
| Iceland bond | Fixed 6.25% 2021 | FRN 2020 (L+425) |
|---|---|---|
| Change to price (%) | -2.68 | 0.00 |
| Coupon return (%) | 6.25 | 5.06 |
| Total return (%) | 3.57 | 5.06 |
In contrast, the FRN has minimal interest rate duration, so does not suffer a capital loss. Indeed, as Libor goes up by 50bps for the second half of the year, the coupon rises from an annualised 4.81% to 5.31% (or 5.06% on average). So crucially, the FRN does not suffer from the broader interest rate volatility, and at the same time, actually benefits from a higher coupon as the increase in the bank rate feeds through to a higher Libor, thereby boosting total returns.
From this example, we can see the clear advantages of floating rate instruments over fixed rate equivalents in a rising interest rate environment.
It is important to note, however, that as non-investment grade instruments, there is still exposure to wider moves in credit spreads within the high yield floating rate market. From table 1, we can see that spread duration for the high yield floating rate market is 2.1 years. Accordingly, if spreads were to widen on average by 100bps to 500bps, there would be an associated capital loss of around 2.1%, and vice versa if spreads were to tighten.
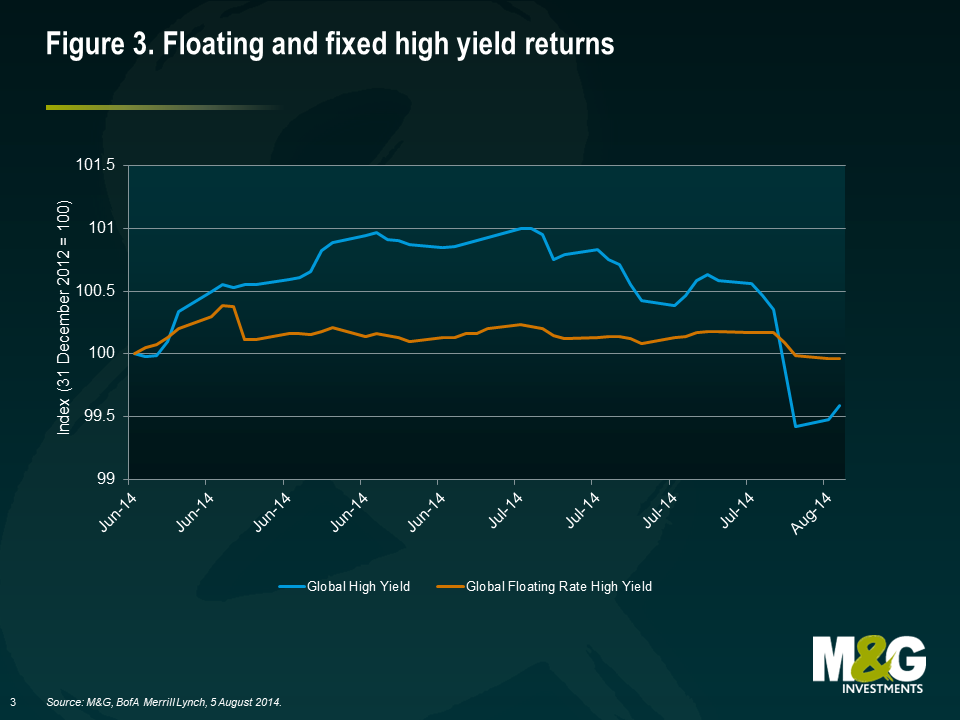
However, the spread duration is around half that of the more traditional high yield universe at 4.1 years. This means that in times of risk aversion and widening credit spreads, the impact on prices for the high yield floating rate market should be comparatively lower. During the recent weakness in late July and August 2014, we can see this expected relationship did indeed play out (see figure 3).
On the other hand, if spreads were to tighten from current levels, we would expect the high yield floating rate market to see an associated capital gain smaller than the more traditional high yield universe, given lower spread duration and, on average, a smaller degree of call protection (a provision designed to protect bondholders by preventing the early redemption of a bond).
A globally diversified market
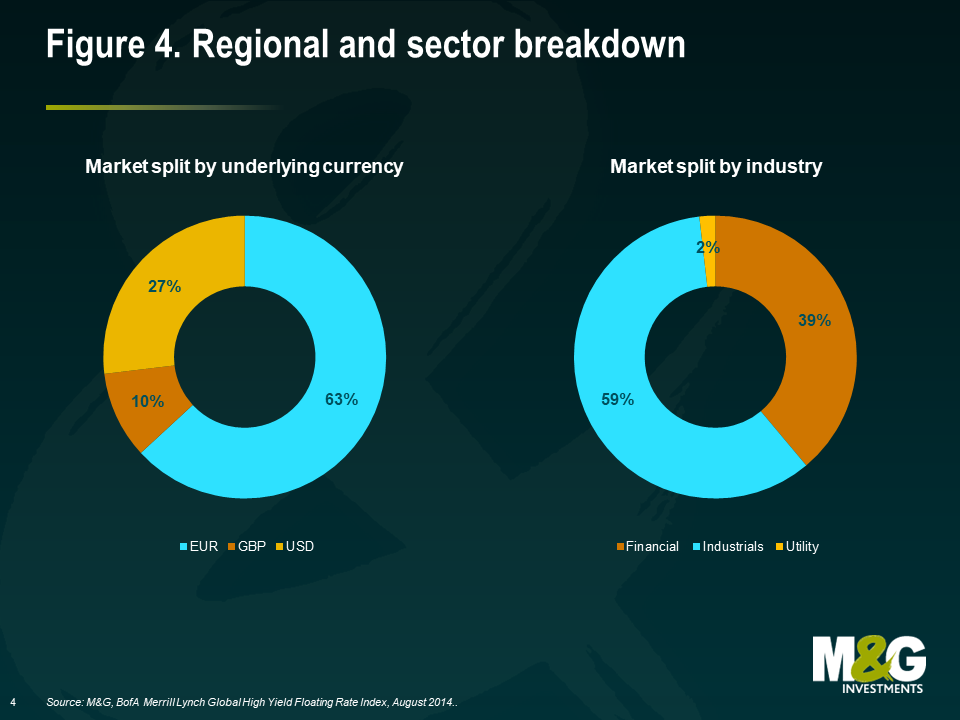
In terms of the underlying issuers, the global high yield floating rate market is well diversified across different regions and industries (see figure 4).
At present, there is a bias towards the sterling and euro markets, driven in part by the trend for European issuers to refinance bank debt in the bond market.
By issuing FRNs, companies can retain a similar debt structure to bank loans, but access deeper and more diversified sources of debt capital. US banks are, on average, less capital constrained than the European banking system so the need to tap sources of new capital has been less pressing. Nevertheless, there has been a steady stream of issuance from both European and US issuers over recent months as we can see from table 2.
The other major trend we can see is a preponderance of industrial rather than financial issuance. We expect this to continue in the short term, increasing the proportion of industrial issuers in the market over time.
| Table 2: Selection of new issues in 2014 | ||||||
|---|---|---|---|---|---|---|
| Issue date | Issuer | Sector | Issue spread (bps) | Maturity | Amount issued (million) | Country |
| Feb-14 | Innovia Group | Capital goods | 500 | Mar-20 | €342 | UK |
| Mar-14 | Premier Foods | Consumer non-cyclical | 500 | Mar-20 | £175 | UK |
| Mar-14 | Kerneos Tech Group | Basic industry | 475 | Mar-21 | €150 | France |
| Apr-14 | Eden Spring | Consumer non-cyclical | 550 | Apr-19 | €210 | Israel |
| Apr-14 | Monier | Basic industry | 500 | Oct-20 | €315 | France |
| Apr-14 | Stonegate | Consumer cyclical | 475 | Apr-19 | £140 | UK |
| Apr-14 | Quick | Consumer cyclical | 475 | Apr-19 | €440 | France |
| Apr-14 | Quick | Consumer cyclical | 750 | Oct-19 | €155 | France |
| Apr-14 | Chesapeake Energy | Energy | 325 | Apr-19 | US$1,500 | USA |
| May-14 | Galapagos | Capital goods | 475 | Jun-21 | €325 | Germany |
| May-14 | AES Corp | Utility | 300 | Jun-19 | US$775 | USA |
| May-14 | Avis Budget Group | Services | 275 | Dec-17 | US$250 | USA |
| May-14 | Novacap | Basic industry | 500 | May-19 | €310 | France |
| Jun-14 | Xefin | Basic industry | 375 | Jun-19 | €325 | Germany |
| Jun-14 | Montichem | Basic industry | 475 | Jun-21 | €175 | Germany |
| Jun-14 | HEMA | Consumer cyclical | 525 | Jun-19 | €250 | Netherlands |
| Jun-14 | Dry Mix Solutions | Basic industry | 425 | Jun-21 | €550 | France |
| Source: M&G, Bloomberg, 2014. |
Drivers of returns and key risks
For investors in the high yield floating rate bond market, the key factors that will influence returns will be:
- Credit spreads – Income, in the form of a credit spread over Libor, is likely to form a major component of total returns, particularly in a low interest rate environment. As the issuers in this market are rated below-investment grade, the corresponding credit spread that investors receive is higher than in other fixed income markets to compensate them for this risk (currently around 400bps). As mentioned previously, returns will also be governed by changes in credit spreads. At a time of tightening spreads, returns will be boosted by capital gains; at times of widening spreads, investors will see capital losses.
- Interest rates – The path of short-term interest rates will also have an impact. If short-term interest rates fall, total returns will also fall as the coupon is automatically reduced, and vice versa should short-term rates rise.
- Default rates – If high yield default rates increase, investor returns would be hit as individual bonds can suffer from writedowns of capital during a bankruptcy process.
High yield floating rate notes vs. leveraged loans
Given the characteristics outlined in this article, it is no surprise that high yield FRNs share many of the same investment characteristics as leveraged loans (floating rate coupons, senior position in the capital structure, non-investment grade issuers).
However, there are some small but important differences between the two asset classes. Most important of all for non-institutional European investors is the fact that high yield FRNs are eligible for inclusion in authorised open-ended funds (aka ‘UCITS eligible’), whereas leveraged loans are currently considered eligible only for institutional investors. To date, this has meant that non-institutional investors could only access this market through closed-ended vehicles such as investment trusts.
However, with the emergence of the high yield floating rate market, non-institutional investors across Europe will be able to access this market using a traditional open-ended fund.
| High yield FRNS | Leveraged loans | |
|---|---|---|
| Coupon | LIBOR + fixed margin | LIBOR + fixed margin |
| Credit rating | Non-investment grade | Non-investment grade |
| Security | Typically first lien / senior secured | Typically first lien / senior secured |
| Liquidity | Daily trading T+3 settlement | Less liquid, uncertain settlement |
| Public/Private | Public information only | Public and private information |
| UCITS eligible | Yes – can be included in open-ended funds sold to non-institutional investors | No – limited to institutional investors only. Non-institutional investors can only gain exposure through closed-ended funds |
Mitigating default risk
Examples of high yield FRNs
Company: Vue Cinemas
Amount issue: €290 million
Coupon: 3-month Euribor +525bps
Maturity: July 2020
Credit rating: B2/B
Region: UK and Northern Europe
Vue is a leading cinema operator in the UK and northern Europe. A consumer-focused business generating a resilient cashflow, we believe Vue is well placed to benefit from the bounce back in UK consumer confidence and retail spending.
Company: Chesapeake Energy
Amount issued: US$1,500 million
Coupon: 3-month USD Libor +325bps
Maturity: April 2019
Credit rating: Ba1/BB+
Region: US
The largest shale gas exploration and production company in the US, with an approximately US$18 billion market capitalisation, Chesapeake benefits from a strong asset base across the major onshore gas fields and an improving balance sheet.
Company: Wind Telecomunicazioni
Amount issued: €575 million
Coupon: 3-month Euribor +400bps
Maturity: July 2020
Credit rating: Ba3/BB
Region: Italy
Italian mobile telecom business Wind is one of the largest issuers of high yield bonds in Europe. Its senior secured bonds are well supported by a strong underlying cashflow.
We view default risk as the key risk to be managed through the cycle, as this is the one driver that can lead to a permanent loss of capital. How can this risk be managed? We think there are three key mitigants:
- Diversification – Ensuring that any investment in this market is diversified across geographies and industries helps protect investors against major idiosyncratic shocks that could precipitate defaults in any one industry or region.
- Credit analysis – As non-investment grade companies, the business, financial and legal risks associated with each bond issued can be very complex. Consequently, having the expertise and capability to assess these risks on a case-by-case basis is crucial.
- Investing in senior secured instruments – Instruments that are senior secured or first lien have prior claim over an issuer’s assets in the event of a bankruptcy. This means recovery rates are much higher on average than unsecured liabilities (see table 3). High yield FRNs are often senior secured instruments or sit alongside loans in the capital structure. Using the data below from the US as a proxy, we would expect recovery rates for this market to be in the 60-80% range over the long term.
| Table 3: Average North American non-financial corporate debt recovery rates measured by ultimate recoveries, 1987-2013 | ||||||
|---|---|---|---|---|---|---|
| Lien position | Emergence year | Default year | ||||
| 2013 | 2012 | 1987-2013 | 2013 | 2012 | 1987-2013 | |
| Loans | 73.3% | 91.7% | 80.3% | 81.3% | 77.2% | 80.3% |
| Senior secured bonds | 67.5% | 63.6% | 63.5% | n/a | 71.2% | 63.5% |
| Senior unsecured bonds* | 4.5% | 36.0% | 48.1% | n/a | 39.3% | 48.1% |
| Subordinated bonds** | 0.0% | 9.2% | 28.2% | n/a | 13.5% | 28.2% |
| * 2013’s senior unsecured bond recovery rate is based on five observations | ||||||
| ** Includes senior subordinated, subordinated, and junior subordinated bonds. 2013’s subordinated recovery rate is based on observation | ||||||
| Source: Moody’s, August 2014. |
A new tool
As we hope to have illustrated in this article, high yield floating rate bonds offer a unique combination of characteristics for fixed income investors, namely exposure to credit spreads alongside materially lower interest rate risk. Consequently, we believe the development of this market will give bond investors a new tool that not only mitigates the potential headwinds of higher interest rates, but also gives them something that actually benefits from the next phase of the monetary policy cycle.
The value of investments will fluctuate, which will cause prices to fall as well as rise and you may not get back the original amount you invested. Past performance is not a guide to future performance.
18 years of comment
Discover historical blogs from our extensive archive with our Blast from the past feature. View the most popular blogs posted this month - 5, 10 or 15 years ago!


Bond Vigilantes
Get Bond Vigilantes updates straight to your inbox