


Jim Leaviss’ view of the year ahead in bond markets
It has become customary in recent years for January to begin with strategists making dire predictions for bond markets. And yet 2014 has, like its immediate predecessors, conspired to confound the vast majority of these expectations. While equity markets have delivered decent returns in the main this year, the predicted bond market rout has failed to materialise.
Download the PDF version of the Panoramic Outlook
At the start of 2014, the consensus was that 10-year US Treasury yields would rise north of 3.25%. This was based on the view that the US Federal Reserve (Fed) would end its six-year quantitative easing (QE) programme, which has seen its balance sheet swell to more than US$4.5 trillion, and that the country’s growth would start to become self-sustaining.
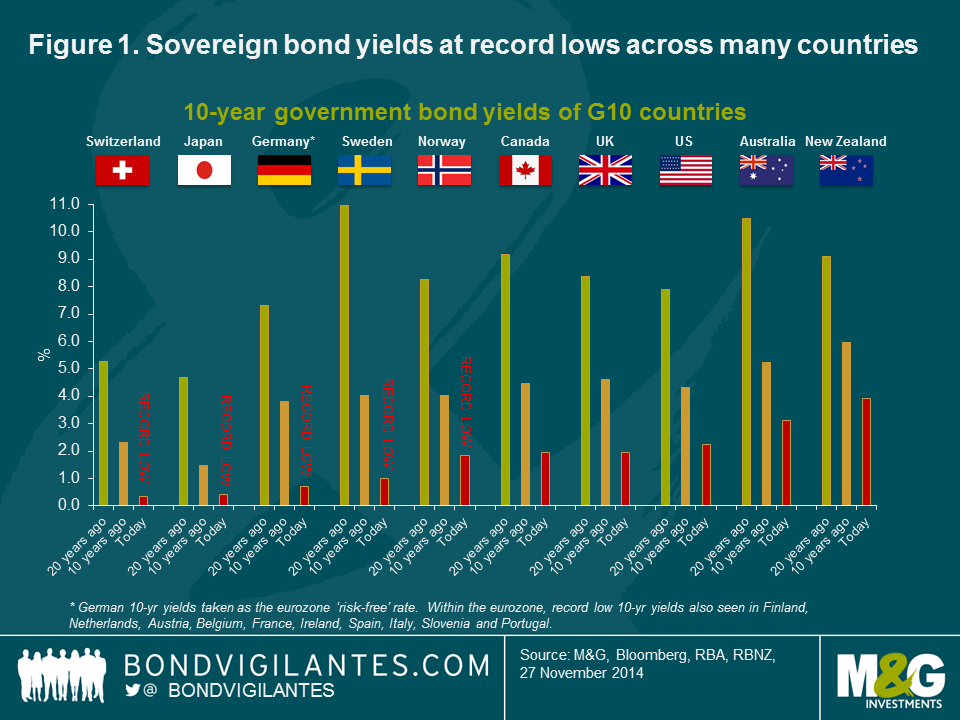
As I write, the US is growing nicely and the Fed did indeed end QE in October. Yet global government bond yields have plummeted – yields on 10-year US Treasuries were 2.2% at the end of November, and European bond yields are at all-time lows (see figure 1). The same is true for Japan. So what explains the further collapse in bond yields that caught almost every Wall Street strategist and economist off guard (with the notable exception of HSBC’s Steven Major, who forecast 10-year Treasuries at 2.1% by year-end), and what does it mean for bond investors in 2015?
Wintry weather, resurgent geopolitics
To start with a summary: 2014 began with some awful weather in the US, leading to a very weak first-quarter gross domestic product (GDP) headline figure. Ben Bernanke then held a series of hedge fund-hosted dinners, just months after standing down as Fed chairman, in which he told those listening that the market’s view of normality was too rosy – rates, yields, growth and inflation would all, in the Fed’s view, be lower than the market was pricing. Waves of geopolitics then hit: Russia/Ukraine, Middle East violence, Hong Kong’s anti-Chinese protests, and Ebola. These ‘risk-off’ events stimulated a flight to quality amongst investors. Safe-haven assets like high-quality government bonds benefited from the uncertainty caused by these geopolitical factors.
The Real Level of China GDP Growth
Perhaps one of the most frequent questions about China’s record decade of growth is whether it is actually real. Commonly, there are a number of reasons to doubt the accuracy of China’s GDP data. To begin with, the Chinese local government structure has various political disincentives to reporting accurate GDP figures. Local officials are promoted almost entirely on the basis of their locality’s growth rates, hugely motivating them to report increasing GDP figures. At the central government level, it appears politically necessary that GDP continues to rise, particularly now as policymakers are pressured to sustain growth in the face of a rebalancing economy.
One reason for economists’ scepticism over China’s GDP numbers is that the Chinese National Bureau of Statistics takes just two weeks to collect its GDP data, compared with six weeks for (the much smaller) Hong Kong, and eight for the US.Even China’s premier, Li Keqiang, has expressed doubts about the data, admitting, over dinner with the US ambassador to China in 2007, that the figures were, “man-made and therefore an unreliable statistic”. Instead, he suggested focusing on three data points – electricity consumption, rail cargo volume and bank lending – as a better proxy to evaluate China’s economic progress.
Economists have, since then, tried to put together alternative indices to gauge China’s true growth. We recently discussed Citigroup’s inspired ‘Li Keqiang Index’ which uses the three indicators mentioned above. To nobody’s surprise, it points to a more pronounced slump in growth than that suggested by official Chinese numbers.
China’s debt levels built up dramatically over the past decade. Thanks to recent policies aimed at limiting the supply of new credit, debt growth is now slowing. The property market is one of the most sensitive barometers of this, with monthly house price declines in roughly 75% of Chinese cities recently. There is also evidence that the market is saturated and inventories have ballooned. Yet, in spite of this, GDP growth in the third quarter came in better than expected at an annualised rate of 7.3%.
Some argue that the reliability of the ‘Li Keqiang Index’ may be compromised since its underlying indicators were mentioned. Back in 2007, when the conversation took place, the Chinese economy, and the Liaoning province in particular, were far more reliant on heavy industry. However, the structure of the national economy has changed dramatically and today, the services sector accounts for a greater share of the economy, requiring a very different method of measurement.
Given the challenges of assessing the real level of China’s GDP, some of the volume data, such as power and rail freight, may be interesting as there is less incentive at the local government level to massage them. However, they only reveal part of the truth and must be assessed in conjunction with a broader range of economic indicators. Regardless, the various data sources seem to be converging around the point we have been arguing for many years – that China’s growth is slowing and this will ultimately have significant consequences for countries that have become increasingly reliant on strong Chinese growth.
Finally, and perhaps most importantly as we look into 2015, we have a global deflation scare – the new aim for central bankers is to get inflation up to 2%, rather than driving it down as before. Recent Consumer Prices Index (CPI) levels of 1.7% in the US and 1.3% in the UK give moderate cause for concern, but it is the eurozone, with annual inflation of just 0.4%, that is the real worry, particularly as this includes five peripheral eurozone economies that are now in deflation (Greece, Spain, Italy, Slovenia and Slovakia).
Many are questioning why 2014 did not turn out as they had predicted. Larry Summers, former US Treasury Secretary and economic adviser to Barack Obama, believes that developed economies are entering into a period of ‘secular stagnation’ – an environment in which growth in rich economies grinds to a halt due to significant underinvestment in future potential. If secular stagnation sets in, the only way to fuel growth is through the development of mini asset bubbles which aim to drive consumption levels higher.
Another reason that some investors are pointing to in order to explain the fall in yields this year is a high level of global savings and liquidity after multiple rounds of central bank quantitative easing. Others suggest that yields are low because governments are too reliant on central banks and haven’t done enough to facilitate sustainable economic growth.
There’s certainly some truth in the idea that if the US government hadn’t fallen over the fiscal cliff in 2013, if the European Commission and the German government had loosened their approach to austerity and deficit reduction, and if the European Central Bank (ECB) had increased rather than shrunk its balance sheet in the past couple of years, we might not be in this position. But these new deflationary pressures aren’t coming purely from the western world. China’s economy is inescapably slowing (see box entitled The real level of China GDP growth). This isn’t necessarily a problem for China itself, as its institutions are very used to micromanaging different parts of its vast economy and regions, and it also owns around US$1.3 trillion of US Treasuries that it could sell to finance a fiscal stimulus if required.
However, the knock-on effects of a China slowdown are significant. Lower growth means less investment in infrastructure, housing and other construction projects. The prices of raw materials could fall – those minerals and metals that are exported by countries such as Chile, South Africa and Australia. Chinese consumers could have less disposable income to buy New Zealand’s premium powdered milk, and firms may spend less on German capital goods or American digger trucks. And it means that the downward pressure on global energy prices is coinciding with a Saudi Arabian oil glut and US energy self-sufficiency on the back of the shale oil revolution.
It has been this collapse in oil prices (see box entitled Oil’s positive shock), from US$120+/barrel to less than US$75/barrel, that will have a significant impact on headline inflation numbers, especially in the US where low taxes on gasoline at the pump mean that oil price falls feed through quickly and aggressively into the CPI. In the UK and Europe, where most of the cost of fuel is tax, the impact is more muted but still present.
Deflation: the new enemy
Surely this is good news for consumers? Absolutely! History shows that movements in energy costs are perhaps the single biggest driver of changes in economic growth. As a result, 2015 should be a year where growth rates finally get the help they need to reach escape velocity. It’s the single biggest reason to be cheerful.
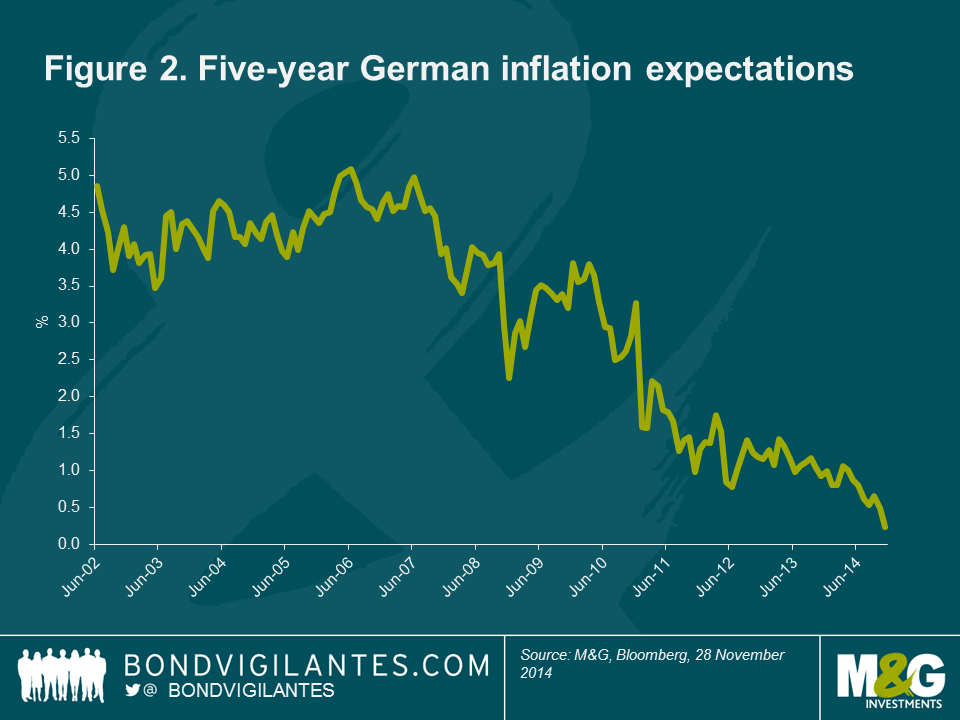
But in some ways, central bankers will regard this latest weakness in commodity prices (and, for largely unrelated reasons, food prices) as inconvenient at best. With inflation numbers well below those 2% targets, consumer and market expectations of future inflation deteriorating, and interest rates already at the zero bound, they are flirting with deflation. Indeed, there is a growing nervousness that not only are asset bubbles being created, but that we are nearing a situation of ‘Japanification’, in which both consumption and corporate investment is permanently deferred as individuals and businesses realise that falling prices means there it is never a good idea to buy something today.
The eurozone crisis to date has been characterised by last-minute action, with seemingly great reluctance from Germany. What’s more, that action has been driven by financial markets rather than cold economic data, political pressure from peripheral governments, or even street protests. This time could be slightly different, as for the first time Germany’s economy is also in trouble, as it finds itself unable to find buyers for its exports. But with Germany continuing to put emphasis on ‘Black Zero’, its goal of moving from a budget deficit to a small surplus for the first time since 1969, it looks unlikely that fiscal largesse will play a part in any concerted deflation-fighting policies. So that leaves the ECB, itself part responsible for the current predicament through its shrinking balance sheet.
Oil’s Positive Shock
The path of oil prices has been far from steady over the last few decades. In 1973, the world’s major industrial countries were faced with an oil embargo from the Middle East, leading to a petrol shortage. The ensuing crisis caused economic growth in a number of countries, including the US and UK, to stagnate as oil prices quadrupled. Then in 1979, oil production fell as a consequence of the Iranian Revolution, again causing oil prices to rocket.
The 1990s witnessed the next significant spike in prices, this time in response to the Iraqi invasion of Kuwait. More recently, a combination of supply and demand factors contributed to the oil price ascending between 2003 and 2008.
But this time it’s different – oil prices have tumbled and now stand at five-year lows. Historically, significant changes in the oil price have been driven by supply constraints and high demand, resulting in a drag on world GDP. In recent times, however, the oil price has been driven lower by an oil glut. Excess supply from both the US and OPEC has resulted in a flood of oil against a backdrop of flat consumption. Meanwhile, OPEC officials confirmed after their meeting in October that the organisation is in no hurry to cut output.
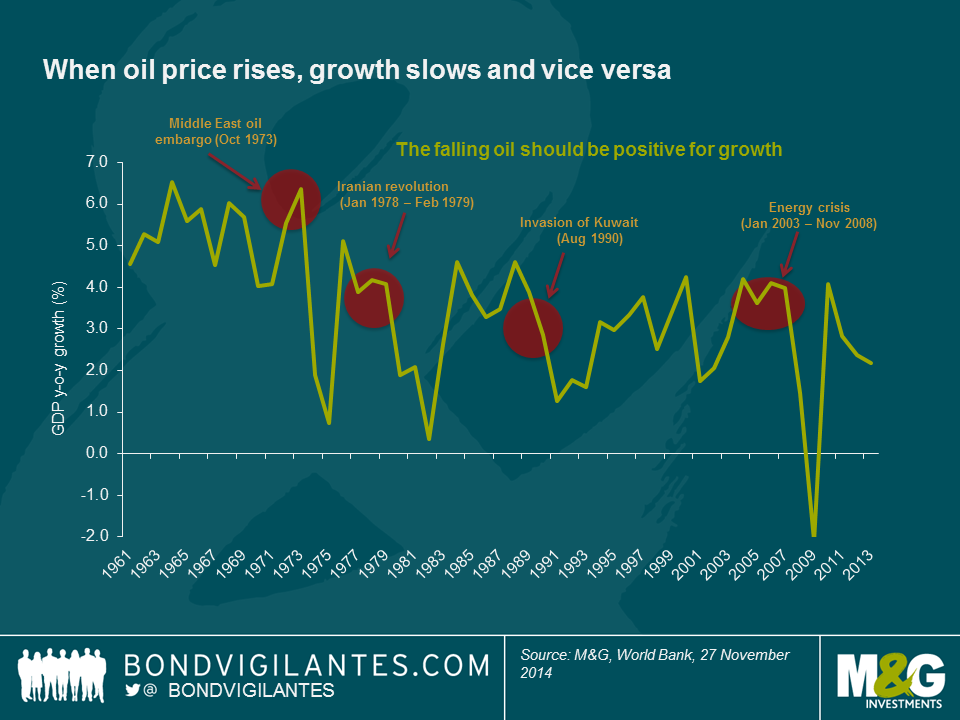
The current positive supply shock transfers real income from producers to households, which should have an impact on the wider economy through increased spending and demand for other goods. With oil prices falling, the global economy is set to benefit from an estimated US$200 billion uplift. As an input to production, lower oil prices also make it economically feasible to produce more GDP with existing technology. Although deflationary in the short term, this is expected to be positive for world growth over longer time horizons, as the fall in oil price provides great consumer stimulus which (all else being equal) should help to lift global GDP in 2015.
The ECB finally started to buy covered bonds and asset-backed securities during the autumn, and has reintroduced a targeted long-term lending programme (the T-LTRO) in order to stimulate private-sector borrowing. So far, none of these activities has been the ‘big bazooka’ that might change sentiment in the same way as QE was for the Fed, Bank of England, and now even the Bank of Japan.
There are some signs of hope: whilst initial take-up of the T-LTRO facility was disappointing, it’s likely that some of this was related to the announcement of the ECB’s own stress test results. Now that the Asset Quality Review is finished, and banks know whether they passed or failed, there is capital raising to be done. As a result, we expect a large amount of so-called AT1 bank debt to be issued in the coming months (see box entitled The rise and rise of CoCos). It also means that the uncertainty around the stability and capital needs of the eurozone’s banking sector is behind us, and that banks can lend the ECB’s cheap money on to their customers. We expect future demand for T-LTROs to increase, helping to reverse the decline in the ECB’s balance sheet and boosting end demand.
Whilst full-blown quantitative easing has yet to materialise, ECB President Mario Draghi and other council members have made it clear that it continues to be an option. Legal challenges to this from the German Constitutional Court remain a possibility. But if inflation fails to stabilise in the coming months, we expect to see out-and-out QE in 2015, with bond purchases spread across eurozone member nations in proportion to their economic importance. This should mean a general lowering of yields across the single-currency area, and a further narrowing of Spanish and Italian bond spreads.
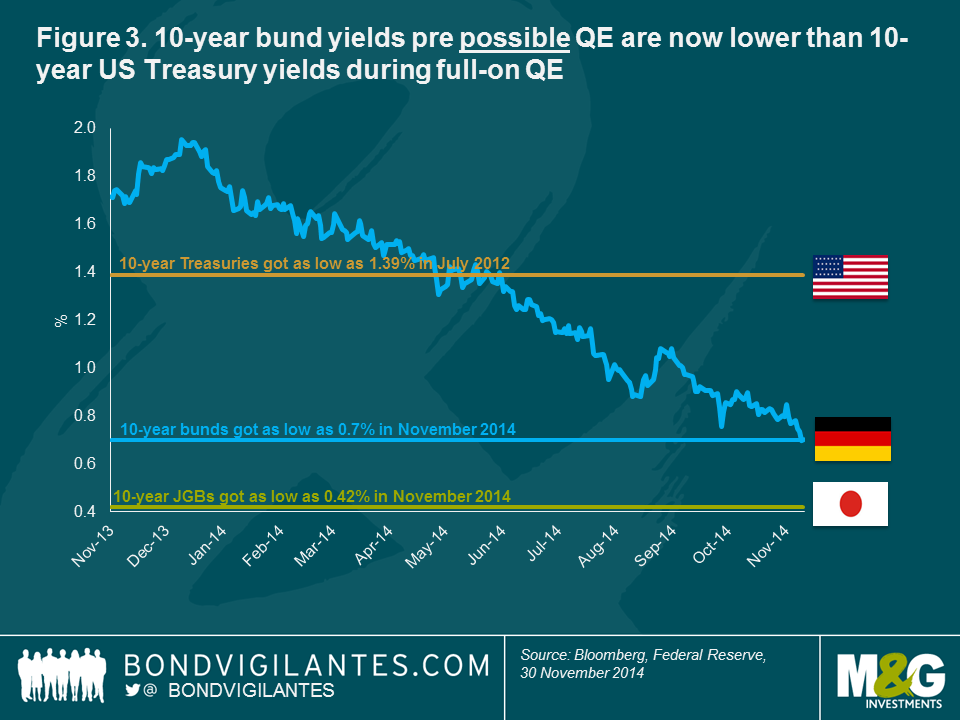
It’s clear though that bond markets have already discounted a significant QE programme from the ECB. The 10-year bund yield at 0.7% is already well below the sub-1.5% that US 10-year Treasury yields got to in 2012 at the peak of the Fed’s QE spree, and is not far from the 0.4% that Japan got to three decades into its economic crisis and after QE, zero rates and prolonged deflation (see figure 3).
But given how low core eurozone bond yields have fallen without full-blown QE, what real impact could this have? Deflation has come to Europe despite ever cheaper borrowing costs for the public and private sector. Its biggest impact just might be through the currency.
The Rise and Rise of Cocos
The biggest growth area for Europe’s bond market in 2014 has been hybrid securities – instruments with cryptic names such as CoCos (contingent capital notes) and AT1s (additional Tier 1 notes). Their rise reflects a wider drive to raise new capital following major regulatory changes designed to reduce the risk of governments needing to bail out banks in times of financial stress, as was the case in the financial crisis. The regulations include new capital requirements imposed under Basel III.
CoCos and their kind are finding popularity with banks and regulators alike due to the way that they combine features of equity and debt and can be deeply subordinated within capital structures. As this suggests, they are complex financial instruments that require significant analysis in order to invest. This has been recognised in the UK by the Financial Conduct Authority (FCA), which moved to restrict their sale to the mass retail market in October.
We believe that when purchased at an attractive price, CoCos can, on a selective basis, be a welcome source of additional risks and returns within a diversified bond portfolio. In our view, it is important to have a large and dedicated team of financial credit analysts that can conduct fundamental analysis, meet company management and understand the possible risks involved in investing in such instruments. Investing in CoCos bears specific risks that go beyond the risks of corporate bonds and include: trigger-level risk, coupon cancellation risk, capital structure inversion risk, call extension risk, and valuation risks. In addition, CoCos are an emerging asset class and it is still difficult to predict how they will perform in a stressed environment.
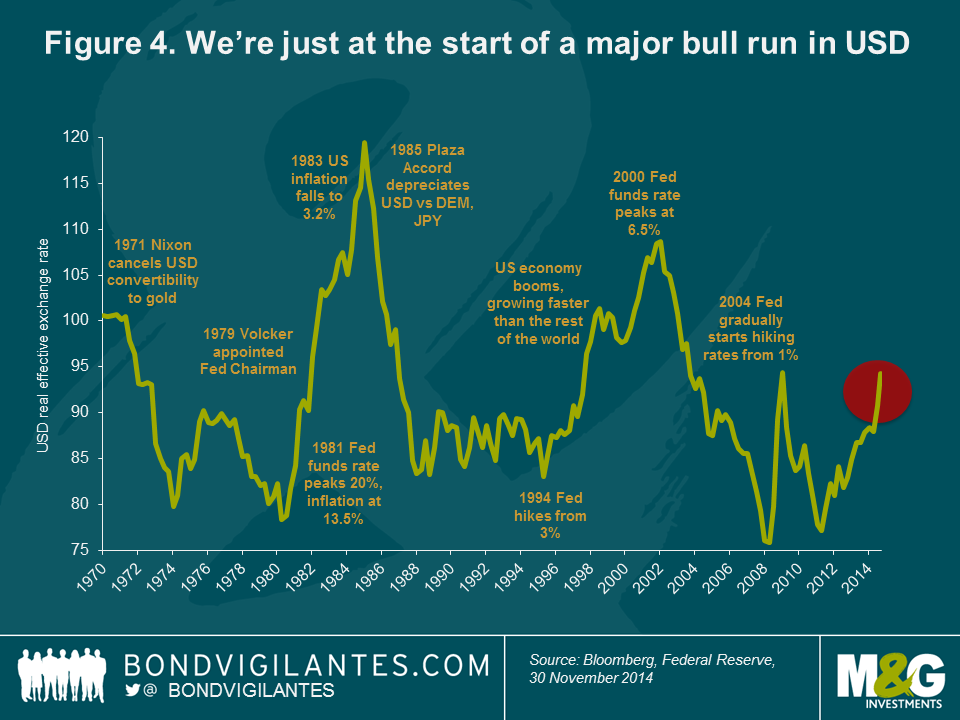
Financial markets tend to regard QE as a debasement of the currency – just look at the yen since Japanese Prime Minister Shinzo Abe announced the sharpest of his three arrows, the huge expansion of the Bank of Japan’s balance sheet, or conversely at the strength of the US dollar as the currency markets anticipated the end of Fed bond buying. It’s likely that both yen and euro weakness will continue into 2015 and beyond. Whilst the US dollar has seen a significant bounce from its weakness in the middle of 2014, its current strength looks minor compared with historical bull markets.
Bull market for the US dollar ahead
The US dollar is not only supported by the relative shrinking of the Fed’s balance sheet compared with those of the Bank of Japan and the ECB, but more fundamentally by its stronger growth potential over the coming years, the likelihood that the US will be the first of the large economies to hike rates, and also by an improvement in its current account. Whilst the US remains a deficit economy, importing more than it exports, the dramatic turnaround in its energy position means that within the next decade or so it could become self-sufficient in energy – and its current account deficit all but disappears (see figure 4).
We continue to like the US dollar, but not its government bond market. One way to take advantage of expected dollar strength, Fed rate hikes and improving US corporate and banking health is to buy floating rate notes (FRNs). Unlike traditional bonds, these instruments don’t have fixed coupons and instead pay a rate of interest linked to money market rates. So as the Fed raises rates, probably in the middle to second half of 2015, the coupon on the FRN rises too.
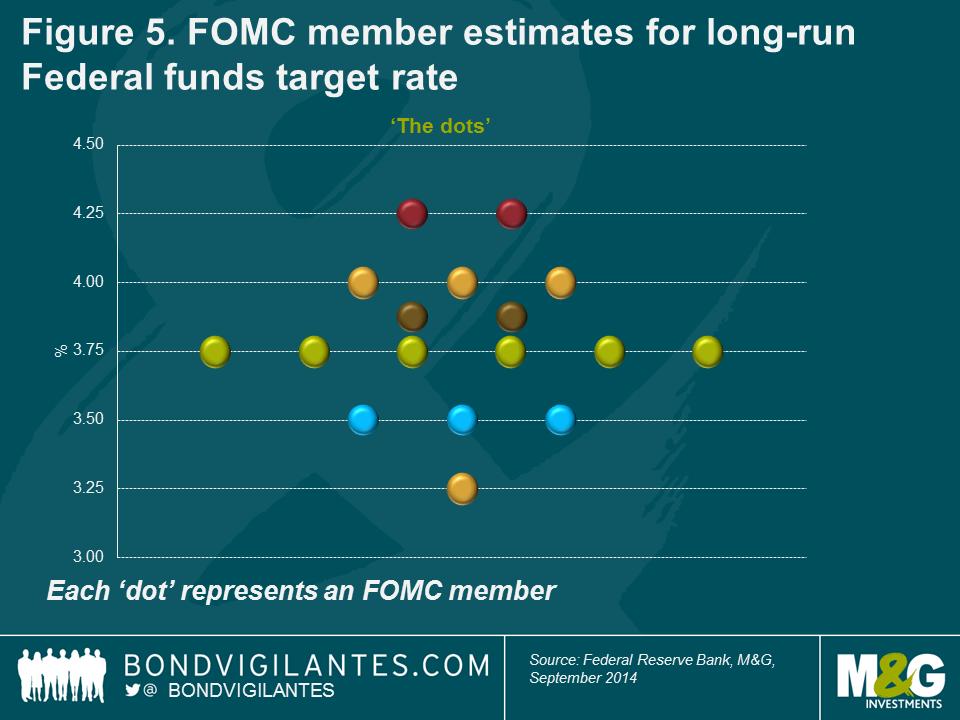
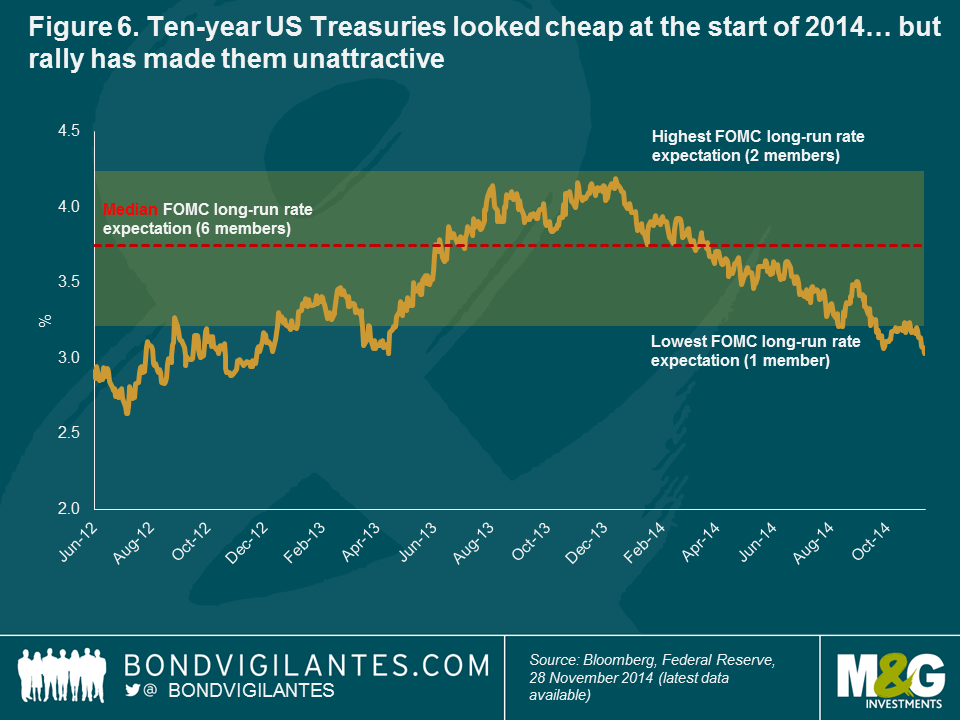
Federal Open Market Committee member estimates regarding the long-run Federal Reserve funds rate as shown in its so-called ‘dots’ chart are helpful when drilling down into how tightening might unfold (see figure 5). In effect, this provides a guide not only to the direction that bond yields should go, ie, upwards, but also by how much. Based on the dots, and given that forward-looking US Treasury yields were around the top dots 12 months ago, we found that the start of 2014 was a good time to add duration. Fast forward to year-end, and taking into account the significant year-to-date yield rally, and the reverse applies, with short duration now looking the right stance (see figure 6).
Might there come a time to go negative duration and could 2015 be that time? Possibly, although we should remember that negative duration implies a negative carry, meaning you have to be right simply to break even. In other words, yields have to rise for returns to stand still. However, a proper bear market for fixed income assets seems unlikely before inflation starts to rise back up towards target. With wage rises still very low, despite certain signs of tightening in parts of the US labour market, the timing of such a sustained inflation pick-up remains uncertain.
Developed world challenges
While the outlook for the UK economy remains relatively solid, there has been a significant downgrading of expectations over the past few months and the UK has fallen back from the position it held for much of the year as front-runner for interest rate hikes. As David Cameron pointed out in early November, “red warning lights are once again flashing on the dashboard of the global economy” in the shape of the eurozone teetering on the verge of another recession, slowing emerging market growth, little progress with global trade talks and geopolitical risks.
UK Referendum Fever
Prime Minister David Cameron’s pledge back in 2013 to give UK voters an in–out referendum on European Union membership has been gaining prominence this year, particularly after Scotland’s own close-run vote against independence from the UK in September.
Cameron has adopted an increasingly critical stance on the EU in recent months, as he tries to counter the rising popularity of the United Kingdom Independence Party (UKIP), whose campaign is centred around leaving the bloc. Should the Conservatives be returned to power following parliamentary elections in May 2015, an EU referendum would take place by 2017.
The relative narrowness of the Scottish vote (in the end, around 55% voted in favour of remaining part of the UK, although opinion polls in the weeks running up to the election were far closer) caused sterling to weaken and the stocks of a number of Scotland-headquartered firms to sell off.
While short-lived – and over very quickly following the announcement of a victory for the ‘no’ camp – the volatility gave markets some insight into what could happen in the run-up to an EU referendum. Should the UK vote in favour of ‘Brexit’, as it has become known, then all bets could be off. Although most voters currently claim to be in favour of continued EU membership, the Scottish referendum provides an example of how voting intentions can remain fluid right up to the day of the vote.
The UK’s significant reliance on the eurozone, in particular, is already making itself felt in slowing manufacturing and export data. Added to which, with parliamentary elections due in 2015, and the possibility of ‘Brexit’ (British exit from the European Union, see box entitled UK referendum fever) becoming more widely discussed, 2015 looks likely to be beset with uncertainty.
We have said it before, but the UK’s ongoing very large current account deficit remains a key concern. We continue to view the currency as being fundamentally overvalued on this basis, and such large deficits – as well as being unsustainable from an economic perspective – have historically also preceded a sterling crash.
Elsewhere in the developed world, we remain short the yen, as sentiment is likely to remain adverse against Japan’s persistent economic growth problems and need for ongoing stimulus. However, a combination of weak oil prices, and the recent announcement that the next scheduled consumption tax hike has been put on hold could yet combine to turn Japan into the surprise growth story of 2015.
Emerging markets: support remains
Emerging bond markets have generally performed well over the past 12 months, despite investors’ focus on the winding down of QE in the US and the bouts of volatility caused by geopolitical concerns. Against these factors, sentiment towards the asset class has benefited from persistent very low interest rates and benign inflation conditions in developed economies, which have supported demand for higher yielding assets such as emerging market bonds.
The fast growth of the emerging corporate bond market in recent years is widening the opportunity set in the asset class. The hard currency corporate bond sub-asset class has doubled in size since 2010, and is now worth over US$1.3 trillion – on a par with the US high yield market. With the inclusion of local-currency bonds, the Bank of International Settlements estimates that the total emerging market corporate bond market was worth nearly US$4 trillion at the end of 2013.
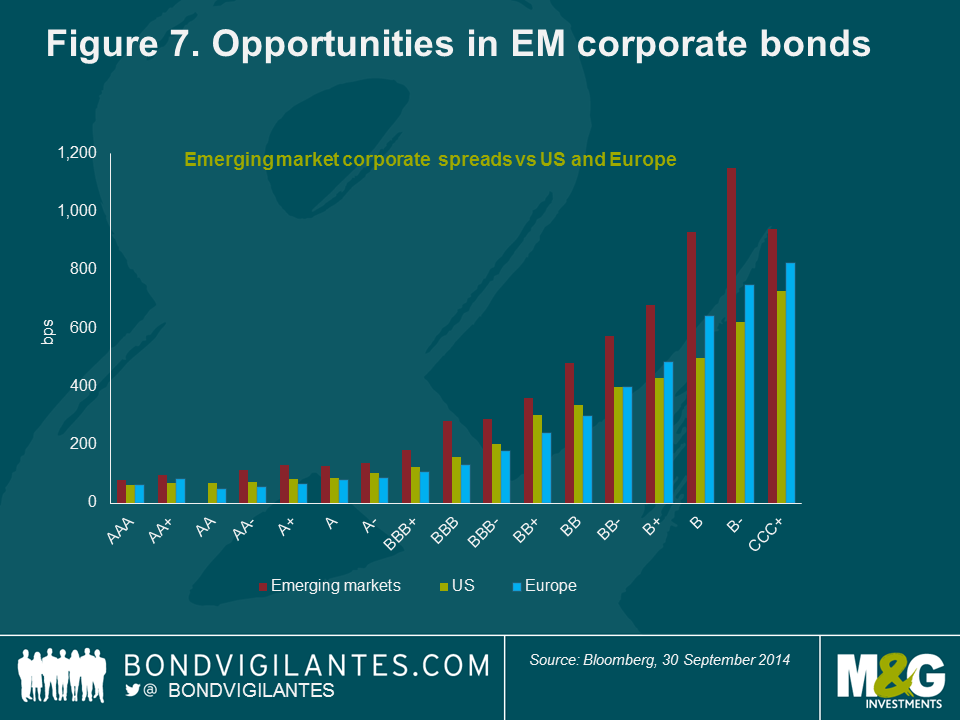
From a current valuation perspective, emerging market corporate bonds can be attractive relative to their developed market counterparts after steadily decent performance from the latter. However, investing on a selective basis with careful and thorough credit research remains key. Figure 7 shows that for a similar bond rating class, emerging market corporate credit is offering higher spreads than in the US and Europe, suggesting that investors are being compensated for the credit risk as well as receiving a premium for investing in emerging market assets.
Credit: closer attention to quality now needed
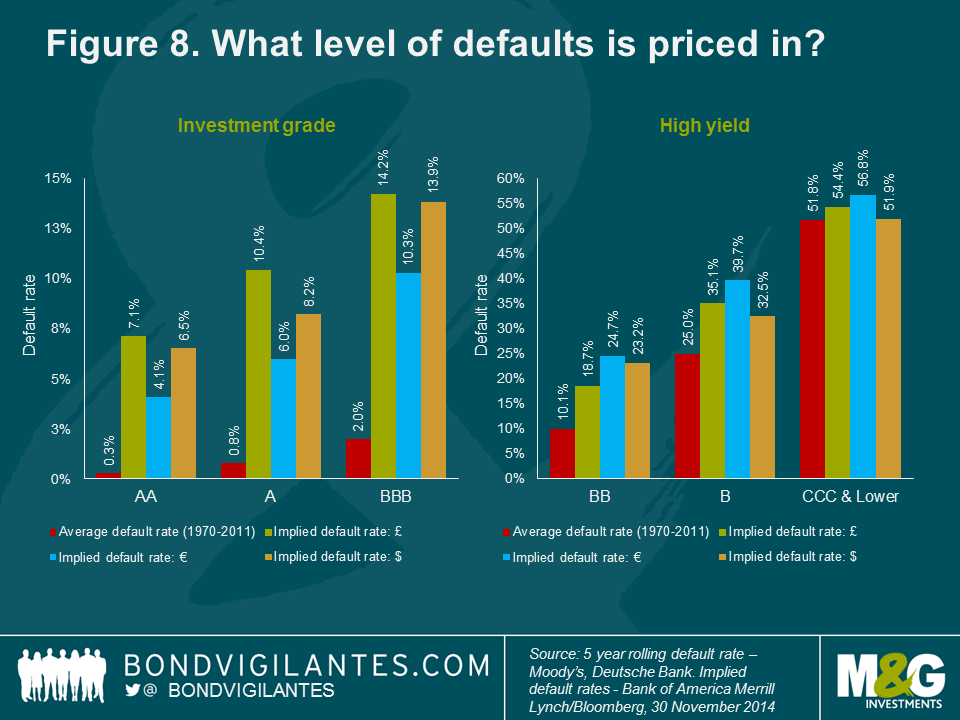
The easy money has clearly already been made in corporate and high yield bond markets. Since the height of the credit crisis, spreads on investment grade have tumbled from a peak of 511 basis points (bps) in 2008 to around 123 bps today, and in high yield, from 2,193 bps to 488 bps over the same period. The good news is that in every rating bucket except for CCC, investors are still being overcompensated for default risk – in other words, credit spreads imply a higher level of defaults than we would expect to see (see figure 8). The bad news is that most of that excess spread is likely to be a premium for illiquidity (see box entitled The price of liquidity), which is not necessarily a problem for long-term investors, but could be a potential source of volatility in the shorter term.
While there are signs of some bad behaviour returning to credit markets, this is on a much smaller scale than in the years before the credit crisis in 2008. Nevertheless, animal spirits do appear to be returning – especially in the US – as evidenced by rising levels of corporate debt, increased merger and acquisition activity and an upsurge in the issuance of lower rated CCC bonds and ‘payment-in-kind’ debt (PIK notes). Dividend payments and share buybacks are also increasing, although healthy corporate profit margins appear to be having only a limited impact on capital expenditure so far, which is a shame for global growth.
While the global default rate is still extremely low, a few warning signs probably suggest that it is time to start paying closer attention to deteriorating credit quality. Overall, companies still have lots of (arguably too much) cash on their balance sheets, but there are a few signs that profit margin growth has reached an end.
A number of high yield businesses have run into problems this year, and while each has been the result of specific issues which were unique to those companies, it does perhaps highlight a general trend of complacency amongst high yield investors. On the other hand, an increase in distressed debt can be a source of opportunities; where we believe the underlying business is robust and the bondholder’s legal position strong, we many occasionally invest in distressed debt instruments.
As the experience of the past few years has aptly demonstrated, making bold predictions for bond markets for the coming year requires no small measure of bravery. Nevertheless, with substantial volumes of QE still on the horizon in a number of globally significant economies such as Japan and the eurozone, the prospect of deflation rather than inflation keeping central bankers awake at night, and the timing of interest rate hikes being pushed out in nearly all economies, it does not need a huge leap of faith to say that conditions for bond investors currently look relatively benign. Equally, as the start to 2014 showed, all it takes is a few stormy months – literally or figuratively – for all best estimates to fall by the wayside.
The Price of Liquidity
Bond trading used to be an integral part of the business model of large banks. That changed after the 2008 financial crisis, when a storm of regulation forced banks to de-lever their balance sheets and retreat from secondary market-making activities. The past few years have seen banks relatively less willing to hold corporate bonds on their own balance sheets until a buyer or seller can be found.
Investors are justifiably worried about what will happen if everyone decides to sell corporate bonds en masse. In an extreme scenario, a complete absence of secondary market activity would impair fixed income managers’ ability to sell their corporate bond holdings, regardless of whether the securities were held in mutual funds, exchange-traded funds or institutional mandates.
The liquidity premium on offer in credit markets is one of the reasons investors can expect a higher return relative to investing in deep and liquid government bond markets. When liquidity was excellent in 2006–07 and credit spreads were very tight, an investor in corporate bond markets was not being paid for liquidity risk and subsequently suffered greatly when corporate bond spreads widened to all-time highs in 2008. The deterioration in liquidity contributed to the large sell-off in corporate bond markets at that time.
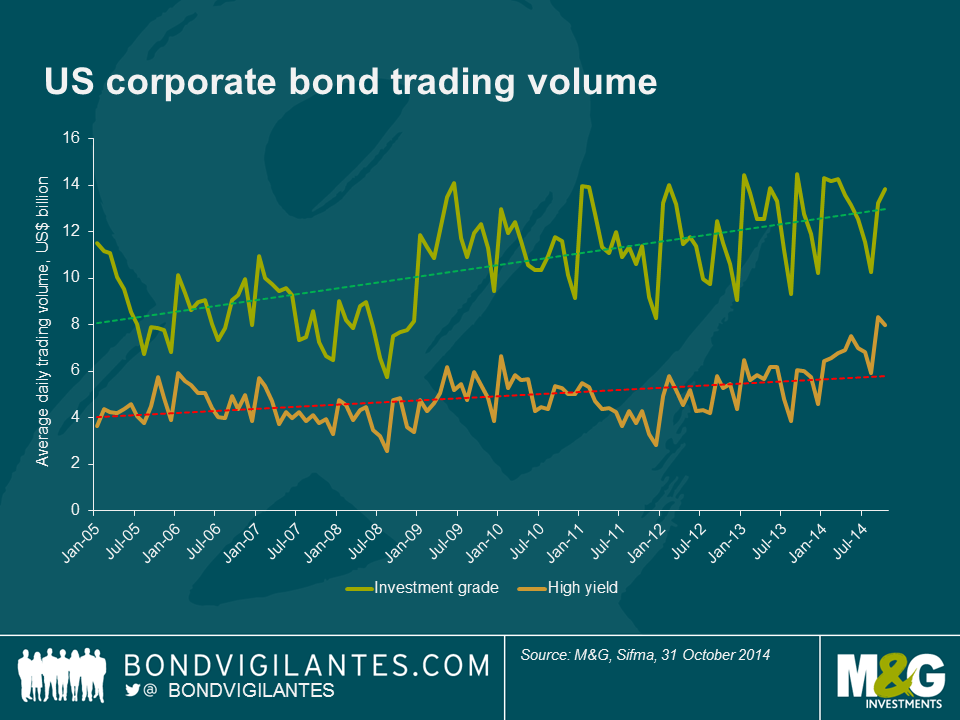
The underlying dynamics of the marketplace make for interesting reading. Secondary-market corporate bond turnover in the US has actually now increased to above pre-crisis levels. As shown in the chart below, average daily transaction volumes have risen from less than US$15 billion in 2007 to US$22 billion in October 2014.
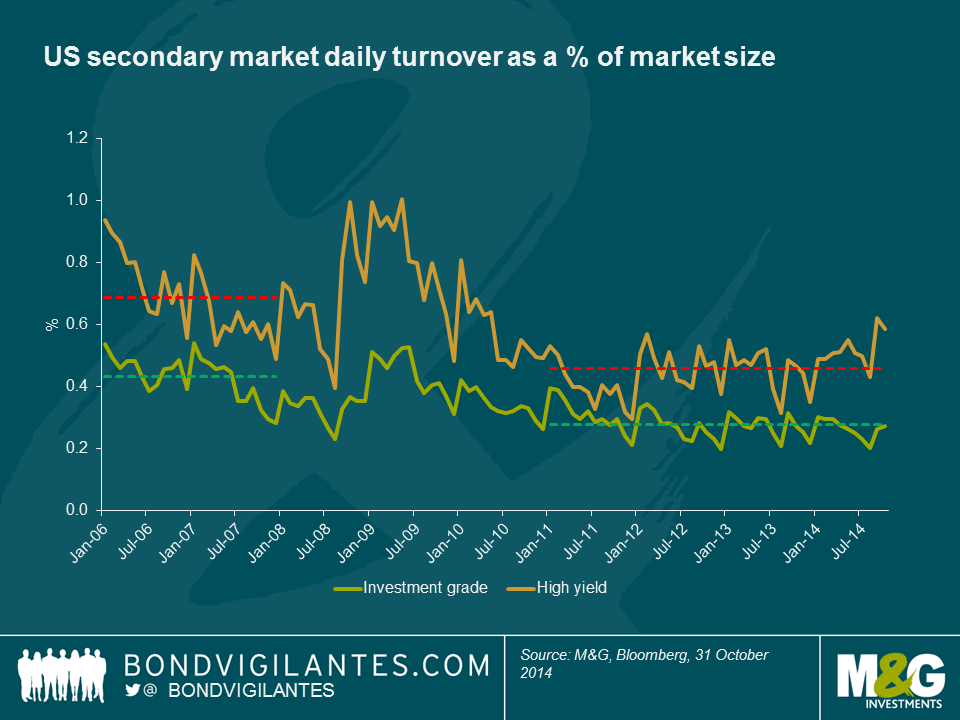
However, global corporate bond markets have grown significantly over the past seven years. Thus, when looking at corporate bond trading as a percentage of the total market, rather than in absolute terms, the steady decline in the share of outstanding corporate bonds that trade on the secondary market becomes evident. Secondary daily market turnover in US investment grade has averaged 0.28% from 2011 to today, a decline from 0.43% in the period between 2006 and 2007. Interestingly, during the financial crisis period – a time most perceive as a very poor liquidity environment – daily market turnover spiked to 0.5% of the US investment grade and 1.0% of the US high yield market as investors sought to exit positions. Whilst liquidity has fallen relative to pre-crisis levels, there is no evidence of a recent, more precipitous, drop in secondary market liquidity.
That said, there have been days in 2014 where a lack of liquidity has been blamed for abnormal market moves. On 15 October, the yield on the benchmark 10-year US government bond plunged 33 basis points to 1.86% before traders stepped in. Yields then rose back to 2.13%. This ‘flash crash’ may have been the result of some large market participants capitulating on short duration calls, alternatively computer-driven trading has been suggested as another reason for the price action in government bonds as yields fell below the key support level of 2.0%. At the end of the day, almost US$1 trillion worth of Treasuries had been bought and sold, showing that liquidity was available. The question, as in all distressed markets, was whether investors were buying and selling at reasonable prices.
Harvesting the liquidity premium is one of the ways for bond fund managers to generate higher returns for investors. Of course, the risks of owning lots of illiquid paper are higher in a poor liquidity environment where it may be difficult to meet client redemptions. To mitigate this risk, managers can undertake measures that include (but aren’t limited to) investing in government bonds; holding short duration, high quality corporate bonds; holding a cash or cash-like buffer; and emphasising diversification.
Liquidity conditions today appear increasingly linked to the direction of spreads (decent in times of narrowing spreads, and correspondingly poorer as spreads widen). We think a lack of liquidity in and of itself is not necessarily something to be feared. That said, we actively monitor liquidity risk across our bond funds, and it is a key reason why we integrate liquidity management into our investment process.
The value of investments will fluctuate, which will cause prices to fall as well as rise and you may not get back the original amount you invested. Past performance is not a guide to future performance.
19 years of comment
Discover historical blogs from our extensive archive with our Blast from the past feature. View the most popular blogs posted this month - 5, 10 or 15 years ago!


Bond Vigilantes
Get Bond Vigilantes updates straight to your inbox