Please note the content on this website is for Investment Professionals only and should be shared responsibly. No other persons should rely on the information contained within this website.
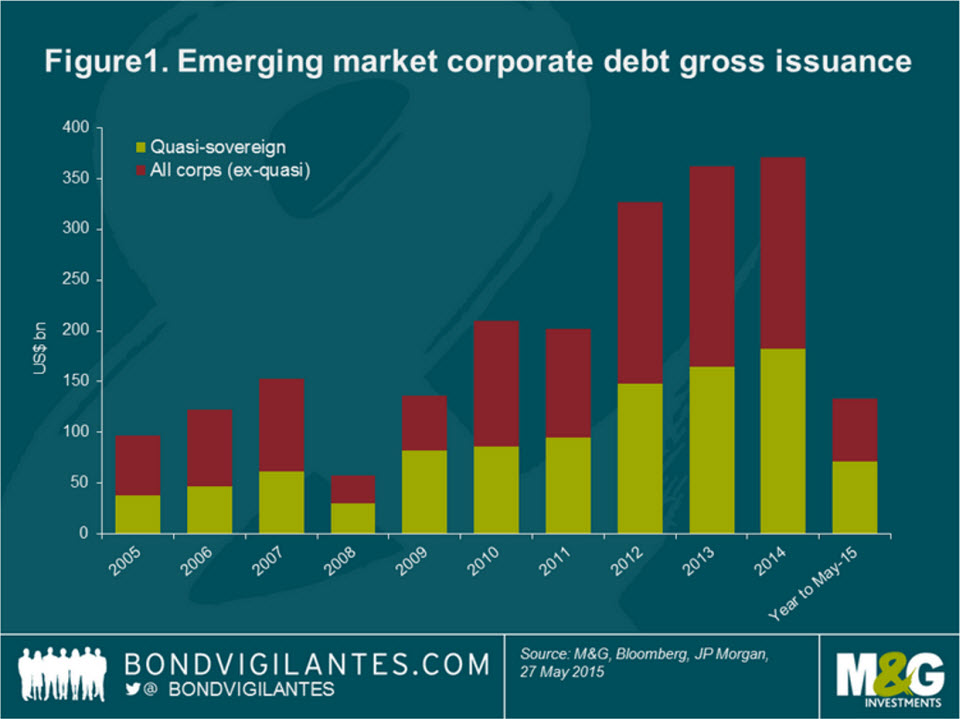
Emerging market (EM) corporate debt has been the fastest-growing segment of fixed income assets over the past decade, rising by nearly seven times since 2005 with external EM corporate debt currently worth c.US$1.7 trillion – larger than the US high yield credit market. One significant contributor to this growth in EM corporate debt in recent years has been the increasing share of quasi-sovereign issuance, which accounted for 49% of the US$371 billion of bonds issued in 2014 (see figure 1). Helped by this trend, EM quasi-sovereign bond stock of US$783 billion surpassed EM sovereign-only bond stock of US$747 billion in 2014 for the first time.
While the definition varies across market participants, an entity or a company is typically defined as ‘quasi-sovereign’ if a government owns either more than 50% of its equity or more than 50% of the company’s voting rights.
Historically, developing countries have been using quasi-sovereign issuance to fulfil policy function, develop the hard-currency corporate debt market, or promote international expansion of leading domestic players. As at the end of June 2015, there were about 170 quasi-sovereign issuers in emerging markets*, more than 60 of which were fully owned (such as Petróleos Mexicanos, or Pemex, in Mexico) or issued bonds explicitly guaranteed by their respective governments (for example, Magyar Exim Bank in Hungary).
* Estimate based on various EM bond indices.
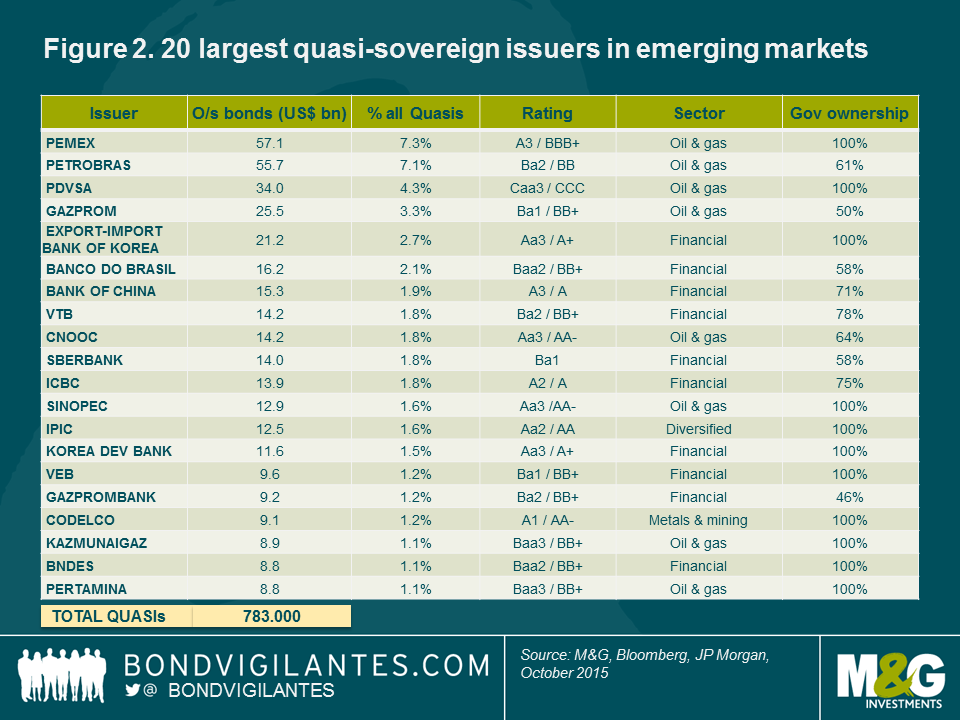
Given the commodity-based nature of emerging markets, oil & gas is unsurprisingly the most represented sector within the quasi-sovereign bond universe, followed by financials, utilities and metals & mining.
In terms of countries, China has been by far the largest issuer of quasi-sovereign debt in the past five years, with over US$170 billion of hard-currency bonds currently outstanding. Following this market in absolute size are Russia, Brazil, Korea, the UAE and Mexico. However, on a relative basis (measuring quasi-sovereign bonds as a percentage of total hard-currency bond stock of a country), Venezuela, several Gulf Cooperation Council (GCC) members (namely United Arab Emirates, Qatar and Saudi Arabia), and Kazakhstan, are ahead of Russia and Korea, and even China.
The largest single issuers are Latin American oil & gas giants Pemex and Petróleo Brasileiro (Petrobras), which altogether represent nearly 15% of total quasi-sovereign bond stock in emerging markets (see figure 2).
One of the best risk-adjusted returns in EM
EM quasi-sovereign bonds have generated good returns since 2005. According to JP Morgan, they generated an annualised return of 6.05%** between 2005 and 2014. With a Sharpe ratio of 0.51 during the same period, this sub-asset class has delivered the best risk-adjusted return within EM (hard-currency) debt over the past decade. The good returns coincided with a prosperous period for emerging markets, characterised by improving macroeconomics in developing countries and relatively healthy fundamentals in the ever-growing corporate debt universe. However, times have arguably changed for emerging markets and macro headwinds have resurfaced in the likes of a stronger US dollar, low commodity prices, fears of a hard-landing for the Chinese economy and EM outflows on the back of the long-awaited US interest rate hike, amongst others.
**Evolution of Quasi-Sovereigns in the EMBI Global, JP Morgan, February 2015
Against this backdrop, an important impact for quasi-sovereign credits has been the increasing differentiation made by investors in terms of corporate fundamentals – an analysis that was somehow lacking, based on the assumption that sovereign analysis was sufficient and that quasi-sovereign corporate fundamentals almost did not matter.
Assessing the credit risk of quasi-sovereign issuers
In most instances, a quasi-sovereign usually has a so-called ‘implicit’ guarantee from its government, but that does not mean it will necessarily obtain an ‘explicit’ guarantee on its bonds. Therefore, bond investors must make sure they carefully examine bond documentations to assess whether or not they are invested in a bond explicitly guaranteed at the sovereign level. For example, while SriLankan Airlines, the national carrier, has weak credit fundamentals, its bonds are nevertheless rated B+ by Standard & Poor’s, in line with Sri Lanka’s government rating, because of the unconditional and irrevocable (hence, explicit) guarantee offered by the government on SriLankan Airlines’ bonds. A change of control clause is also critical in assessing the level of protection for bondholders to a change in the government ownership. Again, credit documentation due diligence is required to identify these risks.
Another key element for assessing quasi-sovereign risk is the level andlikelihood of government support in case of liquidity woes. The more strategically important a corporate is to a country, the more likely a government will be supportive. This is the reason why there is a wider definition of quasi-sovereign – albeit less used by market participants – which includes privately owned companies that are of extreme importance to the economy and would likely be supported by their respective governments. This is the case, for instance, with privately owned Alfa-Bank in Russia. On the contrary, a high level of government-ownership does not necessarily mean that a government will be supportive in a default scenario; therefore, assessing the willingness – on top of the ability – of a government to step in is crucial. As an example, in 2009, the state-controlled Dubai World conglomerate ran into financial trouble and the government of Dubai clearly stated at this time that it had no legal obligation to financially support the company, adding that: “the lenders should bear part of the responsibility”. What was seen as a safe quasi-sovereign investment finally resulted in a painful and lengthy restructuring of the debt for bondholders.
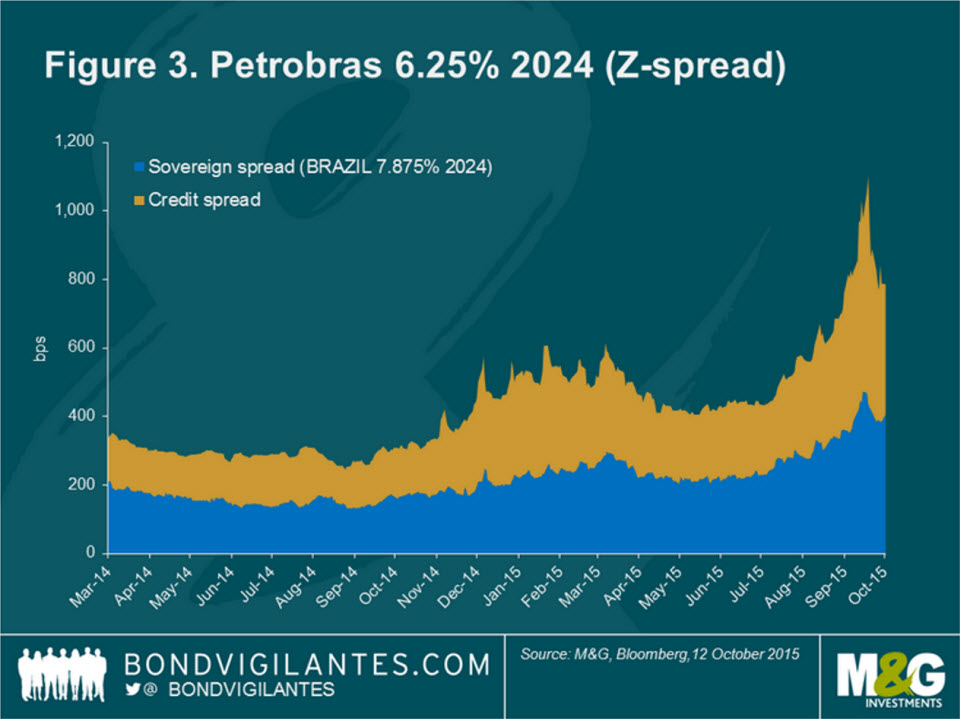
The third factor in quasi-sovereign risk assessment is, of course, corporate credit risk. This encompasses the same work as for ‘pure’ EM corporates – that is, sector outlook, operational performance, credit metrics, management analysis, foreign exchange mismatch, refinancing risk analysis, covenants, bond recovery rate estimates in case of default, etc – in order to measure the so-called ‘standalone credit profile’ of an issuer. Good practice consists of assessing a standalone rating of the intrinsic credit, excluding extraordinary support of a government in a default scenario, but including any daily or punctual government support in the daily operation of a company. Brazil-based quasi-sovereign Petrobras, for example, is rated Ba2 by Moody’s, which assumes a high likelihood of government support (Brazil is rated Baa3 by the rating agency), but is only rated three notches below at B2 on a standalone basis (baseline credit assessment), following the deterioration in Petrobras’ fundamentals and the ongoing corruption scandal involving the company.
How quasi-sovereign bonds trade
To understand how EM quasi-sovereign bonds trade in the market, one important distinction investors make is the aforementioned level of government ownership and the presence or not of government guarantees, as the correlation of a quasi-bond to its sovereign component is highly dependent on these two elements. In general, spreads of quasi-sovereign issuers that are explicitly guaranteed or 100% owned by their governments are highly correlated to their respective sovereign spread. For example, this is the case for PEMEX (100% owned by Mexico) or oil & gas group Pertamina (100% owned by Indonesia), whose spread correlations with their respective sovereign bonds are 0.93 and 0.95. Bond indices, in general, make a case of this correlation and JP Morgan includes fully owned or explicitly guaranteed quasi-sovereigns in its EM hard-currency sovereign index (EMBI Global). The EM hard-currency corporate bond index (CEMBI) includes most quasi-sovereign issuers that are not 100% owned or not explicitly guaranteed by their respective governments. These latter bonds typically have a lower correlation to their sovereign curve, although the sovereign spread component is not negligible – for instance, Petrobras spreads have a correlation of around 0.5 with Brazil.
One widely used measure of valuation of quasi-sovereign risk is the spreads offered by hard-currency bonds to its sovereign spreads. With the exception of the Petróleos de Venezuela (PDVSA) bonds, almost all quasi-sovereign bonds trade wider than their corresponding sovereigns since they include an additional layer of risk: corporate credit risk. (Figure 3 provides an example for Petrobras’ bonds yielding 6.25% maturing in 2024). Bank of America Merrill Lynch recently conducted an analysis of quasi-sovereign spreads on 20 of the largest issuers in the Eastern Europe, Middle East and Africa region (EEMEA) and Latin America, all at least 50% owned by their respective government. Interestingly, the study concludes that sovereign spreads account for an average of 55-60% of the total spread – hence, investors bear an average of 40-45% of credit risk on quasi-sovereign bonds. In theory, the weaker the standalone credit profile the higher the credit proportion of spreads, as it is the case for Petrobras, whose credit spreads account for more than 50% of the bonds’ overall spreads.
Emerging market headwinds have resurfaced
The deterioration of emerging market fundamentals has been an important theme in the past 18 months.
On the macro side, all key countries in key regions have shown a weaker tone: (i) Brazil for Latin America faces tremendous economic and political challenges, (ii) Russia for EM Europe is still subject to economic sanctions from the West due to its involvement in the Ukraine crisis, and (iii) China for Asia, which is trying to regain competitiveness by ways of devaluating the renminbi. In addition, low commodity prices have been affecting – albeit unevenly – a number of developing countries and the fear of the adverse impact of the long-awaited US interest rate rise on emerging market debt is also not helping to improve sentiment. On a positive note, the lower oil price context has been a welcome push to most net-importer Asian countries, while Central America, the Caribbean, and Mexico are benefiting from a stronger US economy.
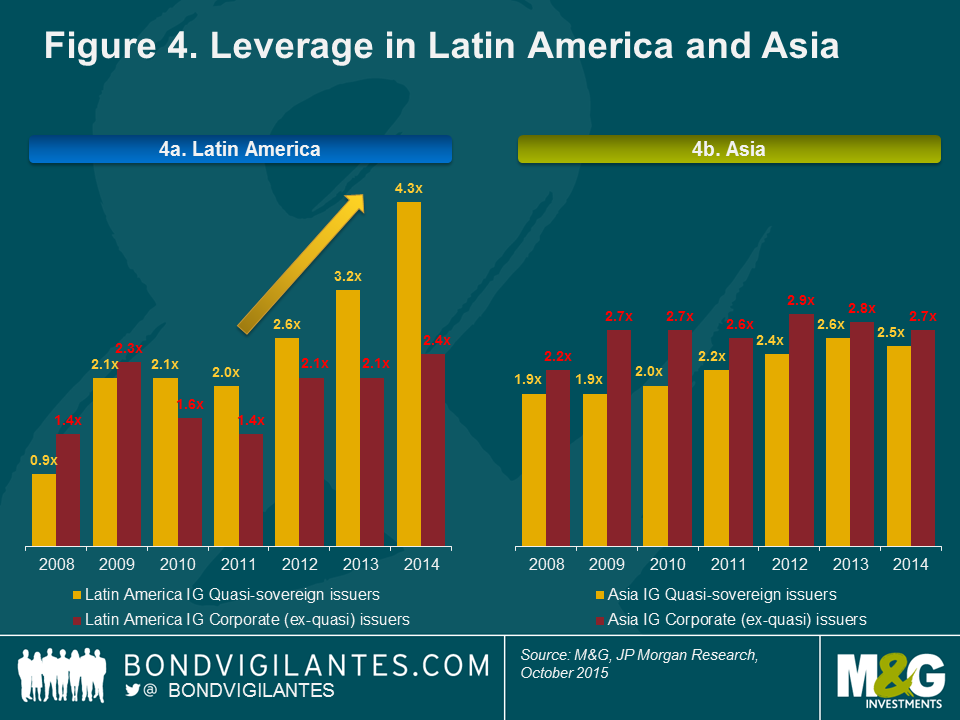
As often is the case in emerging markets, the trends ofcorporate fundamentals have hardly distinguished from the macro context and the overall picture is also on the downside. The very nature of quasi-sovereign issuers – being a mix of sovereign and corporate – has amplified the impact of the weakening macro backdrop on their fundamentals. For instance, weaker EM currencies in Latin America have had a significant effect on debt metrics for companies indebted in US dollar and with earnings in local currency – as can be seen in the rising leverage of Latin American investment grade (IG) quasi-sovereign issuers (see figures 4a and 4b). On the contrary, it is fair to say that Asian quasi-sovereign issuers have been very resilient despite the strong growth in quasi-bond issuance.
The adjustment on quasi-sovereign bond spreads should continue
Fundamentals have deteriorated in emerging markets, but bond spreads have also become more attractive in the asset class. Investors may, therefore, be considering whether some value has emerged. Our view is that this has not yet happened, based on the following considerations:
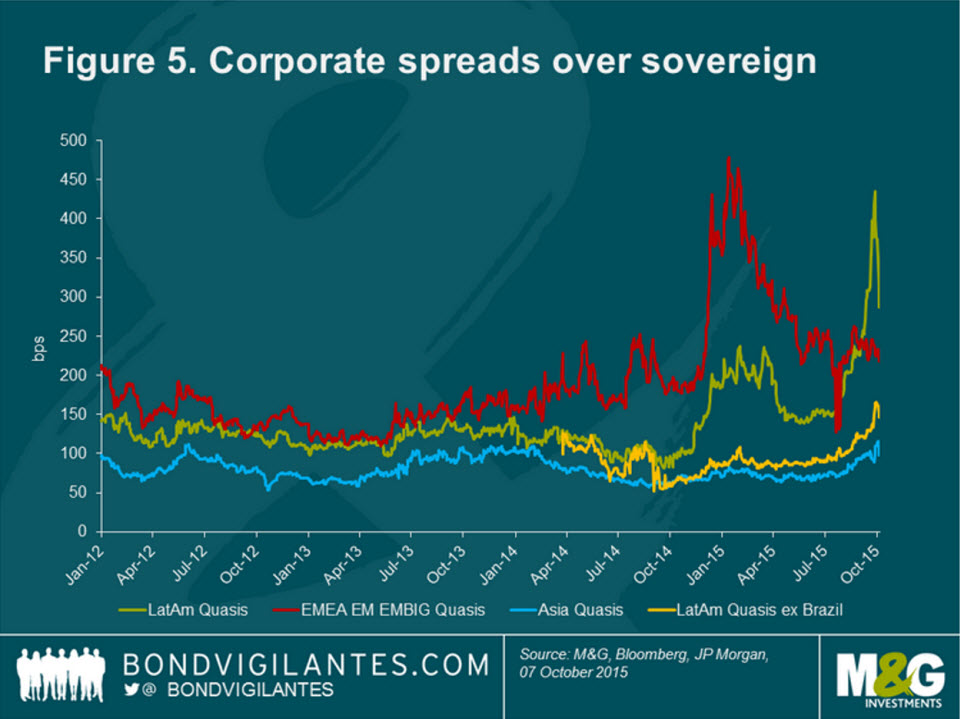
– Looking at spreads over sovereign, Asian quasi-sovereign bonds currently look the least attractive. While corporate fundamentals have been resilient across the region, spreads to sovereign have surprisingly not reacted to the deteriorating macroeconomic environment in Asia and averaged 98 bps as of 7 October 2015. It shows that Chinese state-owned enterprises (SOEs) are still seen as a safe haven for many investors on the assumption that China would not let a government-owned entity go bankrupt. Given China’s slowing economy and the lack of historical evidence of government bailout in case of default, a cautious approach to Chinese quasi-sovereign credit – with a thorough analysis of the standalone credit profile of issuers – seems essential nevertheless, in our opinion.
– In the EEMEA region, the spread pick-up offered by quasi-sovereigns over their respective sovereign looked attractive at the beginning of the year. However, the easing of geopolitics in Ukraine in the first half of 2015 has led to a strong outperformance and spread tightening of Russian quasi-sovereigns (and corporates) during the period.
– Finally, Latin American quasi sovereign spreads look unsurprisingly wide (average 286 bps as of 7 October 2015, well above historical levels, as shown in figure 5). But this is mainly the result of Brazil and, in particular, Petrobras. Adjusted for the largest country in Latin America, quasi-sovereigns spreads over sovereign excluding Brazil are actually relatively flat (only 25 bps wider) since May 2014. Arguably, they are offering little value as (a) Latin American sovereign bonds have widened by more on the back of the deteriorating macro environments, and (b) standalone credit profiles of quasi-sovereign issuers weakened significantly in the past 18 months.
Despite such factors, the pick-up in spreads of quasi-sovereign bonds above their respective sovereigns should continue to offer opportunities for investors looking for attractive yields, but who are also mindful of the rising default environment in the pure EM corporate bond space. Quasi-sovereigns, relative to pure EM corporates, offer a higher likelihood of government support due to their ownership and general strategic importance for their home countries. A selective approach is key against this backdrop, with careful sovereign and corporate credit research, while investors may also want to consider hedging strategies – such as buying credit default swap (CDS) protection in the respective country – in order to reduce sovereign risk.
US companies issued a record amount of more than €27 billion of euro-denominated bonds (known as ‘reverse Yankees’) in the first quarter of 2015, taking advantage of the relatively low financing costs on offer in Europe compared to their home market. This is just one example of how corporate issuers routinely capitalise on local corporate bond market supply and demand dynamics in search of cheaper finance. Such opportunities are not only available to issuers. Those investors with a sufficiently flexible investment strategy can also exploit relative value opportunities across global corporate bond markets and, in so doing, potentially earn a significant pick-up over more constrained strategies. They can also benefit from the many other advantages that flexible global investing offers, such as diversification.
US dollar credit spreads have widened significantly in relative terms
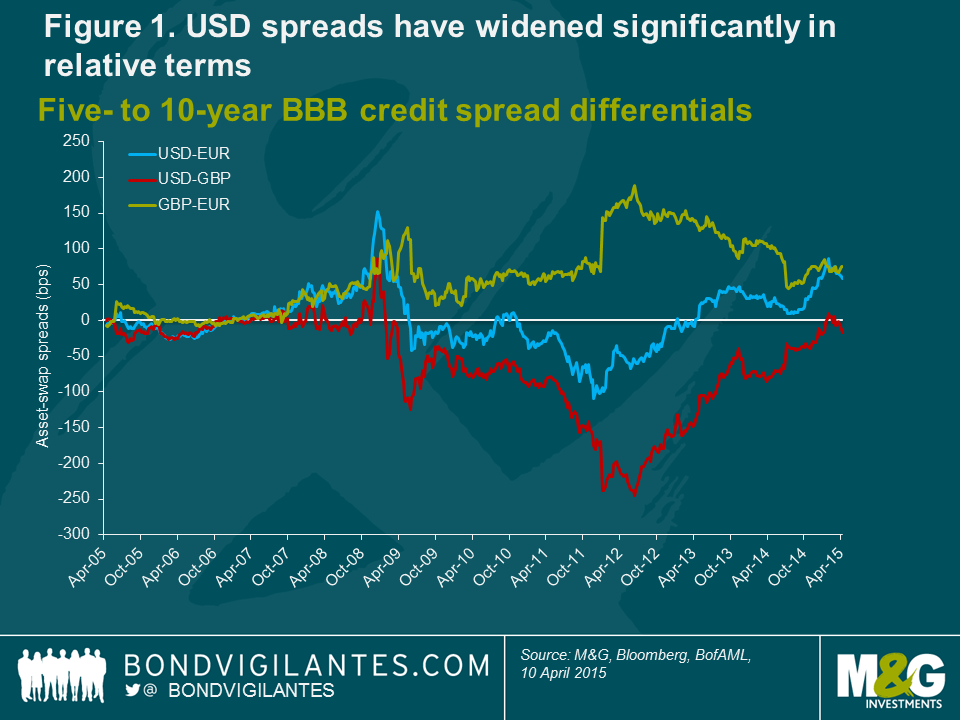
Figure 1 shows changes in credit spread differentials (the differences between credit yields) between USD, EUR and GBP corporate bond markets over the last 10 years, highlighting that USD spreads have widened significantly, in relative terms, more recently. The USD–EUR spread differential has risen by nearly 170 basis points (bps) to +58 bps from -109 bps in November 2011. GBP spreads are currently slightly wider than USD spreads, but the USD–GBP spread has come a long way from its lows of -238 bps at the beginning of 2012 to only -17 bps today. This trend is not confined to USD spreads: relative to EUR spreads, GBP spreads have also outperformed over the past three years, with the GBP–EUR difference trending downwards by around 115 bps since June 2012.
The magnitude of the relative spread movements between USD, EUR and GBP corporate bonds over the past 10 years is also striking. Although we are looking at bonds from the same credit rating band (BBB) and maturity range (5-10 years), the spread differential ranges are substantial. This volatility in spread differentials across corporate bond markets is a powerful argument in favour of global bond investing. At M&G, we look to exploit these cross-market discrepancies through the flexible nature of our fixed income mandates.
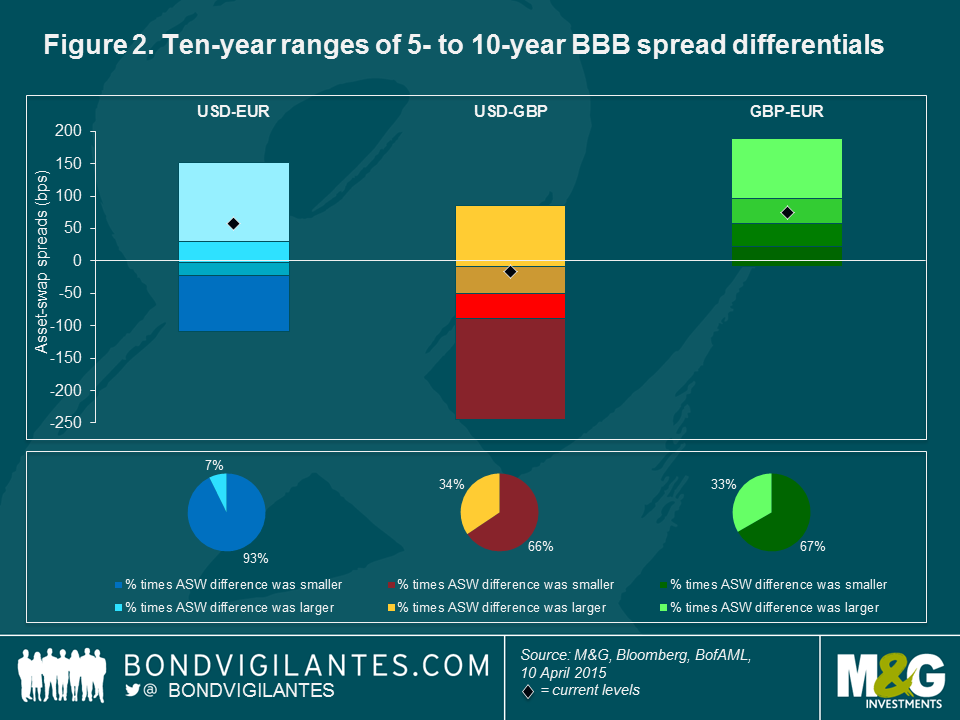
The percentile analysis shown in figure 2 illustrates the spread differential ranges in global corporate bond markets over the past 10 years. The current USD–EUR spread level ranks within the top quartile. Apart from a brief moment at the height of the global financial crisis, USD spreads have never been wider, relative to EUR spreads, in the past 10 years than in the first quarter of 2015. In fact, for about 93% of the time, the differential was smaller (or even negative).
The current values for the other two currency pairs are high relative to their 10-year ranges, too. For roughly two-thirds of the time, the USD–GBP and GBP–EUR differentials have been lower than now, although their position is less extreme than that of the USD–EUR pairing.
On this measure, USD BBB spreads look attractive at the moment, particularly compared to EUR spreads. If we assume that mean reversion (which says that prices and returns eventually move back towards their average over time) will apply, then there is a good chance that USD corporate bonds will outperform EUR bonds on a credit spread basis going forward. But are things really that simple? Unfortunately, they are not.
There are a number of reasons for this. It can be misleading to compare pure credit spread levels between different corporate bond markets without taking the cross-currency basis into account. This is a measure of the premium that borrowers pay to obtain funding in a currency other than their own (see box for more detail). In the case above, this approximate adjustment reduces the attractiveness of USD credit spreads relative to EUR spreads by around 35 bps at the five-year point. Nevertheless, according to our analysis, this leaves an average spread pick-up of approximately 25 bps for switching from EUR into USD BBB credit.
The EUR–USD cross-currency basis
It is surprisingly tricky to compare credit spreads in different currencies on a like-for-like basis. The easiest way to do so is perhaps to think it through from a bond issuer’s perspective. Imagine a US company (A) wants to take advantage of low interest rates in Europe and thus plans to raise debt capital by issuing a EUR-denominated ‘reverse Yankee’ bond. Without any hedges in place, the success (or failure) of this strategy will depend mainly on the future course of interest rates in both markets and the EUR–USD exchange rate. If the company does not have a view on these factors, it will probably decide to hedge away the risks by entering into a cross-currency swap with a counterparty.
The swap works as follows: Company A raises a certain principal amount of EUR debt capital in the European corporate bond market and then passes it on to the counterparty in exchange for the corresponding principal amount in USD, based on the spot EUR–USD exchange rate. During the life of the swap, Company A will pay USD interest on the USD principal to the counterparty, for example, at 3-month USD Libor. In exchange, Company A will receive EUR interest on the EUR principal, for instance at 3-month Euribor plus a certain margin, which can be positive or negative and is called the cross-currency basis. Company A can use these intermediate EUR cashflows to pay the coupons to its EUR bondholders. At the maturity of the swap contract, the USD and EUR principals are again exchanged between Company A and the counterparty. Company A can then use the terminal EUR cashflow to redeem the outstanding EUR bond.
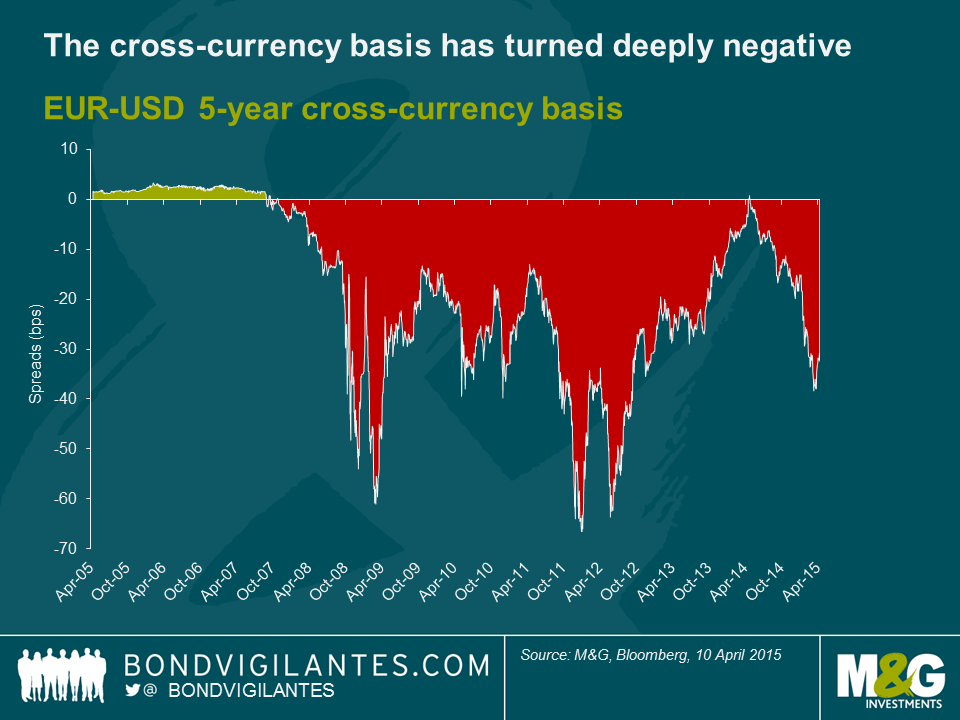
The cross-currency basis moderates market supply and demand for one currency over another. For example, when many US issuers want to issue euro-denominated bonds, as we have seen in the past year, the terms get worse. In other words, the cross-currency basis their counterparties are willing to pay them will decline. As the chart below shows, this is exactly what has been happening: the EUR–USD 5-year cross-currency basis has moved deeply into negative territory to around -35 bps.
The fall of the EUR–USD cross-currency basis thus makes it less appealing for issuers to raise funds in EUR than in USD. Since bond issuers and bond investors are two sides of the same coin, this means that a negative cross-currency basis improves the relative attractiveness of EUR bonds over USD bonds. To put it the other way round, we have to adjust USD–EUR credit spread differentials downwards by essentially adding the negative cross-currency basis to USD spreads.
While this is a simplification, as it ignores other factors affecting credit spread differentials between comparable bonds issued in different currencies, such as home bias, it provides a general indication. The key message is: USD credit spreads are attractive versus EUR spreads for bond investors at the moment, but the valuation difference is less appealing than it looks at first glance.
US credit spreads facing headwinds
Additionally, even if USD corporate bonds are offering attractive spreads compared to EUR bonds, there may be good reasons for this seeming discrepancy. USD credit spreads are currently facing a number of headwinds, the result of the US economy being at a later stage of the credit cycle than that of Europe. Firstly, leverage has been ticking up and merger and acquisition (M&A) event risk has been rising, at least in certain sectors, notably telecommunications, healthcare and consumer goods. Secondly, export-driven US companies have been hurt by the strengthening of the US dollar against most major currencies. Thirdly, unlike the European Central Bank, which is in fully fledged quantitative easing mode, the Federal Reserve is now providing less monetary stimulus and is likely to hike interest rates in the relatively near future, making refinancing activity for US companies more costly going forward. Fourthly, the energy sector has a much higher weight in USD BBB indices than in EUR indices, and thus average USD credit spreads have been suffering more severely from suppressed oil prices. And finally, many US companies have also been distinctly shareholder-friendly, engaging, for instance, in debt-financed share buy-backs.
All of these points are valid and need to be considered on a case-by-case basis when comparing the relative attractiveness of USD and EUR credit. Yankee bonds, as US dollar-denominated bonds issued by European or other non-US entities are known, offer a way of getting around most of the credit-negative aspects of the US bond market while still getting exposure to the favourable USD credit spreads. In addition, Yankee issuers are often less well researched by US analysts, and thus frequently offer a spread premium to engage the interest of US investors. Similarly, we can often find compelling relative value opportunities in the USD bonds of many US-based issuers at the moment. But within these categories, which maturity band currently presents the most interesting opportunities for corporate bond investors?
Today: record term premiums on offer in USD credit
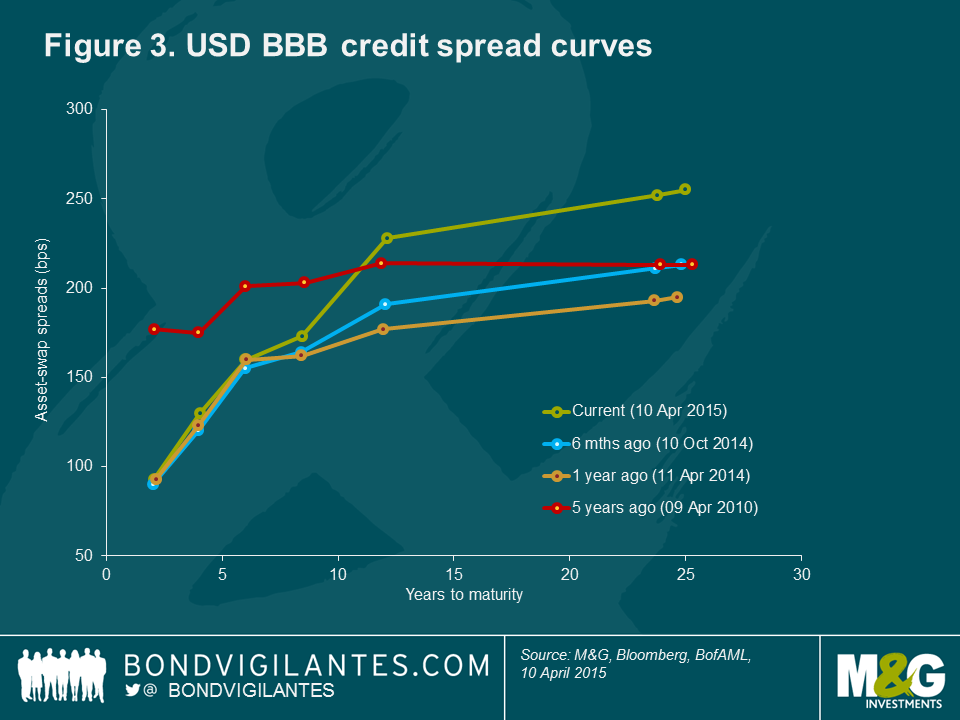
To answer this, we need to look at the steepness of credit spread curves. In figure 3, we have plotted the latest USD BBB credit spread curve alongside historic curves. Over the course of the last year, a considerable steepening has taken place. Interestingly, spreads remained pretty much unchanged at the lower maturity end, but have widened substantially beyond the six-year mark. The 25-year to 6-year spread differential has increased by 60 bps to 95 bps since April 2014. The current 25yr–2yr term premium amounts to 162 bps – about four-and-a-half times that of five years ago.
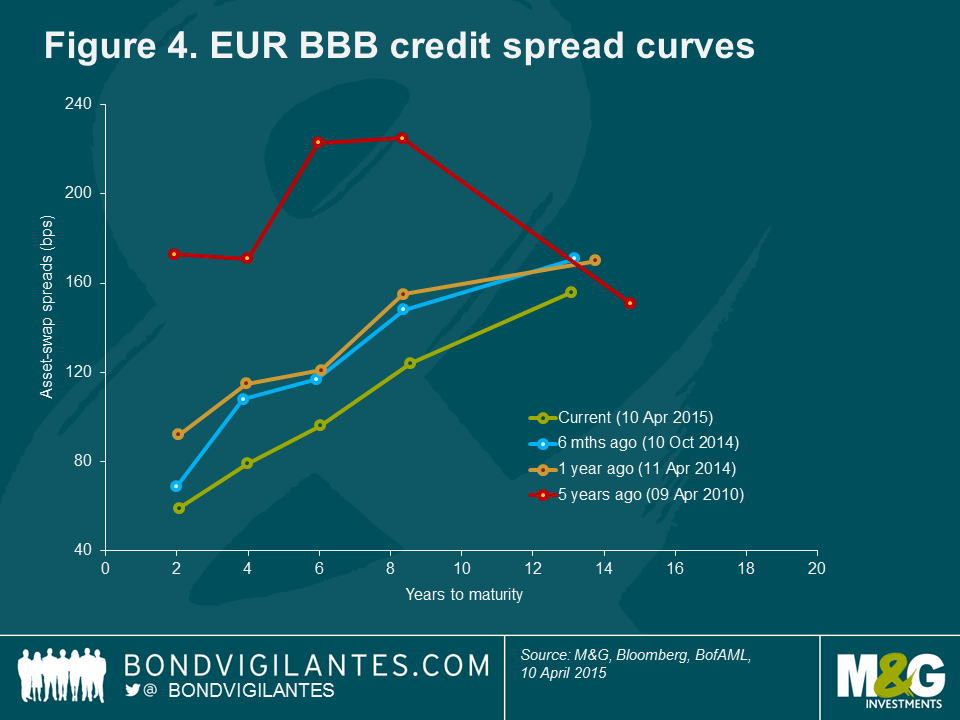
Things are a little different for EUR BBB credit, as shown in figure 4. Lower average maturities in the EUR corporate bond markets result in shortened credit curves. Over the past year, term premiums have moderately increased to 97 bps (13yr–2yr) and 60 bps (13yr–6yr). In contrast to the USD curve, however, the steepening of the EUR credit curve has not resulted from underperformance at the long end. Instead, the whole curve has shifted downwards and spreads at the short end have slightly outperformed those at the long end. In the vast majority of cases, credit spread curves are upward-sloping, which makes sense intuitively, as bond investors typically demand a higher credit risk term premium for lending for a longer time. In times of financial distress, though, credit curves can adopt less regular shapes. The EUR BBB curve from April 2010, for instance, as the eurozone debt crisis gained momentum, displays a significant hump at intermediate maturities.
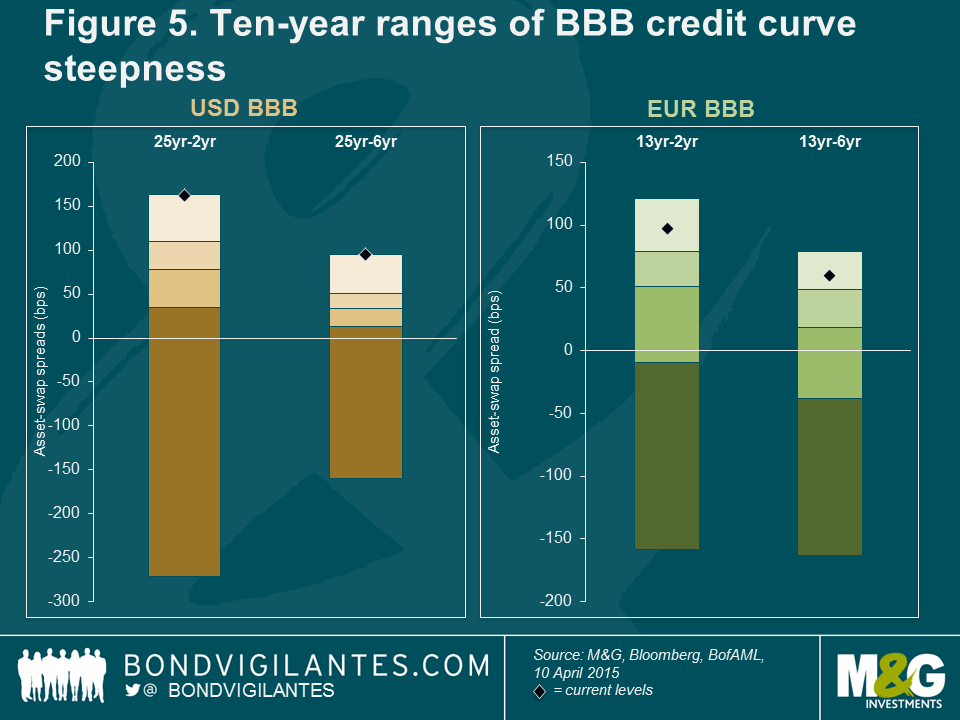
A comparison of the most recent USD and EUR steepness readings versus their 10-year ranges highlights just how steep credit curves are at the moment. All current term premiums shown in figure 5 are located within the top quartile. The situation in the USD BBB bond market is particularly extreme as both the 25yr–2yr and the 25yr–6yr differentials are at record highs, opening up an attractive relative value opportunity. Investors who are willing to take long-dated credit risk exposure in the USD corporate bond market are handsomely compensated in terms of credit spread.
It is worth remembering that a large portion of the steepening in the USD credit curve has been counteracted by the simultaneous flattening of the US Treasury curve, making the total yield pick-up at the long end less compelling. However, for those investors able to lock in pure credit risk exposure, for instance by using US Treasury futures to remove or reduce their duration exposure (their sensitivity to a change in interest rates), long-dated USD credit looks highly appealing at the moment.
Tomorrow: where will the most attractive opportunities lie?
There is little argument that USD corporate bonds are currently attractively valued on a credit spread basis, particularly when compared with their euro-denominated counterparts. Even taking unfavourable cross-currency basis adjustments into account, there is a decent spread pick-up to be gained from switching into USD corporate bonds from EUR corporates. The steepness of the USD credit spread curve has become so extreme that ample term premiums can be earned at the long end.
But this currently favourable valuation of long-dated USD credit represents merely a snapshot in time. The ranges across which both credit spread differentials in global corporate bond markets and credit curve term premiums move are remarkably wide. Adopting a sufficiently flexible global corporate bond strategy enables investors to take advantage of the myriad cross-market relative value opportunities that inevitably present themselves one way or another over time.
It may only be June as I write this, but it already feels as if we have crammed a whole year’s worth of events into the first six months of 2015.
The year kicked off at a whirlwind pace, with the long-awaited announcement by the European Central Bank (ECB) that it would finally begin its quantitative easing (QE) programme nearly upstaged by the Swiss National Bank’s surprise move shortly beforehand to abandon its currency peg. The resulting move in the Swiss franc, the biggest ever one day move in a major currency, combined with the promise of the larger-than-expected €1.2 trillion ECB package helped push significant parts of the bund market into negative yield territory. In Switzerland, 60% of banknotes in circulation are held in the largest CHF1,000 note, perhaps for ease of storage outside of the banking system – a fact that has presented us with an alternative vision for M&G’s staff canteen: one crammed full of heavy metallic safety deposit boxes rather than Styrofoam lunch containers.
This was not all for January: by month-end, a Greek election and the latest in the country’s endless eurozone in/out soap opera, and a grand total of 14 central bank rate cuts had also been squeezed in.
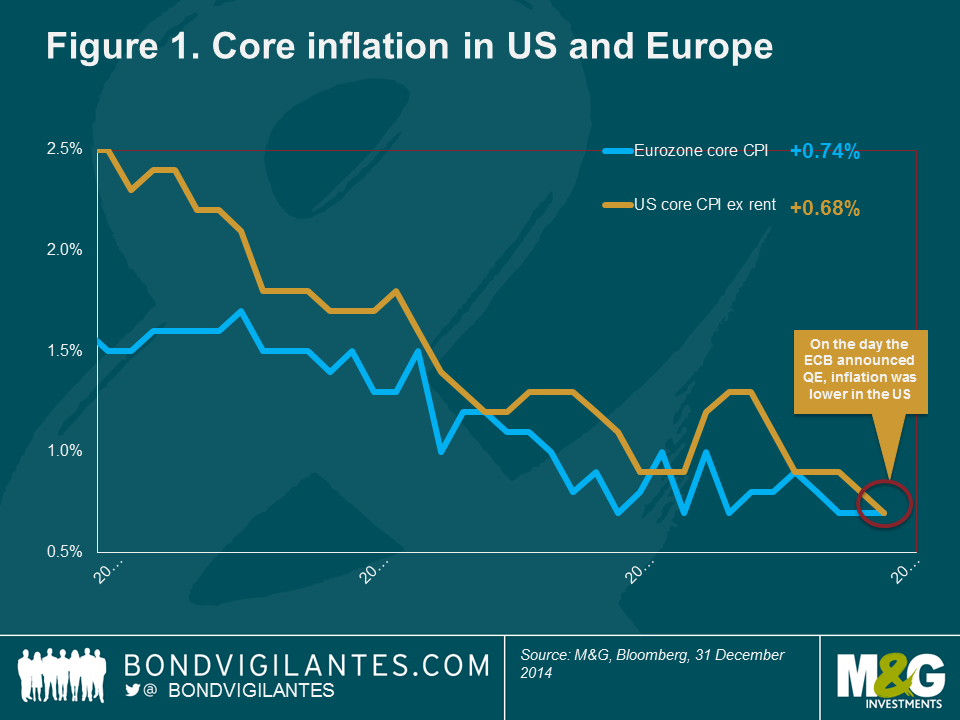
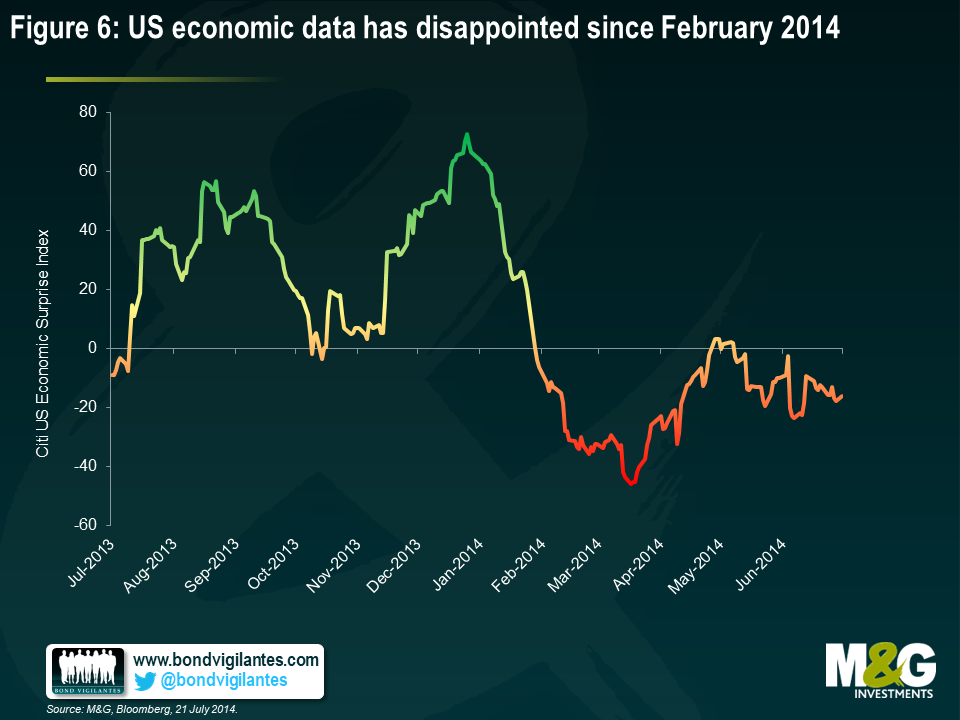
But while markets panicked – and continue to do so – about eurozone deflation, some context can prove illuminating. In this case, as figure 1 shows, on the same January day that the ECB announced its huge balance sheet expansion, US core inflation (on a like-for-like, ex housing basis) was actually lower than in the eurozone and had fallen more quickly. Even so, at that stage, markets still expected a US rate hike in June.
More recently, a government bond sell-off that saw the ‘risk-free’ German 2.5% 2046 bond fall nearly 20% in less than three weeks following a peak on 20 April, has again highlighted the risk to capital that bond investors can face when yield curves rapidly re-price. This has refocused attention on the disparate behaviour of the various fixed income asset classes in such an environment, as well as the importance of duration positioning on bond returns.
The Fed: timing is everything
The Fed (US Federal Reserve) is facing a quandary. After more than six years of close to zero interest rates, it would dearly love to begin hiking, giving it the luxury of having both a brake as well as an accelerator when setting policy. A number of developments over recent months – namely the rally in equities, the growth in the sub-prime auto loans market, and the return more generally of structured credit – worryingly resemble the period 2003-07, during which the Fed kept rates too low. There have also been some early signs of wage growth creeping back into the system, as evidenced by wage hikes for Walmart and McDonalds employees, amongst others. Latest data show US wage inflation running at 2.6% for the first quarter of 2015, up from 1.8% a year earlier.
Central to Fed Chair Janet Yellen’s dashboard of key economic indicators are several employment metrics, including JOLTS (Job Openings and Labour Turnover Survey) and quits (when employees voluntarily leave their current employment, often because they are accepting a new position). These add an extra layer of dynamism to the wider labour market picture. Based on the bullishness of these indicators, a rate hike should soon become a reality. But Yellen and the Fed remember the lessons of the Great Depression well – remove stimulus too soon, and a rapid descent back into recession could be on the cards. The Fed is left gambling that it will be easier to fight inflation by hiking rates than combating deflation in an already zero-bound world. This in turn helps push back the potential risk that higher rates lead to dollar strength, further impacting US corporate profits.
There has been a significant shift in the Fed’s dots charts since the start of the year (as a reminder, Federal Open Market Committee member estimates regarding the long-run Federal Reserve Funds Target Rate as shown in its so-called ‘dots’ chart are helpful when drilling down into how tightening might unfold). The chart provides a guide not only to the direction in which bond yields should go, but also by how much. This shift has brought the Fed’s expectations more into line with what the market is now pricing in (see figure 2). In its current incarnation, it shows the magnitude of term premium (see box on what drives the term premium) and highlights why we remain short duration across our fund range. But this can’t be taken in isolation: the ECB’s liquidity glut is being exported around the world. For a German insurance company needing to deliver guaranteed returns to its customers of, say, 1.5%, it’s a no-brainer to buy 10-year US Treasuries yielding 2% rather than bunds at 0.2%.
What drives the term premium?
Long-dated government bond yields can be split into three components – expected inflation, expectations about the future path of real short-term interest rates, and a term premium, reflecting the extra return that investors require to own a long-dated bond. Typically, term premium is positive, as investors usually need extra yield to compensate them for the risk of owning longer-dated paper. However, term premium on US Treasuries collapsed last year and recent measures show it to have actually been negative in early 2015.
So what drives the term premium? Historically, the most important factor has been inflation – and the perceived risk of unexpected inflation. A low term premium today suggests that investors currently see little risk of this occurring. Demand and supply factors also exert some influence. For example, US Treasury issuance heavily skewed towards the short end of the curve in the early 2000s contributed to a fall in the term premium around this time.
One possible explanation for the collapse in US term premium in recent months comes from overseas. A higher term premium in the US has historically encouraged portfolio flows into US Treasuries from abroad, and vice versa (see chart). More recently, the diverging policy actions of the Fed and the ECB have had a major impact, with a strong European bond rally in 2014 on expectations of QE from the ECB.
The implication here is that longer-dated US bond yields have, at least recently, had little to do with US-specific factors. The impact of the belated arrival of the ECB’s QE is now being exported to the US. This suggests that the Fed is far from being in complete control of its own monetary policy and gives Fed Chair Janet Yellen yet another issue to consider in her deliberations on exactly when, and how aggressively, to finally begin hiking US interest rates.
Europe: better prospects on the horizon
Turning to Europe, it’s fair to say that if you were designing policies to generate deflation, you would have followed the exact path followed by the region’s policymakers in recent years. Europe has adopted the polar opposite of the three arrows espoused under ‘Abenomics’ (in Japan). From a monetary perspective, policy decisions had drained some 40% from the eurozone’s balance sheet by the end of 2013, although more recent decisions have reduced this somewhat to a little over 20% (see figure 3). From a fiscal standpoint, excessive austerity and Germany’s focus on ‘Black Zero’ (its goal of moving from a budget deficit to a small surplus for the first time since 1969) mean there is little appetite or ability to fight deflation in this way. Structural reform has been equally slow.
But there is now – finally – some good news, with the introduction of potentially limitless QE, the likelihood of less fiscal austerity to come, and some small signs of structural reform. Regarding the latter, Italian Prime Minister Matteo Renzi has to date struggled to make much progress with his ambitious reformist agenda, so any advancement here could prove significant.
The potentially even better news is that the ECB’s programme of asset-backed securities (ABS) purchases has not really begun yet. This may take time to pick up speed, but if it does so, it should provide a good way for banks to get stale loans off their balance sheets, by repackaging them and selling on to the ECB at a profit. This should, in turn, support bank profitability, shrink banks’ balance sheets and enable new loans.
While it is still early days to apportion significant results to the ECB’s QE programme, the eurozone officially moved out of deflationary territory in April, following four months of falling prices. This modestly higher inflation figure, along with a recovery in oil prices, a weaker single currency, and improvement in economic data has created a renewed demand for inflation-linked assets. In our view, despite a strong rally in recent months, European breakeven rates continue to price in too little inflation over the medium term, and so short-dated government linkers offer good value versus conventional government bonds.
Credit: technical, valuations and fundamentals suggest value
QE changes investors’ behaviour, leading them further out along the risk curve against suppressed government bond yields. In recent months, we have begun to find better relative value on a selective basis in the high yield market following the underperformance by segments of the asset class in the latter part of 2014. Importantly, going forward, the ECB and Bank of Japan QE packages should support demand for high yield bonds.
I wrote at the end of last year about my preference for the floating-rate note (FRN) segment of the market. This remains a valid means of taking advantage of further US dollar strength, Fed rate hikes and improving US corporate and banking sector health. I have also been finding value in conventional US corporate bonds. US spreads actually widened in 2014, partly due to huge new issuance and the knock-on effects for energy companies of the oil price collapse later in the year. Investment-grade corporate bonds look attractive at the moment, according to the three key factors of technical, valuations and fundamentals. Meanwhile, liquidity has again been a hot topic in the press in recent months, and is something that investors are right to be mindful of in the present environment (see box on liquidity).
Liquidity: an ever-present challenge
Back at the end of 2014, we wrote about the changing face of corporate bond market liquidity, and how liquidity conditions in today’s world appear increasingly linked to the direction of spreads (decent in times of narrowing spreads, and correspondingly poor as they widen). The topic of liquidity has not gone away since then, and indeed has been exacerbated by the second-quarter government bond market sell-off that has sent bond yields soaring.
A lack of liquidity in and of itself is not necessarily something to be feared, as long as an appropriate level of liquidity management is observed. Liquidity risk is often misunderstood: a bond could be defined as perfectly liquid, should an investor be prepared to sell at a significant discount. Instead, we define liquidity as the ’cost of immediacy of trading’, that is, the ability to execute trades at a reasonable market level.
Like all risks, investors can be rewarded for accepting liquidity risk, charging a premium that can be attractive in today’s low-yield environment. In fact, we see significant value in doing so in certain segments of the markets. In our view, investors in BBB rated corporate bonds are being paid well in excess of the liquidity and default premia that we feel investors can demand for the risks involved in lending to these investment grade-rated companies (see chart).
To mitigate liquidity risk, managers can undertake measures that include (but aren’t limited to) investing in government bonds; holding short duration, high-quality corporate bonds; holding a cash or cash-like buffer; favouring on-the-run (most frequently traded) bonds over off-the-run bonds; owning senior debt relative to subordinated debt; using derivatives like credit default swaps and futures; investing in primary market issuance as a source of supply; and maintaining diversified portfolios with concentration limits.
At M&G, liquidity management is embedded within our investment process. We also have a dedicated risk management team, and a formal governance structure in place that carries specific liquidity management responsibilities.
Emerging markets: sovereigns look safer than corporates
It should be no surprise to hear us describe ourselves as longstanding China bears – a standpoint that seems entirely consistent with the slower growth we have seen coming out of the country.
I have been wary of emerging markets (EM) for some time based on a number of themes, including the strengthening US dollar as well as slowing Chinese growth. But as usual there are two sides to every story. Emerging market sovereigns, having largely borrowed in local currency rather than US dollars, are not in terrible positions and have some control over their own destiny. The picture is somewhat less rosy for EM corporate issuers, who took greater advantage of low US dollar-denominated borrowing costs and, in so doing, have created a bigger market than the US high yield market. Many of these have not hedged their dollar liabilities and will be particularly vulnerable when higher rates do take hold.
As usual, the key is to be selective. For example, I have bought some local currency Mexican and Colombian debt since the start of the year due to the aggressive sell-off in both currencies in 2014.
Currency: further US dollar strength on the cards
The strong US dollar has been a big story during much of 2014 and into the first part of 2015, and we expect dollar strength to continue, based on the relative strength of the US economy and likelihood of more imminent rate rises there than elsewhere.
That said, given the significance of the greenback’s rise versus other key currencies, such as the euro, since the start of the year, I took some profits in the currency during the first quarter as the rise in the dollar had been quite extreme. However, over the last few weeks, I have been adding some dollar exposure back as I expect the US Fed to be the first major central bank to raise interest rates, and interest rate differentials are likely to be a key driver of currencies over the next 12 months.
As the dust settles following the UK election result – in which voters and investors alike were surprised to see the Conservative party achieve a parliamentary majority (albeit a slim one) – recent sterling strength may be challenged. In our view, a dovish Bank of England, the UK’s very large current account deficit, and the renewed prospect of an in/out referendum on British membership of the European Union by 2017 will likely weigh on the currency. As a result, we remain wary (read: underweight) on sterling. While it may feel like 2015 can’t yield too many more surprises, in reality, the second half of the year could yet turn out to be equally frenetic.
It has become customary in recent years for January to begin with strategists making dire predictions for bond markets. And yet 2014 has, like its immediate predecessors, conspired to confound the vast majority of these expectations. While equity markets have delivered decent returns in the main this year, the predicted bond market rout has failed to materialise.
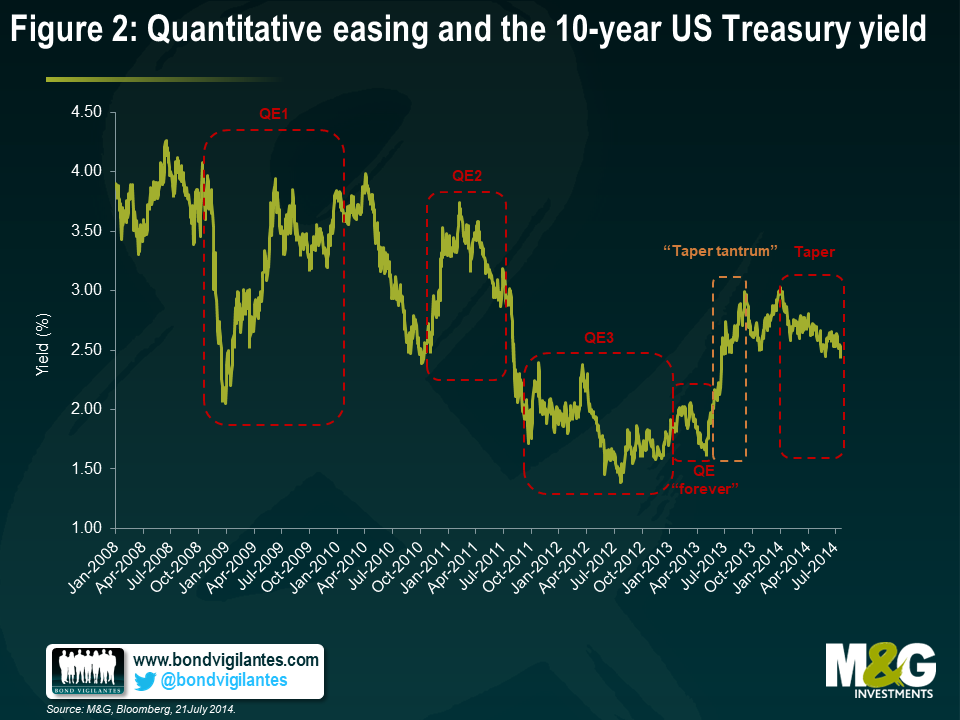
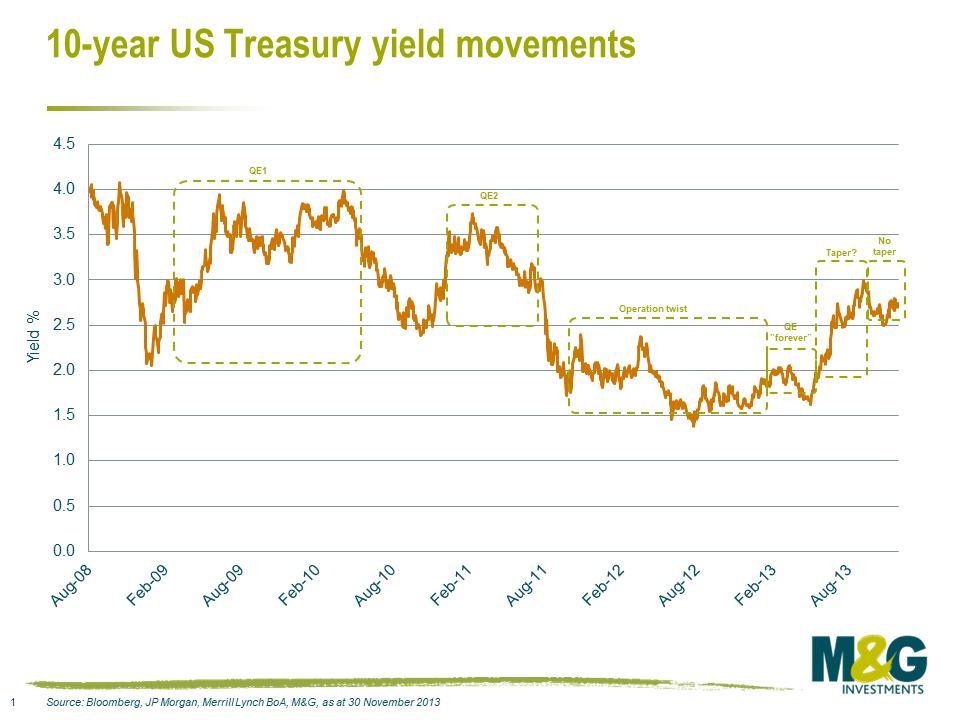
At the start of 2014, the consensus was that 10-year US Treasury yields would rise north of 3.25%. This was based on the view that the US Federal Reserve (Fed) would end its six-year quantitative easing (QE) programme, which has seen its balance sheet swell to more than US$4.5 trillion, and that the country’s growth would start to become self-sustaining.
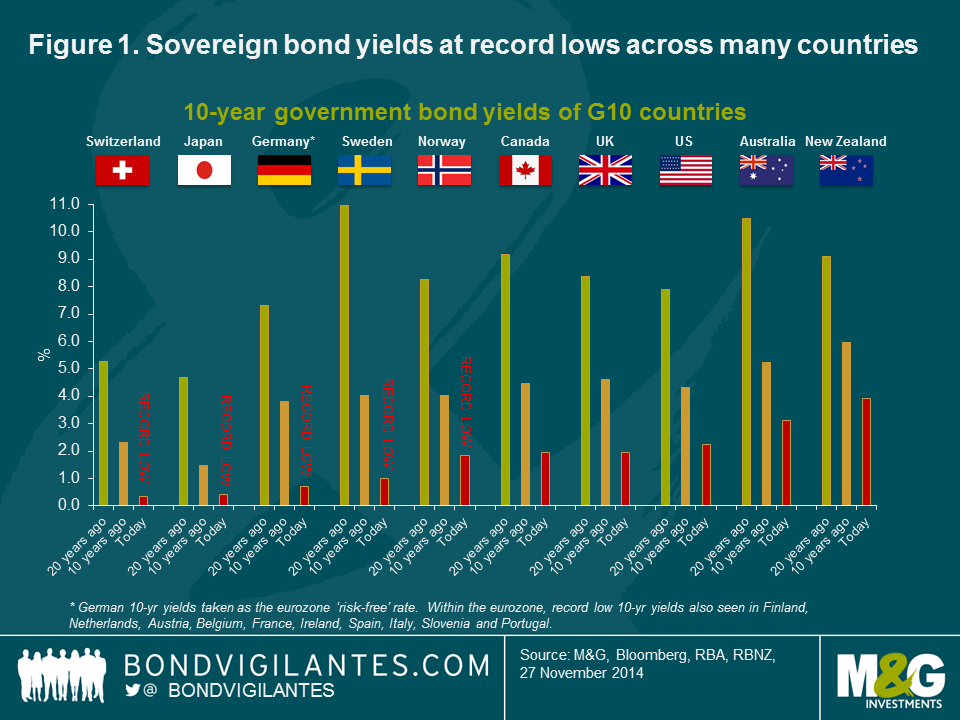
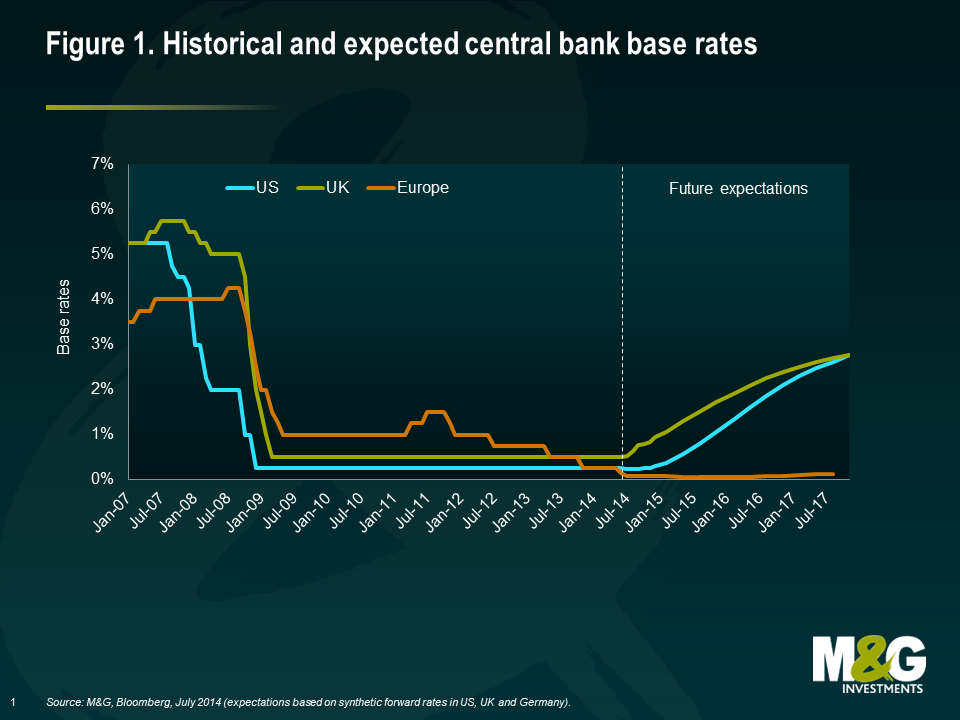
As I write, the US is growing nicely and the Fed did indeed end QE in October. Yet global government bond yields have plummeted – yields on 10-year US Treasuries were 2.2% at the end of November, and European bond yields are at all-time lows (see figure 1). The same is true for Japan. So what explains the further collapse in bond yields that caught almost every Wall Street strategist and economist off guard (with the notable exception of HSBC’s Steven Major, who forecast 10-year Treasuries at 2.1% by year-end), and what does it mean for bond investors in 2015?
Wintry weather, resurgent geopolitics
To start with a summary: 2014 began with some awful weather in the US, leading to a very weak first-quarter gross domestic product (GDP) headline figure. Ben Bernanke then held a series of hedge fund-hosted dinners, just months after standing down as Fed chairman, in which he told those listening that the market’s view of normality was too rosy – rates, yields, growth and inflation would all, in the Fed’s view, be lower than the market was pricing. Waves of geopolitics then hit: Russia/Ukraine, Middle East violence, Hong Kong’s anti-Chinese protests, and Ebola. These ‘risk-off’ events stimulated a flight to quality amongst investors. Safe-haven assets like high-quality government bonds benefited from the uncertainty caused by these geopolitical factors.
The Real Level of China GDP Growth
Perhaps one of the most frequent questions about China’s record decade of growth is whether it is actually real. Commonly, there are a number of reasons to doubt the accuracy of China’s GDP data. To begin with, the Chinese local government structure has various political disincentives to reporting accurate GDP figures. Local officials are promoted almost entirely on the basis of their locality’s growth rates, hugely motivating them to report increasing GDP figures. At the central government level, it appears politically necessary that GDP continues to rise, particularly now as policymakers are pressured to sustain growth in the face of a rebalancing economy.
One reason for economists’ scepticism over China’s GDP numbers is that the Chinese National Bureau of Statistics takes just two weeks to collect its GDP data, compared with six weeks for (the much smaller) Hong Kong, and eight for the US.Even China’s premier, Li Keqiang, has expressed doubts about the data, admitting, over dinner with the US ambassador to China in 2007, that the figures were, “man-made and therefore an unreliable statistic”. Instead, he suggested focusing on three data points – electricity consumption, rail cargo volume and bank lending – as a better proxy to evaluate China’s economic progress.
Economists have, since then, tried to put together alternative indices to gauge China’s true growth. We recently discussed Citigroup’s inspired ‘Li Keqiang Index’ which uses the three indicators mentioned above. To nobody’s surprise, it points to a more pronounced slump in growth than that suggested by official Chinese numbers.
China’s debt levels built up dramatically over the past decade. Thanks to recent policies aimed at limiting the supply of new credit, debt growth is now slowing. The property market is one of the most sensitive barometers of this, with monthly house price declines in roughly 75% of Chinese cities recently. There is also evidence that the market is saturated and inventories have ballooned. Yet, in spite of this, GDP growth in the third quarter came in better than expected at an annualised rate of 7.3%.
Some argue that the reliability of the ‘Li Keqiang Index’ may be compromised since its underlying indicators were mentioned. Back in 2007, when the conversation took place, the Chinese economy, and the Liaoning province in particular, were far more reliant on heavy industry. However, the structure of the national economy has changed dramatically and today, the services sector accounts for a greater share of the economy, requiring a very different method of measurement.
Given the challenges of assessing the real level of China’s GDP, some of the volume data, such as power and rail freight, may be interesting as there is less incentive at the local government level to massage them. However, they only reveal part of the truth and must be assessed in conjunction with a broader range of economic indicators. Regardless, the various data sources seem to be converging around the point we have been arguing for many years – that China’s growth is slowing and this will ultimately have significant consequences for countries that have become increasingly reliant on strong Chinese growth.
Finally, and perhaps most importantly as we look into 2015, we have a global deflation scare – the new aim for central bankers is to get inflation up to 2%, rather than driving it down as before. Recent Consumer Prices Index (CPI) levels of 1.7% in the US and 1.3% in the UK give moderate cause for concern, but it is the eurozone, with annual inflation of just 0.4%, that is the real worry, particularly as this includes five peripheral eurozone economies that are now in deflation (Greece, Spain, Italy, Slovenia and Slovakia).
Many are questioning why 2014 did not turn out as they had predicted. Larry Summers, former US Treasury Secretary and economic adviser to Barack Obama, believes that developed economies are entering into a period of ‘secular stagnation’ – an environment in which growth in rich economies grinds to a halt due to significant underinvestment in future potential. If secular stagnation sets in, the only way to fuel growth is through the development of mini asset bubbles which aim to drive consumption levels higher.
Another reason that some investors are pointing to in order to explain the fall in yields this year is a high level of global savings and liquidity after multiple rounds of central bank quantitative easing. Others suggest that yields are low because governments are too reliant on central banks and haven’t done enough to facilitate sustainable economic growth.
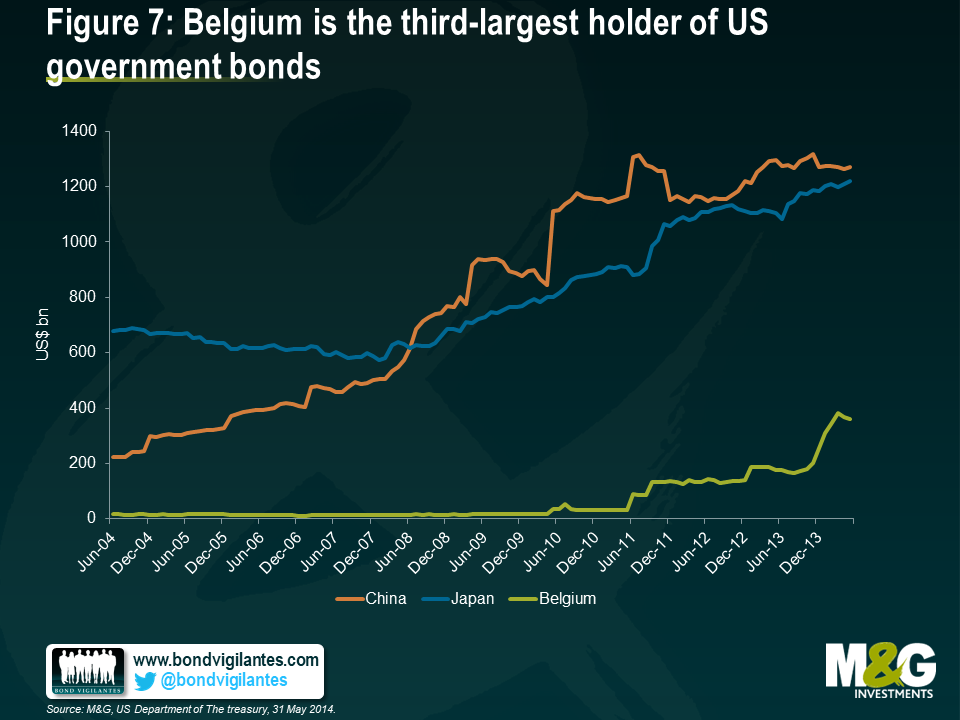
There’s certainly some truth in the idea that if the US government hadn’t fallen over the fiscal cliff in 2013, if the European Commission and the German government had loosened their approach to austerity and deficit reduction, and if the European Central Bank (ECB) had increased rather than shrunk its balance sheet in the past couple of years, we might not be in this position. But these new deflationary pressures aren’t coming purely from the western world. China’s economy is inescapably slowing (see box entitled The real level of China GDP growth). This isn’t necessarily a problem for China itself, as its institutions are very used to micromanaging different parts of its vast economy and regions, and it also owns around US$1.3 trillion of US Treasuries that it could sell to finance a fiscal stimulus if required.
However, the knock-on effects of a China slowdown are significant. Lower growth means less investment in infrastructure, housing and other construction projects. The prices of raw materials could fall – those minerals and metals that are exported by countries such as Chile, South Africa and Australia. Chinese consumers could have less disposable income to buy New Zealand’s premium powdered milk, and firms may spend less on German capital goods or American digger trucks. And it means that the downward pressure on global energy prices is coinciding with a Saudi Arabian oil glut and US energy self-sufficiency on the back of the shale oil revolution.
It has been this collapse in oil prices (see box entitled Oil’s positive shock), from US$120+/barrel to less than US$75/barrel, that will have a significant impact on headline inflation numbers, especially in the US where low taxes on gasoline at the pump mean that oil price falls feed through quickly and aggressively into the CPI. In the UK and Europe, where most of the cost of fuel is tax, the impact is more muted but still present.
Deflation: the new enemy
Surely this is good news for consumers? Absolutely! History shows that movements in energy costs are perhaps the single biggest driver of changes in economic growth. As a result, 2015 should be a year where growth rates finally get the help they need to reach escape velocity. It’s the single biggest reason to be cheerful.
But in some ways, central bankers will regard this latest weakness in commodity prices (and, for largely unrelated reasons, food prices) as inconvenient at best. With inflation numbers well below those 2% targets, consumer and market expectations of future inflation deteriorating, and interest rates already at the zero bound, they are flirting with deflation. Indeed, there is a growing nervousness that not only are asset bubbles being created, but that we are nearing a situation of ‘Japanification’, in which both consumption and corporate investment is permanently deferred as individuals and businesses realise that falling prices means there it is never a good idea to buy something today.
The eurozone crisis to date has been characterised by last-minute action, with seemingly great reluctance from Germany. What’s more, that action has been driven by financial markets rather than cold economic data, political pressure from peripheral governments, or even street protests. This time could be slightly different, as for the first time Germany’s economy is also in trouble, as it finds itself unable to find buyers for its exports. But with Germany continuing to put emphasis on ‘Black Zero’, its goal of moving from a budget deficit to a small surplus for the first time since 1969, it looks unlikely that fiscal largesse will play a part in any concerted deflation-fighting policies. So that leaves the ECB, itself part responsible for the current predicament through its shrinking balance sheet.
Oil’s Positive Shock
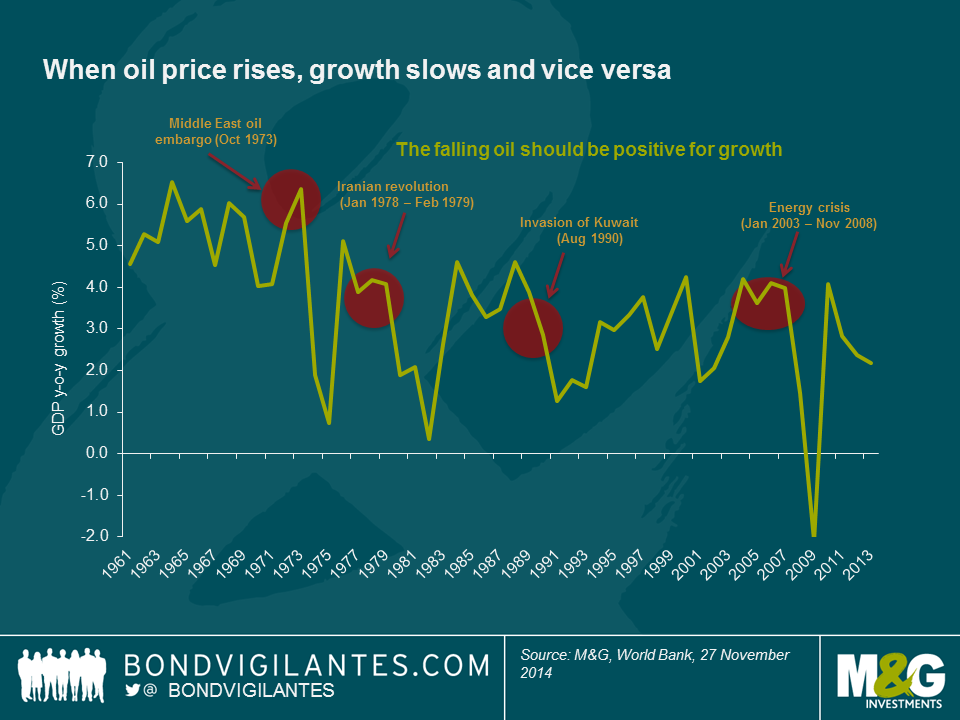
The path of oil prices has been far from steady over the last few decades. In 1973, the world’s major industrial countries were faced with an oil embargo from the Middle East, leading to a petrol shortage. The ensuing crisis caused economic growth in a number of countries, including the US and UK, to stagnate as oil prices quadrupled. Then in 1979, oil production fell as a consequence of the Iranian Revolution, again causing oil prices to rocket.
The 1990s witnessed the next significant spike in prices, this time in response to the Iraqi invasion of Kuwait. More recently, a combination of supply and demand factors contributed to the oil price ascending between 2003 and 2008.
But this time it’s different – oil prices have tumbled and now stand at five-year lows. Historically, significant changes in the oil price have been driven by supply constraints and high demand, resulting in a drag on world GDP. In recent times, however, the oil price has been driven lower by an oil glut. Excess supply from both the US and OPEC has resulted in a flood of oil against a backdrop of flat consumption. Meanwhile, OPEC officials confirmed after their meeting in October that the organisation is in no hurry to cut output.
The current positive supply shock transfers real income from producers to households, which should have an impact on the wider economy through increased spending and demand for other goods. With oil prices falling, the global economy is set to benefit from an estimated US$200 billion uplift. As an input to production, lower oil prices also make it economically feasible to produce more GDP with existing technology. Although deflationary in the short term, this is expected to be positive for world growth over longer time horizons, as the fall in oil price provides great consumer stimulus which (all else being equal) should help to lift global GDP in 2015.
The ECB finally started to buy covered bonds and asset-backed securities during the autumn, and has reintroduced a targeted long-term lending programme (the T-LTRO) in order to stimulate private-sector borrowing. So far, none of these activities has been the ‘big bazooka’ that might change sentiment in the same way as QE was for the Fed, Bank of England, and now even the Bank of Japan.
There are some signs of hope: whilst initial take-up of the T-LTRO facility was disappointing, it’s likely that some of this was related to the announcement of the ECB’s own stress test results. Now that the Asset Quality Review is finished, and banks know whether they passed or failed, there is capital raising to be done. As a result, we expect a large amount of so-called AT1 bank debt to be issued in the coming months (see box entitled The rise and rise of CoCos). It also means that the uncertainty around the stability and capital needs of the eurozone’s banking sector is behind us, and that banks can lend the ECB’s cheap money on to their customers. We expect future demand for T-LTROs to increase, helping to reverse the decline in the ECB’s balance sheet and boosting end demand.
Whilst full-blown quantitative easing has yet to materialise, ECB President Mario Draghi and other council members have made it clear that it continues to be an option. Legal challenges to this from the German Constitutional Court remain a possibility. But if inflation fails to stabilise in the coming months, we expect to see out-and-out QE in 2015, with bond purchases spread across eurozone member nations in proportion to their economic importance. This should mean a general lowering of yields across the single-currency area, and a further narrowing of Spanish and Italian bond spreads.
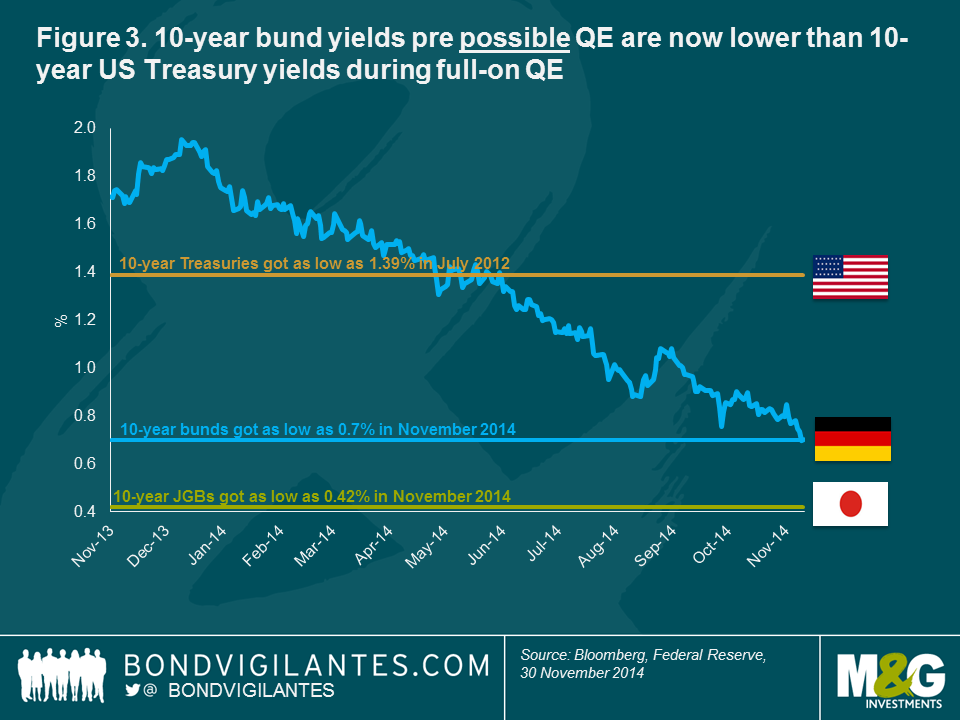
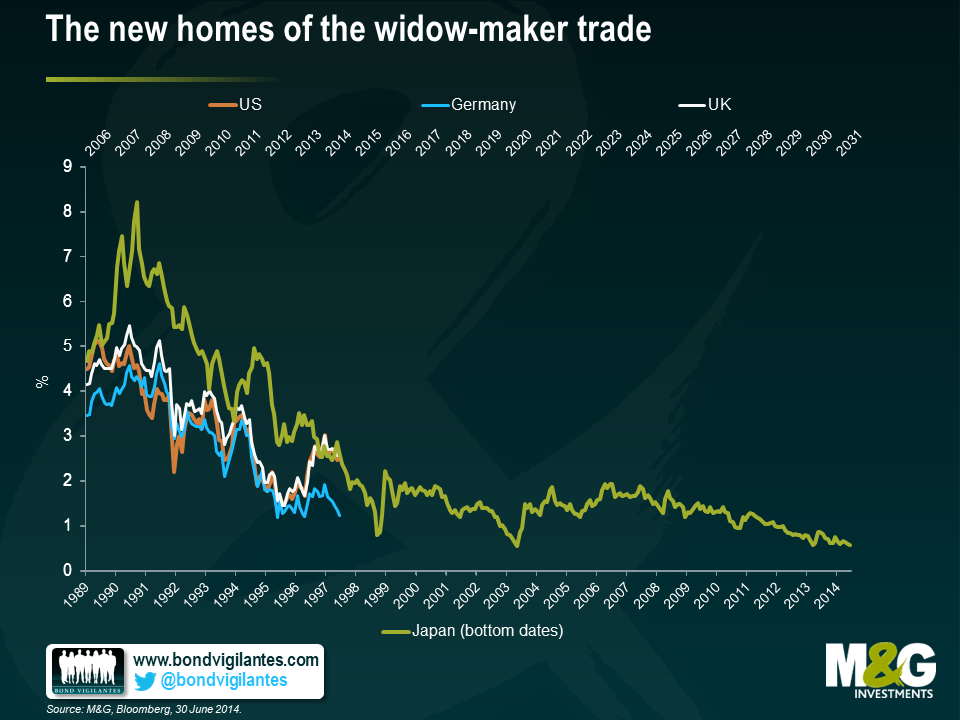
It’s clear though that bond markets have already discounted a significant QE programme from the ECB. The 10-year bund yield at 0.7% is already well below the sub-1.5% that US 10-year Treasury yields got to in 2012 at the peak of the Fed’s QE spree, and is not far from the 0.4% that Japan got to three decades into its economic crisis and after QE, zero rates and prolonged deflation (see figure 3).
But given how low core eurozone bond yields have fallen without full-blown QE, what real impact could this have? Deflation has come to Europe despite ever cheaper borrowing costs for the public and private sector. Its biggest impact just might be through the currency.
The Rise and Rise of Cocos
The biggest growth area for Europe’s bond market in 2014 has been hybrid securities – instruments with cryptic names such as CoCos (contingent capital notes) and AT1s (additional Tier 1 notes). Their rise reflects a wider drive to raise new capital following major regulatory changes designed to reduce the risk of governments needing to bail out banks in times of financial stress, as was the case in the financial crisis. The regulations include new capital requirements imposed under Basel III.
CoCos and their kind are finding popularity with banks and regulators alike due to the way that they combine features of equity and debt and can be deeply subordinated within capital structures. As this suggests, they are complex financial instruments that require significant analysis in order to invest. This has been recognised in the UK by the Financial Conduct Authority (FCA), which moved to restrict their sale to the mass retail market in October.
We believe that when purchased at an attractive price, CoCos can, on a selective basis, be a welcome source of additional risks and returns within a diversified bond portfolio. In our view, it is important to have a large and dedicated team of financial credit analysts that can conduct fundamental analysis, meet company management and understand the possible risks involved in investing in such instruments. Investing in CoCos bears specific risks that go beyond the risks of corporate bonds and include: trigger-level risk, coupon cancellation risk, capital structure inversion risk, call extension risk, and valuation risks. In addition, CoCos are an emerging asset class and it is still difficult to predict how they will perform in a stressed environment.
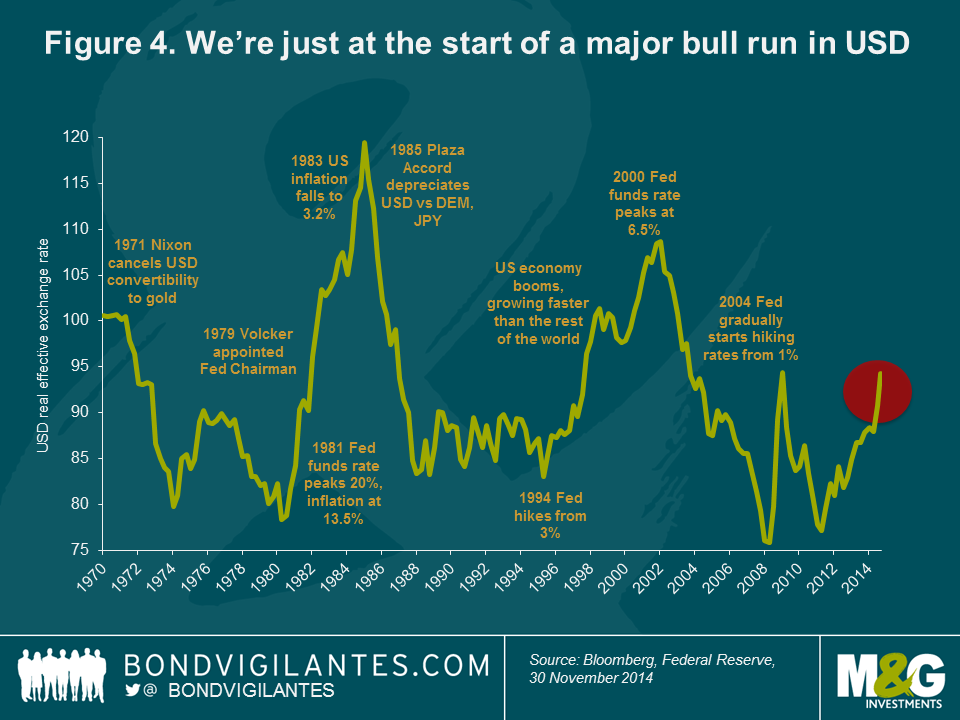
Financial markets tend to regard QE as a debasement of the currency – just look at the yen since Japanese Prime Minister Shinzo Abe announced the sharpest of his three arrows, the huge expansion of the Bank of Japan’s balance sheet, or conversely at the strength of the US dollar as the currency markets anticipated the end of Fed bond buying. It’s likely that both yen and euro weakness will continue into 2015 and beyond. Whilst the US dollar has seen a significant bounce from its weakness in the middle of 2014, its current strength looks minor compared with historical bull markets.
Bull market for the US dollar ahead
The US dollar is not only supported by the relative shrinking of the Fed’s balance sheet compared with those of the Bank of Japan and the ECB, but more fundamentally by its stronger growth potential over the coming years, the likelihood that the US will be the first of the large economies to hike rates, and also by an improvement in its current account. Whilst the US remains a deficit economy, importing more than it exports, the dramatic turnaround in its energy position means that within the next decade or so it could become self-sufficient in energy – and its current account deficit all but disappears (see figure 4).
We continue to like the US dollar, but not its government bond market. One way to take advantage of expected dollar strength, Fed rate hikes and improving US corporate and banking health is to buy floating rate notes (FRNs). Unlike traditional bonds, these instruments don’t have fixed coupons and instead pay a rate of interest linked to money market rates. So as the Fed raises rates, probably in the middle to second half of 2015, the coupon on the FRN rises too.
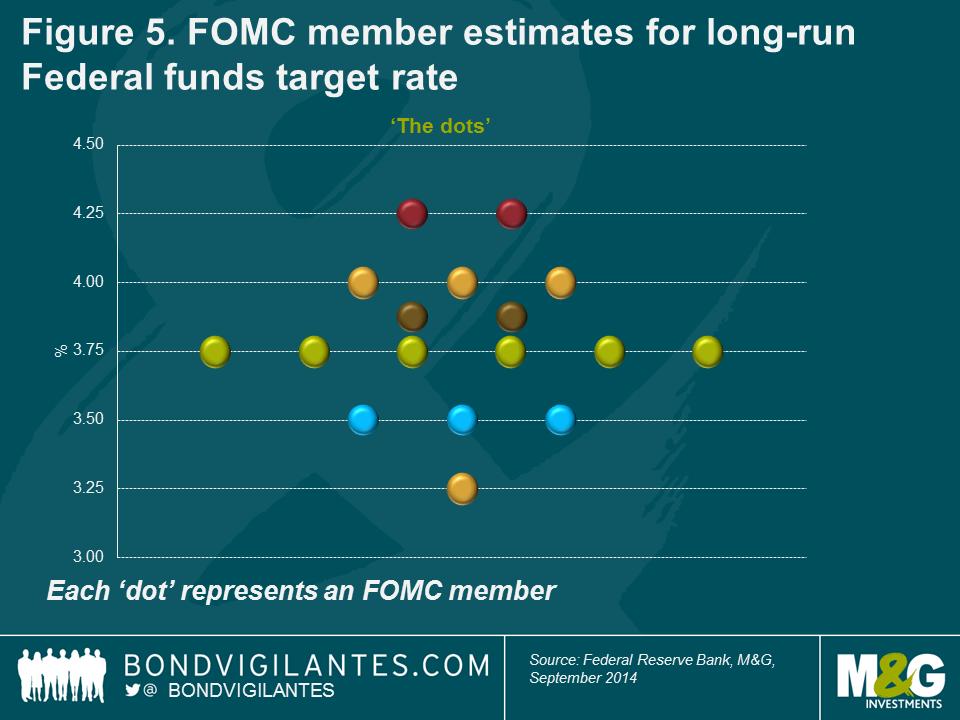
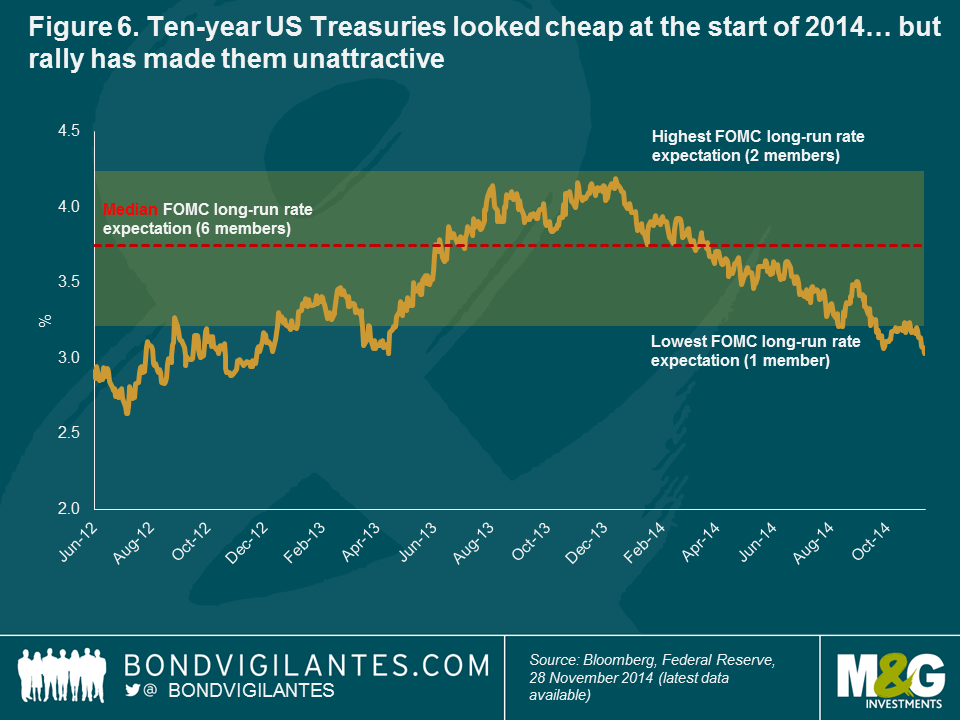
Federal Open Market Committee member estimates regarding the long-run Federal Reserve funds rate as shown in its so-called ‘dots’ chart are helpful when drilling down into how tightening might unfold (see figure 5). In effect, this provides a guide not only to the direction that bond yields should go, ie, upwards, but also by how much. Based on the dots, and given that forward-looking US Treasury yields were around the top dots 12 months ago, we found that the start of 2014 was a good time to add duration. Fast forward to year-end, and taking into account the significant year-to-date yield rally, and the reverse applies, with short duration now looking the right stance (see figure 6).
Might there come a time to go negative duration and could 2015 be that time? Possibly, although we should remember that negative duration implies a negative carry, meaning you have to be right simply to break even. In other words, yields have to rise for returns to stand still. However, a proper bear market for fixed income assets seems unlikely before inflation starts to rise back up towards target. With wage rises still very low, despite certain signs of tightening in parts of the US labour market, the timing of such a sustained inflation pick-up remains uncertain.
Developed world challenges
While the outlook for the UK economy remains relatively solid, there has been a significant downgrading of expectations over the past few months and the UK has fallen back from the position it held for much of the year as front-runner for interest rate hikes. As David Cameron pointed out in early November, “red warning lights are once again flashing on the dashboard of the global economy” in the shape of the eurozone teetering on the verge of another recession, slowing emerging market growth, little progress with global trade talks and geopolitical risks.
UK Referendum Fever
Prime Minister David Cameron’s pledge back in 2013 to give UK voters an in–out referendum on European Union membership has been gaining prominence this year, particularly after Scotland’s own close-run vote against independence from the UK in September.
Cameron has adopted an increasingly critical stance on the EU in recent months, as he tries to counter the rising popularity of the United Kingdom Independence Party (UKIP), whose campaign is centred around leaving the bloc. Should the Conservatives be returned to power following parliamentary elections in May 2015, an EU referendum would take place by 2017.
The relative narrowness of the Scottish vote (in the end, around 55% voted in favour of remaining part of the UK, although opinion polls in the weeks running up to the election were far closer) caused sterling to weaken and the stocks of a number of Scotland-headquartered firms to sell off.
While short-lived – and over very quickly following the announcement of a victory for the ‘no’ camp – the volatility gave markets some insight into what could happen in the run-up to an EU referendum. Should the UK vote in favour of ‘Brexit’, as it has become known, then all bets could be off. Although most voters currently claim to be in favour of continued EU membership, the Scottish referendum provides an example of how voting intentions can remain fluid right up to the day of the vote.
The UK’s significant reliance on the eurozone, in particular, is already making itself felt in slowing manufacturing and export data. Added to which, with parliamentary elections due in 2015, and the possibility of ‘Brexit’ (British exit from the European Union, see box entitled UK referendum fever) becoming more widely discussed, 2015 looks likely to be beset with uncertainty.
We have said it before, but the UK’s ongoing very large current account deficit remains a key concern. We continue to view the currency as being fundamentally overvalued on this basis, and such large deficits – as well as being unsustainable from an economic perspective – have historically also preceded a sterling crash.
Elsewhere in the developed world, we remain short the yen, as sentiment is likely to remain adverse against Japan’s persistent economic growth problems and need for ongoing stimulus. However, a combination of weak oil prices, and the recent announcement that the next scheduled consumption tax hike has been put on hold could yet combine to turn Japan into the surprise growth story of 2015.
Emerging markets: support remains
Emerging bond markets have generally performed well over the past 12 months, despite investors’ focus on the winding down of QE in the US and the bouts of volatility caused by geopolitical concerns. Against these factors, sentiment towards the asset class has benefited from persistent very low interest rates and benign inflation conditions in developed economies, which have supported demand for higher yielding assets such as emerging market bonds.
The fast growth of the emerging corporate bond market in recent years is widening the opportunity set in the asset class. The hard currency corporate bond sub-asset class has doubled in size since 2010, and is now worth over US$1.3 trillion – on a par with the US high yield market. With the inclusion of local-currency bonds, the Bank of International Settlements estimates that the total emerging market corporate bond market was worth nearly US$4 trillion at the end of 2013.
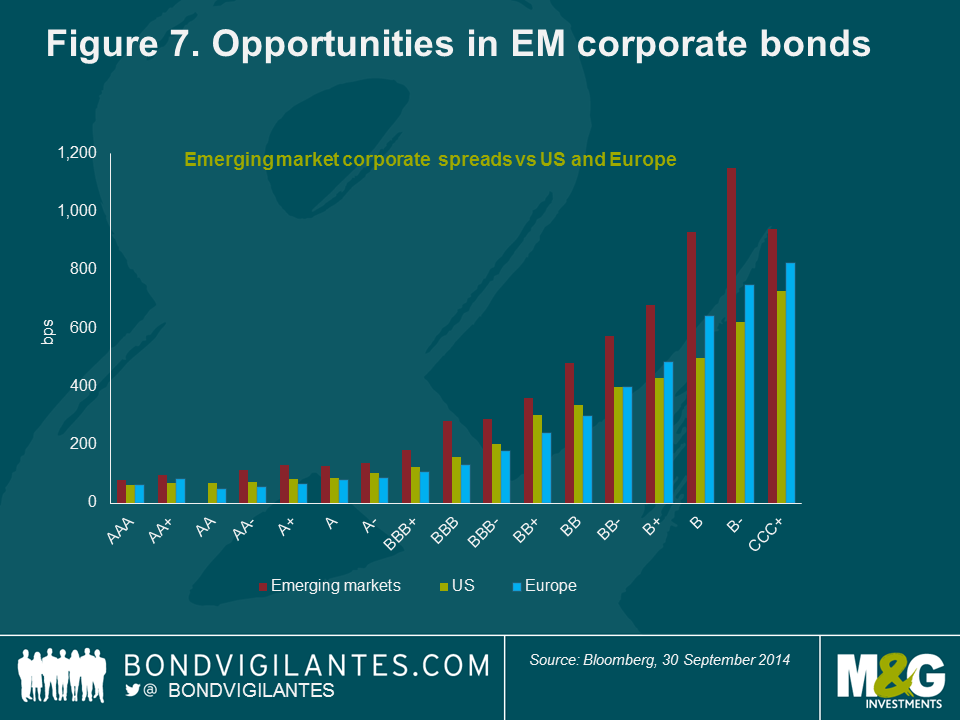
From a current valuation perspective, emerging market corporate bonds can be attractive relative to their developed market counterparts after steadily decent performance from the latter. However, investing on a selective basis with careful and thorough credit research remains key. Figure 7 shows that for a similar bond rating class, emerging market corporate credit is offering higher spreads than in the US and Europe, suggesting that investors are being compensated for the credit risk as well as receiving a premium for investing in emerging market assets.
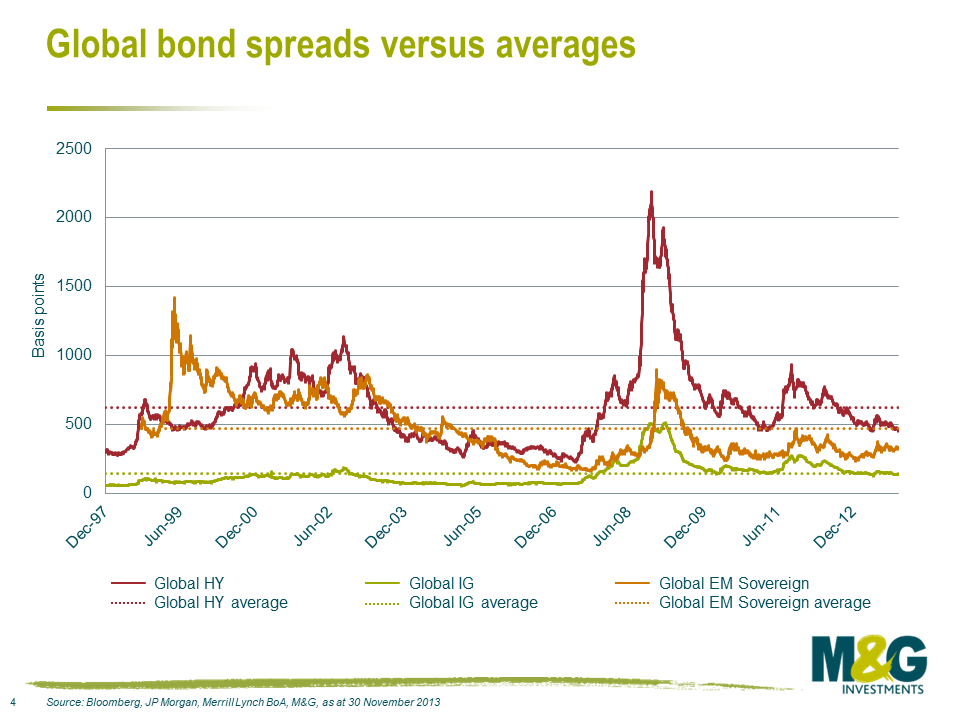
Credit: closer attention to quality now needed
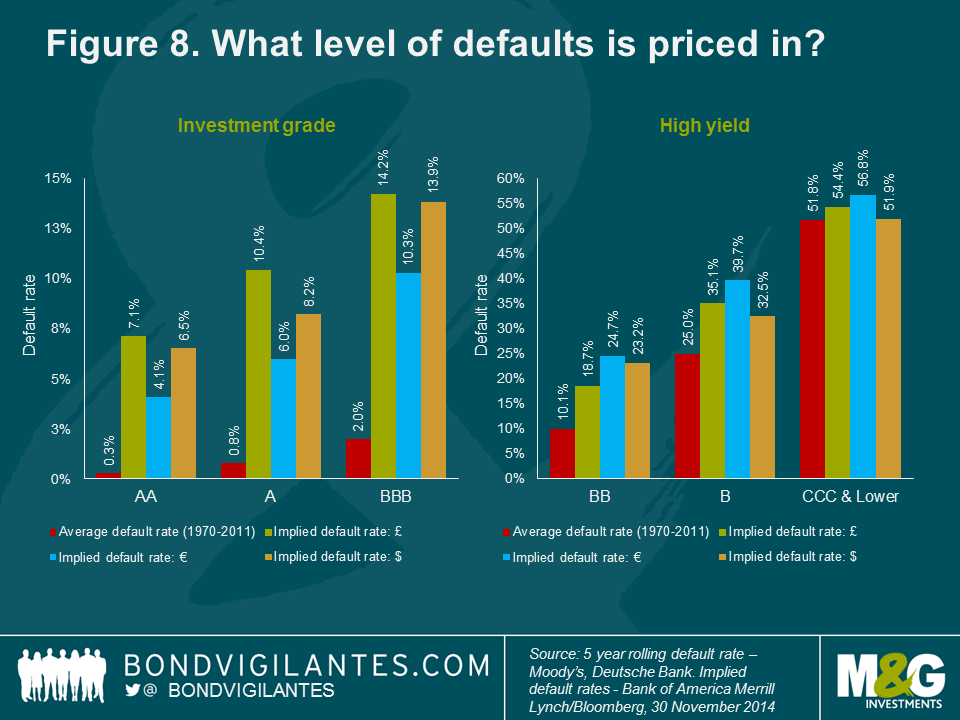
The easy money has clearly already been made in corporate and high yield bond markets. Since the height of the credit crisis, spreads on investment grade have tumbled from a peak of 511 basis points (bps) in 2008 to around 123 bps today, and in high yield, from 2,193 bps to 488 bps over the same period. The good news is that in every rating bucket except for CCC, investors are still being overcompensated for default risk – in other words, credit spreads imply a higher level of defaults than we would expect to see (see figure 8). The bad news is that most of that excess spread is likely to be a premium for illiquidity (see box entitled The price of liquidity), which is not necessarily a problem for long-term investors, but could be a potential source of volatility in the shorter term.
While there are signs of some bad behaviour returning to credit markets, this is on a much smaller scale than in the years before the credit crisis in 2008. Nevertheless, animal spirits do appear to be returning – especially in the US – as evidenced by rising levels of corporate debt, increased merger and acquisition activity and an upsurge in the issuance of lower rated CCC bonds and ‘payment-in-kind’ debt (PIK notes). Dividend payments and share buybacks are also increasing, although healthy corporate profit margins appear to be having only a limited impact on capital expenditure so far, which is a shame for global growth.
While the global default rate is still extremely low, a few warning signs probably suggest that it is time to start paying closer attention to deteriorating credit quality. Overall, companies still have lots of (arguably too much) cash on their balance sheets, but there are a few signs that profit margin growth has reached an end.
A number of high yield businesses have run into problems this year, and while each has been the result of specific issues which were unique to those companies, it does perhaps highlight a general trend of complacency amongst high yield investors. On the other hand, an increase in distressed debt can be a source of opportunities; where we believe the underlying business is robust and the bondholder’s legal position strong, we many occasionally invest in distressed debt instruments.
As the experience of the past few years has aptly demonstrated, making bold predictions for bond markets for the coming year requires no small measure of bravery. Nevertheless, with substantial volumes of QE still on the horizon in a number of globally significant economies such as Japan and the eurozone, the prospect of deflation rather than inflation keeping central bankers awake at night, and the timing of interest rate hikes being pushed out in nearly all economies, it does not need a huge leap of faith to say that conditions for bond investors currently look relatively benign. Equally, as the start to 2014 showed, all it takes is a few stormy months – literally or figuratively – for all best estimates to fall by the wayside.
The Price of Liquidity
Bond trading used to be an integral part of the business model of large banks. That changed after the 2008 financial crisis, when a storm of regulation forced banks to de-lever their balance sheets and retreat from secondary market-making activities. The past few years have seen banks relatively less willing to hold corporate bonds on their own balance sheets until a buyer or seller can be found.
Investors are justifiably worried about what will happen if everyone decides to sell corporate bonds en masse. In an extreme scenario, a complete absence of secondary market activity would impair fixed income managers’ ability to sell their corporate bond holdings, regardless of whether the securities were held in mutual funds, exchange-traded funds or institutional mandates.
The liquidity premium on offer in credit markets is one of the reasons investors can expect a higher return relative to investing in deep and liquid government bond markets. When liquidity was excellent in 2006–07 and credit spreads were very tight, an investor in corporate bond markets was not being paid for liquidity risk and subsequently suffered greatly when corporate bond spreads widened to all-time highs in 2008. The deterioration in liquidity contributed to the large sell-off in corporate bond markets at that time.
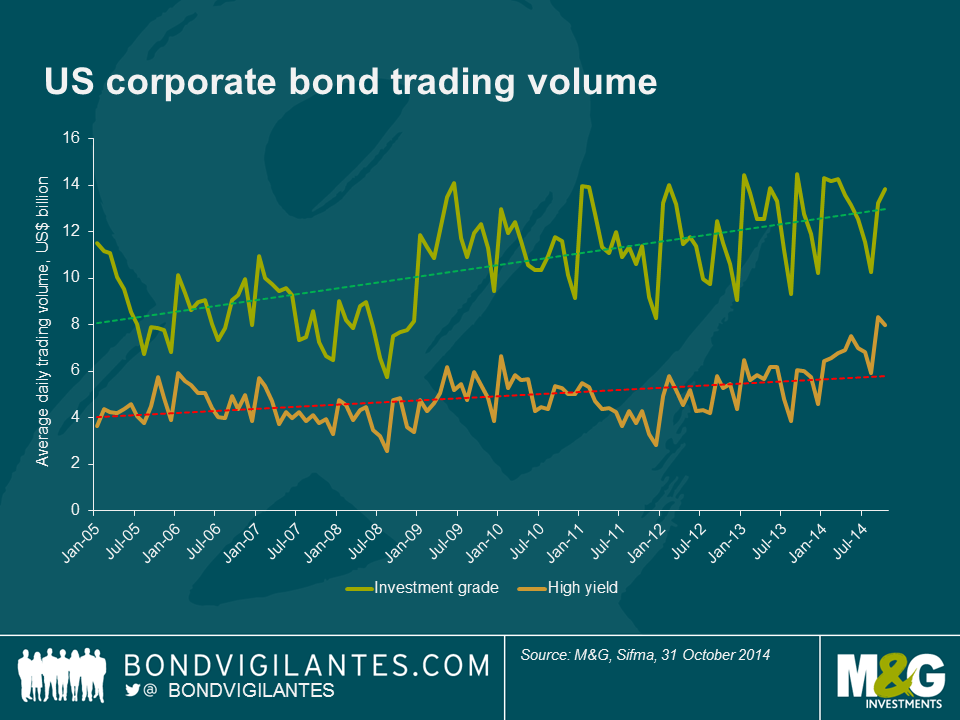
The underlying dynamics of the marketplace make for interesting reading. Secondary-market corporate bond turnover in the US has actually now increased to above pre-crisis levels. As shown in the chart below, average daily transaction volumes have risen from less than US$15 billion in 2007 to US$22 billion in October 2014.
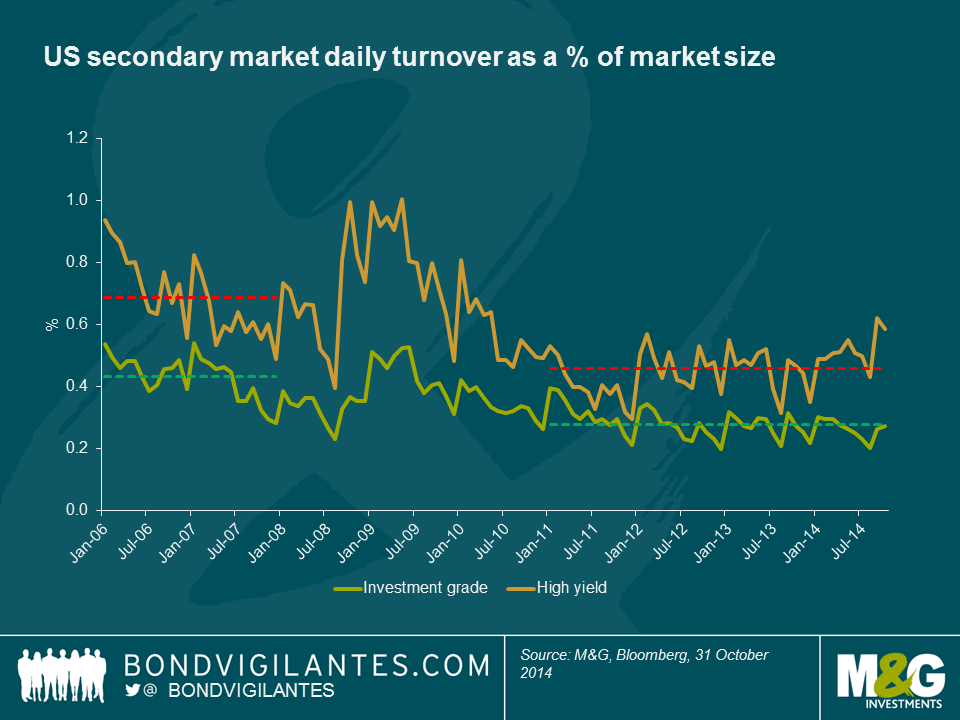
However, global corporate bond markets have grown significantly over the past seven years. Thus, when looking at corporate bond trading as a percentage of the total market, rather than in absolute terms, the steady decline in the share of outstanding corporate bonds that trade on the secondary market becomes evident. Secondary daily market turnover in US investment grade has averaged 0.28% from 2011 to today, a decline from 0.43% in the period between 2006 and 2007. Interestingly, during the financial crisis period – a time most perceive as a very poor liquidity environment – daily market turnover spiked to 0.5% of the US investment grade and 1.0% of the US high yield market as investors sought to exit positions. Whilst liquidity has fallen relative to pre-crisis levels, there is no evidence of a recent, more precipitous, drop in secondary market liquidity.
That said, there have been days in 2014 where a lack of liquidity has been blamed for abnormal market moves. On 15 October, the yield on the benchmark 10-year US government bond plunged 33 basis points to 1.86% before traders stepped in. Yields then rose back to 2.13%. This ‘flash crash’ may have been the result of some large market participants capitulating on short duration calls, alternatively computer-driven trading has been suggested as another reason for the price action in government bonds as yields fell below the key support level of 2.0%. At the end of the day, almost US$1 trillion worth of Treasuries had been bought and sold, showing that liquidity was available. The question, as in all distressed markets, was whether investors were buying and selling at reasonable prices.
Harvesting the liquidity premium is one of the ways for bond fund managers to generate higher returns for investors. Of course, the risks of owning lots of illiquid paper are higher in a poor liquidity environment where it may be difficult to meet client redemptions. To mitigate this risk, managers can undertake measures that include (but aren’t limited to) investing in government bonds; holding short duration, high quality corporate bonds; holding a cash or cash-like buffer; and emphasising diversification.
Liquidity conditions today appear increasingly linked to the direction of spreads (decent in times of narrowing spreads, and correspondingly poorer as spreads widen). We think a lack of liquidity in and of itself is not necessarily something to be feared. That said, we actively monitor liquidity risk across our bond funds, and it is a key reason why we integrate liquidity management into our investment process.
With many of the conditions for the economy to normalise now met, the point at which interest rates also begin to normalise is getting closer.
Bank of England Governor Mark Carney, Liverpool, 9 September 2014
… with the economy getting closer to our objectives, the FOMC’s emphasis is naturally shifting to …. the question of under what conditions we should begin dialling back our extraordinary accommodation.
Federal Reserve Chair Janet Yellen, Jackson Hole, 22 August 2014
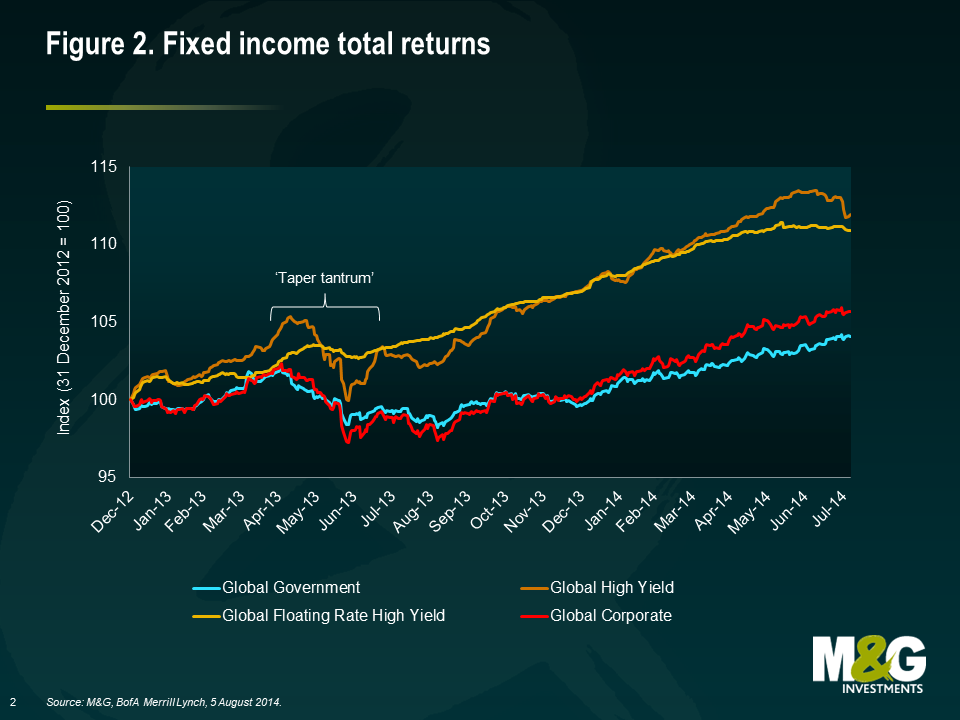
We are entering a new era for interest rates in the developed world. The extended period of ever looser monetary policy is starting to draw to a close. In the wake of the tapering of quantitative easing (QE) from the Federal Reserve (Fed), investors now expect to see the first interest rate hikes in many years, initially in the UK and shortly afterwards in the US (see figure 1). The principal focus of the debate is over the questions of “when?” and “how fast?” interest rates should rise, not “if?” For bond investors in particular, this transition has thrown up a lot of difficult questions. Having benefited greatly from falling yields and tightening credit spreads, the move to a more hawkish cycle will create many more headwinds and challenges when it comes to delivering returns for many fixed income asset classes.
Consequently, any product or instrument that can help investors navigate this environment has rightly been receiving a lot of interest and attention. In the latest in our series of the Panoramic Outlook, we will focus on one such instrument, the high yield floating rate bond. In recent years, this instrument has gained popularity with many issuers and the market has grown to a total US$44 billion.
A high yield floating rate note (FRN) has two key defining features: (1) a floating rate coupon that is automatically adjusted in line with changes in interest rates; (2) a relatively high credit spread that reflects the additional credit risk of a non-investment grade issuer.
It is the combination of these two features which not only enables investors to receive an attractive income stream now, but also allows them to benefit from higher coupons should interest rates increase with no associated loss to capital. This last element, the lack of a hit to capital in a rising interest rate environment, is the key difference to the traditional universe of fixed coupon bonds which suffer from price declines as yields move up.
In this issue, we will take an in-depth look at the characteristics and make-up of the high yield floating rate bond market. We will also consider the key drivers of returns, as well as some of the risks and how these can be managed.
High yield floating rate bonds 101
The key features of high yield floating rate bonds can be summarised as follows:
It is a bond issued by a company that has a below-investment grade credit rating
The coupon, usually paid quarterly, is made up of:
a variable component which is adjusted in line with a money market reference rate, typically every three months (throughout this article we will refer to this measure as ‘3-month Libor’)
a credit spread, which is fixed for the life of the bond and reflects the additional credit risk of lending to a company
The bond has a fixed maturity (typically 5-7 years at the time of issue)
The bond is a publicly traded instrument that can be bought and sold like any other corporate or high yield bond
As an example, suppose that a 5-year bond is issued with a coupon of 3-month Libor + 450 basis points (bps). For the first year, 3-month Libor is 50bps, so the coupon is 500bps (or 5%) over that period. In the second year, 3-month Libor rises to 75bps, so the coupon increases to 75+450 = 525bps, or 5.25%, during that period.
Market characteristics
Table 1: High yield floating rate market compared with other fixed coupon bond markets
Index
Global High Yield Floating Rate
Global Government Bond
Global Corporate
Global High Yield
Average maturity (years)
4.5
8.9
8.7
6.1
Effective duration (years)
0.03
7.2
6.2
4.2
Spread duration (years)
2.1
6.9
6.1
4.1
Face value (US$ billion)
44
23,081
7,964
2,057
Yield to maturity (%)
4.5
1.3
2.7
6.1
Spread (vs government bonds, bps)
400
14
110
435
Composite rating
B1
AA1
A3
B1
Source: M&G, BofA Merrill Lynch, 5 August 2014.
Table 1 highlights some of the characteristics of the high yield floating rate market and compares it with the more traditional government, corporate and high yield fixed coupon bond markets using data from Bank of America Merrill Lynch’s fixed income indices.
In terms of credit risk (measured by the composite rating) and credit spread (the yield premium above government bonds that compensates investors for the higher risk of default), the high yield floating rate market is very similar to the traditional high yield market. This is to be expected as there is a great deal of commonality between the two in terms of underlying issuers.
The big difference is revealed when we start to look at the effective duration numbers. Effective duration measures the sensitivity of bond prices to changes in yields. A duration of 4.2 years means that for every 1% increase in yields, there will be an approximately 4.2% loss of capital. The effective duration of the High Yield Floating Rate Index is very close to zero (due to the regular re-setting of coupons, cashflows are only fixed for a very short time). This means that if, all other things being equal, there is a broader sell-off in the government bond markets and all fixed income yields need to adjust upwards, the capital loss would be close to zero.
This limited exposure to moves in the broader yields means that the high yield floating rate market tends to be much less sensitive to any wider interest rate inspired volatility in the market. Indeed, during the so-called ‘taper tantrum’ of 2013 when former Fed Chairman Ben Bernanke first introduced the idea that QE would begin to be phased out, the high yield floating rate market was much more resilient in terms of price impact than the other major bond markets as investors adjusted to the concept of tighter monetary policy (see figure 2).
We can also see how this might play out at an individual bond level. In July 2014 Iceland Ltd, a UK supermarket, issued both a £350 million FRN, paying Libor + 425bps maturing in 2020, and a £400 million 6.25% bond maturing in 2021. Both bonds are pari passu senior secured liabilities that are issued by the same company. In other words, the credit risk in both instruments is effectively identical. However, the interest rate risk exposure is very different. Take the following hypothetical scenario:
Both bonds start the year priced at 100% of par
For the first six months of the year, 3-month Libor is at 0.56%
Halfway through the year, the Bank of England unexpectedly increases the bank rate by 50bps, which pushes 3-month Libor to 1.06% and re-prices gilt yields up by the same amount across the curve
Credit spreads remain the same throughout the year
While this is an unlikely scenario, it does help to simplify the maths. The interest rate duration of the 6.25% 2021 bond is close to 5.5 years, so a 50bps move in underlying yields means a capital hit of around 2.7%. This is offset by 6.25% of income from the coupon, so the total return over the course of a year is 3.6%.
Iceland bond
Fixed 6.25% 2021
FRN 2020 (L+425)
Change to price (%)
-2.68
0.00
Coupon return (%)
6.25
5.06
Total return (%)
3.57
5.06
In contrast, the FRN has minimal interest rate duration, so does not suffer a capital loss. Indeed, as Libor goes up by 50bps for the second half of the year, the coupon rises from an annualised 4.81% to 5.31% (or 5.06% on average). So crucially, the FRN does not suffer from the broader interest rate volatility, and at the same time, actually benefits from a higher coupon as the increase in the bank rate feeds through to a higher Libor, thereby boosting total returns.
From this example, we can see the clear advantages of floating rate instruments over fixed rate equivalents in a rising interest rate environment.
It is important to note, however, that as non-investment grade instruments, there is still exposure to wider moves in credit spreads within the high yield floating rate market. From table 1, we can see that spread duration for the high yield floating rate market is 2.1 years. Accordingly, if spreads were to widen on average by 100bps to 500bps, there would be an associated capital loss of around 2.1%, and vice versa if spreads were to tighten.
However, the spread duration is around half that of the more traditional high yield universe at 4.1 years. This means that in times of risk aversion and widening credit spreads, the impact on prices for the high yield floating rate market should be comparatively lower. During the recent weakness in late July and August 2014, we can see this expected relationship did indeed play out (see figure 3).
On the other hand, if spreads were to tighten from current levels, we would expect the high yield floating rate market to see an associated capital gain smaller than the more traditional high yield universe, given lower spread duration and, on average, a smaller degree of call protection (a provision designed to protect bondholders by preventing the early redemption of a bond).
A globally diversified market
In terms of the underlying issuers, the global high yield floating rate market is well diversified across different regions and industries (see figure 4).
At present, there is a bias towards the sterling and euro markets, driven in part by the trend for European issuers to refinance bank debt in the bond market.
By issuing FRNs, companies can retain a similar debt structure to bank loans, but access deeper and more diversified sources of debt capital. US banks are, on average, less capital constrained than the European banking system so the need to tap sources of new capital has been less pressing. Nevertheless, there has been a steady stream of issuance from both European and US issuers over recent months as we can see from table 2.
The other major trend we can see is a preponderance of industrial rather than financial issuance. We expect this to continue in the short term, increasing the proportion of industrial issuers in the market over time.
Table 2: Selection of new issues in 2014
Issue date
Issuer
Sector
Issue spread (bps)
Maturity
Amount issued (million)
Country
Feb-14
Innovia Group
Capital goods
500
Mar-20
€342
UK
Mar-14
Premier Foods
Consumer non-cyclical
500
Mar-20
£175
UK
Mar-14
Kerneos Tech Group
Basic industry
475
Mar-21
€150
France
Apr-14
Eden Spring
Consumer non-cyclical
550
Apr-19
€210
Israel
Apr-14
Monier
Basic industry
500
Oct-20
€315
France
Apr-14
Stonegate
Consumer cyclical
475
Apr-19
£140
UK
Apr-14
Quick
Consumer cyclical
475
Apr-19
€440
France
Apr-14
Quick
Consumer cyclical
750
Oct-19
€155
France
Apr-14
Chesapeake Energy
Energy
325
Apr-19
US$1,500
USA
May-14
Galapagos
Capital goods
475
Jun-21
€325
Germany
May-14
AES Corp
Utility
300
Jun-19
US$775
USA
May-14
Avis Budget Group
Services
275
Dec-17
US$250
USA
May-14
Novacap
Basic industry
500
May-19
€310
France
Jun-14
Xefin
Basic industry
375
Jun-19
€325
Germany
Jun-14
Montichem
Basic industry
475
Jun-21
€175
Germany
Jun-14
HEMA
Consumer cyclical
525
Jun-19
€250
Netherlands
Jun-14
Dry Mix Solutions
Basic industry
425
Jun-21
€550
France
Source: M&G, Bloomberg, 2014.
Drivers of returns and key risks
For investors in the high yield floating rate bond market, the key factors that will influence returns will be:
Credit spreads – Income, in the form of a credit spread over Libor, is likely to form a major component of total returns, particularly in a low interest rate environment. As the issuers in this market are rated below-investment grade, the corresponding credit spread that investors receive is higher than in other fixed income markets to compensate them for this risk (currently around 400bps). As mentioned previously, returns will also be governed by changes in credit spreads. At a time of tightening spreads, returns will be boosted by capital gains; at times of widening spreads, investors will see capital losses.
Interest rates – The path of short-term interest rates will also have an impact. If short-term interest rates fall, total returns will also fall as the coupon is automatically reduced, and vice versa should short-term rates rise.
Default rates – If high yield default rates increase, investor returns would be hit as individual bonds can suffer from writedowns of capital during a bankruptcy process.
High yield floating rate notes vs. leveraged loans
Given the characteristics outlined in this article, it is no surprise that high yield FRNs share many of the same investment characteristics as leveraged loans (floating rate coupons, senior position in the capital structure, non-investment grade issuers).
However, there are some small but important differences between the two asset classes. Most important of all for non-institutional European investors is the fact that high yield FRNs are eligible for inclusion in authorised open-ended funds (aka ‘UCITS eligible’), whereas leveraged loans are currently considered eligible only for institutional investors. To date, this has meant that non-institutional investors could only access this market through closed-ended vehicles such as investment trusts.
However, with the emergence of the high yield floating rate market, non-institutional investors across Europe will be able to access this market using a traditional open-ended fund.
High yield FRNS
Leveraged loans
Coupon
LIBOR + fixed margin
LIBOR + fixed margin
Credit rating
Non-investment grade
Non-investment grade
Security
Typically first lien / senior secured
Typically first lien / senior secured
Liquidity
Daily trading T+3 settlement
Less liquid, uncertain settlement
Public/Private
Public information only
Public and private information
UCITS eligible
Yes – can be included in open-ended funds sold to non-institutional investors
No – limited to institutional investors only. Non-institutional investors can only gain exposure through closed-ended funds
Mitigating default risk
Examples of high yield FRNs
Company: Vue Cinemas Amount issue: €290 million Coupon: 3-month Euribor +525bps Maturity: July 2020 Credit rating: B2/B Region: UK and Northern Europe
Vue is a leading cinema operator in the UK and northern Europe. A consumer-focused business generating a resilient cashflow, we believe Vue is well placed to benefit from the bounce back in UK consumer confidence and retail spending.
Company: Chesapeake Energy Amount issued: US$1,500 million Coupon: 3-month USD Libor +325bps Maturity: April 2019 Credit rating: Ba1/BB+ Region: US
The largest shale gas exploration and production company in the US, with an approximately US$18 billion market capitalisation, Chesapeake benefits from a strong asset base across the major onshore gas fields and an improving balance sheet.
Company: Wind Telecomunicazioni Amount issued: €575 million Coupon: 3-month Euribor +400bps Maturity: July 2020 Credit rating: Ba3/BB Region: Italy
Italian mobile telecom business Wind is one of the largest issuers of high yield bonds in Europe. Its senior secured bonds are well supported by a strong underlying cashflow.
We view default risk as the key risk to be managed through the cycle, as this is the one driver that can lead to a permanent loss of capital. How can this risk be managed? We think there are three key mitigants:
Diversification – Ensuring that any investment in this market is diversified across geographies and industries helps protect investors against major idiosyncratic shocks that could precipitate defaults in any one industry or region.
Credit analysis – As non-investment grade companies, the business, financial and legal risks associated with each bond issued can be very complex. Consequently, having the expertise and capability to assess these risks on a case-by-case basis is crucial.
Investing in senior secured instruments – Instruments that are senior secured or first lien have prior claim over an issuer’s assets in the event of a bankruptcy. This means recovery rates are much higher on average than unsecured liabilities (see table 3). High yield FRNs are often senior secured instruments or sit alongside loans in the capital structure. Using the data below from the US as a proxy, we would expect recovery rates for this market to be in the 60-80% range over the long term.
Table 3: Average North American non-financial corporate debt recovery rates measured by ultimate recoveries, 1987-2013
Lien position
Emergence year
Default year
2013
2012
1987-2013
2013
2012
1987-2013
Loans
73.3%
91.7%
80.3%
81.3%
77.2%
80.3%
Senior secured bonds
67.5%
63.6%
63.5%
n/a
71.2%
63.5%
Senior unsecured bonds*
4.5%
36.0%
48.1%
n/a
39.3%
48.1%
Subordinated bonds**
0.0%
9.2%
28.2%
n/a
13.5%
28.2%
* 2013’s senior unsecured bond recovery rate is based on five observations
** Includes senior subordinated, subordinated, and junior subordinated bonds. 2013’s subordinated recovery rate is based on observation
Source: Moody’s, August 2014.
A new tool
As we hope to have illustrated in this article, high yield floating rate bonds offer a unique combination of characteristics for fixed income investors, namely exposure to credit spreads alongside materially lower interest rate risk. Consequently, we believe the development of this market will give bond investors a new tool that not only mitigates the potential headwinds of higher interest rates, but also gives them something that actually benefits from the next phase of the monetary policy cycle.
The yield-dampeners – will interest rates inevitably rise when QE ends?
Speak to the majority of investment strategists and economists in the world today and most will tell you that now is not the time to buy fixed income assets, particularly government bonds. Most will point to the low level of interest rates, suggesting that bond yields can only go one way and that is up. After the ‘taper tantrum’ of 2013, many predict that the catalyst for a sell-off in fixed income assets could be the end of quantitative easing (QE) by the US Federal Reserve (Fed). At the current pace of tapering, the Fed’s QE experiment is due to cease in October this year.
In this latest issue of our Panoramic Outlook series, I present an alternative view to the consensus thinking that interest rates must inevitably rise. To do this, I investigate a number of dynamics in fixed income markets that have surprised investors during this period of extraordinary monetary policy. There are a number of possible reasons to suggest that the market may not see a material increase in bond yields when the Fed finishes QE. Firstly, given the fragility of the global economic recovery and high level of debt in the US economy, it is unlikely that interest rates will return to pre-crisis levels, limiting the potential downside to fixed income assets. Secondly, there are some powerful structural deflationary forces which are helping to keep inflation low. Finally, a strong technical factor – the global savings glut – is likely to remain supportive to fixed income assets as is firm demand from large institutional pension funds and central banks.
The current state of play
Over the course of 2014, Fed Chair Janet Yellen and the Federal Open Market Committee (FOMC) have continued to slow the pace of its large-scale asset-purchase programme. The four rounds of QE have undeniably had an impact on bond yields, with the Bank of International Settlements estimating1 that the five-year forward 10-year rate is around 90-115 basis points lower than it would otherwise be. Today, the Fed owns around $2.4 trillion of US government debt, as shown in figure 1.
The question that markets are grappling with right now is what will happen when this huge source of demand for US Treasuries, namely the US Federal Reserve, steps away from the market?
Looking at the past behaviour of 10-year US Treasury yields does not provide great insight into the future path of yields. For example, as shown in figure 2, the 10-year Treasury yield fell by around 175 basis points during QE1 before rising back up to pre-QE levels. At one point during QE2, yields increased by around 125 basis points before falling back to the 3% level. During QE3, the 10-year yield fell by around 20 basis points. In 2013, markets threw a ‘taper tantrum’ following the then-Fed Chairman Ben Bernanke’s testimony to Congress and yields increased by over 100 basis points. This year, as the Fed has gradually reduced asset purchases, yields have actually fallen by around 50 basis points. It is too simplistic to suggest that the behaviour of bond prices is simply a function of whether the Fed is doing QE or not. There must be other forces at work in the bond market.
It is a valuable exercise to attempt to identify the other forces at play in the US government bond market. Could government bond yields possibly stay lower for longer, continuing to surprise the consensus?
As the world’s largest and deepest government bond market, US Treasuries represent the risk-free rate of return. That is, the interest an investor would expect from an absolutely risk-free investment over a period of time. The risk-free rate acts as an anchor for other fixed income assets such as investment grade and high yield corporate bonds. At this point in the economic and credit cycle, there appears to be what I call three key yield-dampening forces (or ‘yield-dampeners’) at work that investors should be aware of.
Yield-dampener 1: the Fed funds rate will remain at a low level for a long time to come
Nominal US interest rate cycles have exhibited progressively lower peaks and troughs over the past 30 years (see figure 3). There are a number of reasons for this. Firstly, declining inflation was an important contributor to the fall in interest rates. Secondly, the move to make central banks independent of their respective governments was a significant step in achieving credibility. Thirdly, the adoption of an inflation-targeting or price stability approach to monetary policy was also important in anchoring inflation expectations for both consumers and the market.
The most important insight we can gain about the Fed funds rate is whether it is helping to stimulate or restrict economic growth. Broadly speaking, monetary policy can be seen as expansionary if the policy rate is below the natural rate of interest (the rate consistent with output being at its potential), with the gap between the rates measuring the extent of the policy stimulus.
The problem for economists is that the natural rate of interest is unobservable, but it can be tracked with a model2 that identifies the interest rate that would prevail when output is at its potential. Using a model developed by economists at the US Federal Reserve, a current estimate of the natural rate of interest is just -0.4% (see figure 4). The estimate has largely trended lower since the 1960s. Apart from a couple of brief periods over the past 15 years, the real interest rate has been below the natural rate of interest, indicating an expansionary setting of monetary policy. This has encouraged the build-up of debt and risk-taking behaviour.
Nominal US rate cycles have moderated over time as leverage has grown within the US economy. This will likely continue for the current cycle, suggesting a much lower peak in interest rates than experienced during previous tightening cycles. The high levels of leverage mean that it will require fewer and more gradual rate hikes to dampen economic activity. As a result, the Fed will not have to step on the brakes as hard as it used to in order to slow down the economy and guard against inflation. The world is addicted to low interest rates, meaning that rate cycles over the next decade could consist of fewer rate hikes.
Think of an elite marathon runner in his prime. He would inevitably have a low level of body fat compared with the average person. In retirement, given the lower levels of physical activity and less focus on diet, our marathon runner puts on weight (a lot of weight). With the lack of training and increase in body size, the runner inevitably slows down and cannot compete at the same level that he used to.
This analogy is useful in describing the US debt binge at all levels of the economy – households, corporates, banks and government. Total debt to GDP stands at around 350% as shown in figure 5. For more than a generation, governments, consumers and companies were able to borrow with impunity, knowing that persistent inflation would inflate away their debts. Today, not only are these economic agents trying to fight their way out of this debt morass, deflation could increase the real value of what they owe. Economists call this paradox ‘debt deflation’. The US economy cannot work off the excess leverage that has built up over a period of 30 years unless interest rates remain low.
Despite some moderation in recent years, the deleveraging that has occurred in the US economy is not enough. These high levels of debt are sustainable only because interest rates are at levels not seen since the 1950s. To use our runner analogy, we would not expect our retired and overweight marathon runner to compete at the level he once used to. US companies, households, banks and even the government cannot cope in a world of much higher interest rates without the economy plunging back into recession. Interest rates and yields may rise from current levels, but they are unlikely to return to pre-crisis levels.
Economists and markets are still getting used to having Janet Yellen as Fed Chair. Having worked in the Fed system and the White House for a combined 16 years, reviewing her long academic career and research papers can provide an interesting insight into her thoughts on the conduct of monetary policy.
Yellen has written a number of papers with her husband George Akerlof, an American economist and winner of the Nobel Prize in Economics in 2001. Yellen’s most-cited paper, “The Fair Wage – Effort Hypothesis and Unemployment”3, builds a model in which the amount of effort that a worker puts into their job depends on the difference between the wages they are getting paid against their perception of what is a ‘fair wage’. The hypothesis is that the bigger the difference, the less hard the worker works.
Another paper written with Akerlof, and perhaps the most relevant paper for monetary policy, was written in 2004. In “Stabilization Policy: A Reconsideration”4 the authors conducted a review of the existing literature, disagreeing with Milton Friedman’s view that countercyclical policy cannot affect the average level of unemployment and output. Again, Yellen has focused on the labour market, coming to the conclusion that being unemployed in a recession is worse than being unemployed when times are good. The authors conclude that “there is a solid case for stabilization policy and that there are especially strong reasons for central banks to accord it priority in the current era of low inflation”. This is a marked difference from the Alan Greenspan-led Federal Reserve, which was hesitant to raise interest rates in the face of a boom, but quick to reduce rates when the economy entered into recession.
The next paper, “Waiting for Work”5, was written in 1990, again authored with Akerlof and economist Andrew Rose, focuses on a phenomenon known as ‘lock-in’. The authors find that “workers who are laid off in a downturn rationally wait to accept jobs until business conditions improve. Workers voluntarily remain unemployed in recessions if they gain through waiting for permanently higher wages which are available in the new jobs which appear during expansions”. Yellen, Akerlof and Rose proved that workers hired in booms “lock-in” higher wages whereas workers hired in busts suffer lower wages. This partly explains why Yellen expects the participation rate to pick up in the future as workers increasingly believe the US economic recovery will last.
In Janet Yellen, the US Federal Reserve has appointed a very strong academic economist who has focused on the key economic resource of labour for a large part of her academic career. Much like Ben Bernanke who was a pre-eminent expert of the US Depression before joining the Fed and saw the economy through the dark days of the credit crisis, it appears that Janet Yellen might be in the right place at the right time to lead the FOMC. In terms of the Fed’s dual mandate of price stability and full employment – provided inflation behaves – Yellen will likely prefer to keep monetary policy accommodative. This was highlighted in Yellen’s most recent Congress Testimony, where she stated “My own expectation is that, as the labour market begins to tighten, we will see wage growth pick up, some to the point where nominal wages are rising more rapidly than inflation, so households are getting a real increase in their take home pay. If we were to fail to see that, frankly, I would worry about downside risk to consumer spending.”
Arguably there are now three key economic indicators to watch. Inflation, unemployment and wage growth. Without wage growth, it is unlikely that Chair Yellen would be calling for a rate hike any time soon. The FOMC has a new monetary policy rule book.
3Akerlof, George A and Yellen, Janet L, The Fair Wage-Effort Hypothesis and Unemployment. The Quarterly Journal of Economics, May 1990. https://www.jstor.org/stable/2937787
5Akerlof, George A, Rose, Andrew K and Yellen, Janet L, Waiting for Work. NBER Working Paper Series, June 1990. http://www.nber.org/papers/w3385.pdf
Yield dampener 2: weak economic data and structural deflationary forces
Arguably, the greatest force causing rising bond prices has been a falling inflation premium that investors place on owning government debt. The performance of long-dated government bonds this year suggests that buyers believe inflation will remain at current levels (or lower) for a long time to come. This is to be expected given that the economic data has largely underwhelmed economists’ forecasts since February, as shown in figure 6. The Fed has continually stated that the pace of monetary policy tightening is data dependent. Many have blamed poor weather for the run of weak data but it seems that the Fed is justified in its dovish stance for now.
When determining the inflation outlook, it is important to acknowledge that there may be structural deflationary forces at play in the global economy. These include debt deleveraging, globalisation and technological advances that result in large productivity gains. Given these structural forces, there is a strong case for examining the Japanese fixed income experience as it may provide some insight into the future behaviour of G7 bond yields.. See The ‘Japanification’ of Government Bond Markets for further insight.
The ‘Japanification’ of government bond markets
Back in the late 1980s, Japan was a shining example for the rest of the world in the eyes of many economists. Most saw a clear edge in Japan’s competitiveness relative to the US across a broad range of high-tech and manufacturing mass-produced tradable goods. Japan had recovered from the devastation of World War II and its economy was producing year after year of solid growth.
At the time it was argued that the Japanese work ethic was far superior to that of the West. This would likely lead to substantial benefits in labour productivity. In addition, Japan’s high savings rate and slow population growth would give the economy an edge in an increasingly globalised world. Of course, Japan’s proximity to China and the Far East would give it access to a vast pool of workers to which it could outsource lowly skilled and low-paid jobs. This would allow the Japanese economy to specialise and benefit from its large pool of highly educated workers.
Unfortunately for the Japanese economy, the reality turned out differently from the confident forecasts. Today, the economy is around 40% smaller than observers predicted back in the late 1980s, having grown at a very slow pace over the last two decades. Japanese individuals and companies have spent much of the past 30 years working off the debt that they accumulated during the 80s. Banks saddled with bad debts refused to lend, preferring instead to buy Japanese government bonds.
Recognising the economic malaise, the government offered new stimulus plans through higher public spending, although with little impact on the real economy. This resulted in government debt-to-GDP ratio increasing from around 70% in the late 80s to over 200% today. The central bank eventually chipped in as well, reducing interest rates to zero and implementing QE in 2001.
So what are the lessons that fixed income investors can learn from the Japanese experience?
For investors, one trade that has always lost money, over any reasonable time period, has been the shorting of Japanese government bonds (JGBs). This trade, unique in its consistency, developed its own name: “the widow maker”. Over the past 24 years, JGB yields have fallen relentlessly from a peak of around 8% in 1990 to around 0.62% today. Despite the great monetary experiment of “Abenomics”, the widow maker is alive and kicking.
History might not repeat itself but it does rhyme. As shown in the accompanying chart, US, German and UK government bonds yields are following an eerily similar path to JGBs in the early 90s. The question has to be asked: is shorting developed market government bonds the new widow-maker trade?
Yield dampener 3: the global savings glut
Another reason that investors are surprised by the fall in yields this year despite the reduction of Fed purchases is because of the strong ‘technical’ support for the asset class. This is often difficult to identify in advance and is much harder to measure than economic variables such as unemployment or inflation. Some of the strong technical support for US Treasuries is illustrated in figures 7 and 8.
Low yields on government debt during the last rate hiking cycle bamboozled the then-Fed Chairman Alan Greenspan. It was his successor, Ben Bernanke, who presented a plausible explanation in 2005. By his reckoning, falling government bond yields and the inverse yield curve was being caused by a ‘global savings glut’.
Bernanke proposed that a decade-long development of global savings was the result of a combination of strong technical factors. Firstly, the strong saving motive of ageing developed nations such as Germany and Japan was an important factor. Secondly, Bernanke proposed that the developing world was changing from being a net user to a net supplier of funds in international capital markets. The proceeds of war chests of foreign reserves that the emerging economies had built up in response to earlier crises were being used to buy US Treasuries and other assets.
Figure 7 represents the major foreign holders of US Treasuries: China, Japan and Belgium. That’s correct; Belgium – a small country with a population of 11 million – is the third-largest holder of US government bonds. However, it is highly unlikely that Belgium is buying all those bonds, and some have speculated that the increase in holdings over the past eight months reflects the secret buying trends of other countries using Brussels as a financial centre. It could be China, it could be central banks, it could be the fact that Euroclear (the custodial service provider) is based in Brussels. Or it could be none of the above. What we do know, is that demand for US Treasuries has accelerated in 2014. The global savings glut has not disappeared.
Another strong tailwind for fixed income markets is blowing due to the fact that both equities and fixed income assets have had such a great run over the past couple of years. Both public and private pension plans are now better funded and are increasingly looking to lock in their gains before volatility begins to pick up again.
The managers of defined benefit schemes would like to lead a cautious life. It is vitally important that they make enough money to honour the promises they have made to their employees. For this reason, their allocation to safer assets – like fixed income – has historically been quite high.
Many schemes were over-funded around the start of the millennium, meaning defined benefit managers could sleep well at night. This changed after the financial crisis in 2008, when the returns of the equity allocation of many funds nose-dived into negative territory. The memories of that episode have remained fresh, with many managers vowing to de-risk their portfolios if they ever got back to fully-funded status.
Fortunately for the employees of the biggest companies in the US, many pension schemes are now clawing their way back to being 100% funded (see figure 8). The Milliman 100 Pension Funding Index – which represents the funded status of the 100 largest corporate defined benefit funds in the US (around $1.5 trillion of assets) – showed that the funded ratio rose to 87.3% at the end of 2013 from 77.3% a year earlier, representing a deficit of $193 billion. The increase in the funded ratio during 2013 was the largest percentage gain ever experienced in the 14-year history of the Milliman survey.
We would expect that as pension plans get ever closer to being fully funded, pension managers will continue to ‘reverse rotate’ out of equities and into fixed income and focus on liability-driven investing strategies to ensure future payments are met.
Will government bond yields move higher from current levels or will the “yield-dampeners” limit the damage?
It appears that the question of where yields move from current levels is more complex than first meets the eye. This reflects the uncertain and experimental nature of unconventional monetary policy such as QE programmes. Given this uncertainty, it is a useful exercise to question the market consensus that yields must rise.
It is very much possible that those looking for yields to rise back to pre-crisis levels when QE ends may be disappointed. Be wary of the yield-dampening forces at play in the US treasury market. In addition, the ‘yield-dampeners’ could easily be applied to the UK or European government bond markets, potentially providing a useful lesson for the future path of yields. This will impact the attractiveness of other fixed income assets such as investment grade and high yield corporate bonds. Arguably, ultra-low cash rates and a stable interest rate environment for government bonds would provide a solid base for corporate bond markets as investors continue to seek positive real returns on their investments.
Over the past year, investors’ perception towards emerging market bonds changed from viewing the glass as being half full to half empty. The pricing-in of US ‘tapering’ and higher US Treasury yields largely drove this shift in sentiment due to concerns over sudden stops of capital flows and currency volatility. For sure, emerging market economies will need to adjust to lower capital flows, with this adjustment taking place on various fronts over several years. In this issue of our Panoramic Outlook series, we examine the main channels of transmission, policy responses and asset price movements, as well as highlight the risks and opportunities we see in the asset class. Our focus in this analysis is on hard currency and local currency sovereign debt.
Some emerging market countries are more advanced than others in the rebalancing process, while others may not need it at all. Also relevantly, the amount of rebalancing required should be assessed on a case-by-case basis, as the economic and political costs must be weighed against the potential benefits.
Generally, the necessary actions include reducing external vulnerabilities such as large current account deficits (especially those financed by volatile capital flows), addressing hefty fiscal deficits and banking sector fragilities, or balancing the real economy between investment and credit and consumption. It is worth noting that not all countries have vulnerabilities. And those that do not are the ones that should be bought in sell-offs like the ones we saw in June and August 2013, as well as early 2014 (see chart 1).
EM hard currency debt – higher Treasury yields
Emerging market (EM) hard currency debt is issued by sovereign (or quasi-sovereign) entities in currencies other than their local currency, usually in the US dollar. The largest issuers in this market are currently Mexico, Russia, Indonesia, Venezuela and Turkey. Returns for hard currency debt are driven essentially by credit spreads and US Treasury movements. In turn, they tend to correlate positively with Treasuries.
We expect US Treasury yields to gradually move higher towards neutrality of around 4% over the next few years, which should weigh slightly on EM hard currency debt returns. But with the tapering of asset purchases already priced in and given low inflationary pressures, the Fed can remain dovish on its guidance in the near term. As such, Treasury performance in 2014 should improve compared with negative returns in 2013, which was one of the headwinds that weighed on EM investment grade last year.
EM local currency debt – weaker currencies
EM local currency debt is issued by governments in their local currencies. The largest issuers in this market are currently Brazil, Mexico, Poland, South Africa, Malaysia and Russia. Returns for local currency government debt tend to be driven by global yield, country-specific factors such as inflation and monetary policy expectations, risk premia and currency movements. A basic overview of the different emerging market indices is shown in chart 2.
Since markets began to anticipate Fed tapering in the middle of last year, most emerging currencies have depreciated in nominal and real terms in either an orderly process with minimal reserve loss (including free floaters such as South Africa, Mexico or Colombia) or in an abrupt process (including the dirty pegs or managed currencies in countries such as Argentina, Kazakhstan and Ukraine). A simple gauge of determining whether a currency is fundamentally undervalued or overvalued is the real effective exchange rate. This measure seeks to assess the value of a currency against a basket of currencies based on nominal exchange rates and the changes of relative prices. The fundamental notion is that large deviations signal over or undervaluation, ceteris paribus (ie no fundamental changes such as terms of trade, productivity levels or other structural changes in an economy) (see chart 4).
It is worth highlighting that currency depreciation does not necessarily equate to a currency crisis. A depreciation may not be negative for a credit if there are little or no currency mismatches on the balance sheet of the public and corporate sector, if the country enjoys credibility regarding its inflation targeting regime and remains vigilant of inflation expectations, and if the fiscal impact is not large. It can even be positive if the country has sectors that can benefit from increased competitiveness or if the impact on its fiscal accounts is positive, for instance in the case of oil exporters. The recent 18% devaluation of the Kazak tenge is an example. Despite the devaluation, Kazakhstan spreads did not widen. We are comfortable investing in hard currency debt of such countries where depreciation does not represent a currency crisis. The currency impact for investors can be significant so it is important to get the asset allocation and security selection calls right. For example, in South Africa the local benchmark fell 5.4% between 15 September and 31 December 2013, while the hard currency benchmark rose 2.3% (in US dollar terms). The South African central bank did not intervene through the period and the country’s net international reserves remained stable. This differs materially from 10 years earlier, when the country’s net reserves were negative due to its short US dollar exposure through forward sales. Fair value is difficult to determine with precision. There are various approaches for doing so. The IMF, for example, provides three approaches, which often lead to conflicting results.
Purchasing power parity (PPP) metrics, on the other hand, are simple to construct, but fail to take into consideration several elements that affect valuations, such as structural changes in an economy, terms of trade and productivity changes. However, they can usually highlight large deviations. Some countries have already started seeing a rebalancing and reduction of their current account deficits (eg India, Indonesia), which has in turn helped to support their currencies and local bond markets. Other currencies appear theoretically cheap (South African rand, Turkish lira), but this has not yet been reflected in the narrowing of their current account deficits. In terms of positioning, we favour currencies with low imbalances such as the Mexican peso and Philippine peso, or high carry currencies that have already started rebalancing like the Indonesian rupiah and Indian rupee.
Higher interest rates
Various EM central banks, including in Brazil, Indonesia and South Africa, have had to tighten monetary policy pre-emptively in order to anchor inflation expectations or reactively respond to currency pressures, particularly in countries like Turkey where large current account deficits require higher interest rates to attract financing. On average, nominal interest rates stand at 7% and real rates around 3%. We believe that, like US Treasury yields, medium- to long-term real yields on local currency debt still need to rise, but part of the adjustment has already been achieved (see chart 5). Weaker currencies and higher interest rates will tend to reduce growth, particularly in countries that do not stand to benefit from improved competitiveness or gains on non-commodity exports. The IMF has maintained its growth projections for emerging economies unchanged in its January report (5.1% for 2014 and 5.4% for 2015), but we expect downward revisions at its upcoming April report as some key economies (Russia, China) are facing additional headwinds. A combination of higher interest rates and lower growth will require a (potentially pro-cyclical) fiscal adjustment in a few countries that need to stabilise their debt dynamics.
Capital flows
The World Bank has recently warned of a potential material decline in capital flows to emerging markets in a scenario where developed market long-term rates increase by 2%. However, based on recent trends (flows have already been declining), its baseline modelled scenario expects flows to decline slightly from current levels. This is also corroborated by forecasts from the Institute of International Finance (IIF), which sees flows declining in 2014 but then rebounding in 2015 (see chart to the left). In terms of the bond market, most countries have been able to borrow in the international capital markets since the fear of tapering began and EM dedicated funds started seeing steady outflows. In fact, the pace of issuance is back to past years’ trends, having recovered from the slowdown during mid-2013. Should the event of a sudden-stop emerge, however one factor that can help smooth out capital flows is the presence of official lenders such as the IMF. While there are few countries that for ideological or political reasons would be unlikely to agree to a funded programme, there are some that would be inclined to do so as a last resort. Countries with strong policy framework have access to facilities such as the Flexible Credit Line (FCL) or Precautionary and Liquidity Line (PLL), enabling them to borrow at short notice if needed. Currently, the IMF has $415 billion in forward commitment capacity (FCC), its main measurement of lending capacity, which is the equivalent of 75% of the non-FDI portfolio flows that was estimated to have gone into emerging markets in 2013. Countries that require an adjustment but offer no response or sub-optimal responses will underperform and will be particularly vulnerable in a sudden-stop scenario. Sub-optimal responses include insufficient fiscal or monetary tightening (if required), restrictions on capital outflows, multiple exchange rate regimes, price controls, foreign exchange reserve depletion and/or maintenance of overvalued exchange rates. Countries that we have concerns about on this front include Venezuela, Ghana, Mongolia and Nigeria, as well as a few additional countries in the Caribbean and Sub-Saharan Africa.
Fiscal adjustments
One of the toughest parts of rebalancing will be fiscal adjustments for countries that are running large budget deficits or where an additional tightening is needed to anchor inflation or debt dynamics. Brazil, Argentina, Venezuela, Serbia, Ukraine and Ghana are cases in point. This is likely to be one of the last phases of the adjustment, as it entails political costs and governments often do it on a reactive mode. Examples would include being under pressure from the markets (wider spreads and reduced access to capital markets), rating agencies (as the credit is downgraded) and/or from performance criteria or prior actions as required by an IMF programme, if the country is subject to one. The pressure normally builds up in this order. The fact that governments lack room to make large fiscal adjustments ahead of elections, and with so many elections due this year, means this adjustment will be postponed.
Wider spreads
We believe the credit quality in EM bonds has peaked as some of the factors that helped improve creditworthiness – namely reserve accumulation, easy global and domestic monetary conditions – have deteriorated in recent months. For example, headwinds to EM include a declining rate of trend growth in critical countries such as China and a deterioration in the terms of trade that many EM countries currently enjoy. However, the widening of sovereign hard currency spreads on an absolute basis is already pricing in a one notch downgrade on average.
For these reasons, we expect downgrades in Brazil, the Bahamas, Bermuda, Bahrain and Mongolia and upgrades in the Philippines, Colombia, Paraguay and Angola. On a relative basis, EM bonds have underperformed high yield, investment grade and peripheral European sovereigns, so the market is already pricing in some credit deterioration (see chart 6).
Rebalancing China
China is the most critical rebalancing act due to the sheer size of its economy and impact on global markets. We believe that a structural reduction in trend growth is inevitable, the main question being whether it will occur in an orderly or disorderly manner.
Political risk
In addition to economic risks, political and policy risks in emerging markets will shape asset prices in many countries. There are elections in 15 key countries (see chart 8), including countries such as India, Indonesia, Turkey, South Africa, Brazil and Ukraine. Popular discontent and political confrontation in Venezuela and Thailand are also being watched closely. Political risk is a very subjective element. While there are dozens of indices that rank countries based on their institutions, corruption, security, rule of law, etc, assessing how much that is worth in terms of spreads or currency valuations is never an easy task. Expectation of political or policy change often increases demand for safe assets and capital flight, both from locals and foreigners. That usually starts with currency weakening, but can also spill over into spreads in countries where the currency is more heavily managed or when it is accompanied by reserve loss. Countries with stronger institutions and low probability of policy change, such as Chile, see little to no volatility, while for others, like Ukraine, future prospects of economic policy and future alliances will be materially changed. We see upside risks (too much political risk priced in) in Indonesia, balanced risks in India, Brazil and South Africa, and downside risks in Ukraine.
While we believe the authorities are aware of the challenges, they are facing various delicate policy choices:
allowing investment growth to decline gradually, but without producing a hasty crash in its economy or in sectors such as the property market
steering the financial sector into greater foreign exchange and interest rate flexibility
reducing the pace of credit creation
allowing market forces to determine credit risk and reducing moral hazard
addressing corruption and fending off vested interests in state-owned enterprises
increasing transparency in financing operations of shadow-finance entities and local governments
reducing income inequality and managing social pressures as the economy slows
Some of these challenges are starting to be addressed (some currency and interest rate flexibility, increasing exceptions to the one child policy as demographics worsen), but clearly much more remains to be accomplished. Supportive factors include China’s large net international asset position, as well as its high domestic savings. We believe the markets are too fixated on the pace of growth in China. Instead, we would rather see lower, but higher quality, sustainable growth, than a particular headline number (see chart 7).
We remain vigilant of the potential negative spill-over from China on emerging markets and are managing these risks by carefully selecting our direct China exposure, as well as screening non-Chinese exposure to credits or currencies that can be negatively affected by a decline in commodity prices (particularly industrial metals). The latter includes weaker credits with large current account and/or fiscal deficits which will be under pressure given a material decline in terms of trade (for example, Mongolia, Zambia and the Chilean peso).
Opportunities
The continued adjustment of emerging market sovereigns towards an environment of higher rates and lower capital flows presents investment opportunities in the asset class. Valuations have improved in all three areas (currencies, local rates and spreads) on an absolute and relative basis. However, asset allocation between sovereigns (hard currency and local currency) and corporates and careful country and security selection remains key. Our preference is for sovereigns that are resilient to lower capital flows, have manageable debt burdens, stable foreign exchange reserves and/or resilient banking sectors. Among more vulnerable countries, we may favour those that have started taking policy steps in the right direction. We also prefer quasi-sovereigns/corporates that benefit from currency weakening, such as exporters, or that are exposed to countries we deem to be resilient. We have selectively taken profits on certain long US dollar positions in high carry countries where rebalancing is already under way.
Over the past year, investors’ perception towards emerging market bonds changed from viewing the glass as being half full to half empty. The pricing-in of US ‘tapering’ and higher US Treasury yields largely drove this shift in sentiment due to concerns over sudden stops of capital flows and currency volatility. For sure, emerging market economies will need to adjust to lower capital flows, with this adjustment taking place on various fronts over several years. In this issue of our Panoramic Outlook series, we examine the main channels of transmission, policy responses and asset price movements, as well as highlight the risks and opportunities we see in the asset class. Our focus in this analysis is on hard currency and local currency sovereign debt.
Some emerging market countries are more advanced than others in the rebalancing process, while others may not need it at all. Also relevantly, the amount of rebalancing required should be assessed on a case-by-case basis, as the economic and political costs must be weighed against the potential benefits.
Generally, the necessary actions include reducing external vulnerabilities such as large current account deficits (especially those financed by volatile capital flows), addressing hefty fiscal deficits and banking sector fragilities, or balancing the real economy between investment and credit and consumption. It is worth noting that not all countries have vulnerabilities. And those that do not are the ones that should be bought in sell-offs like the ones we saw in June and August 2013, as well as early 2014 (see chart 1).
EM hard currency debt – higher Treasury yields
Emerging market (EM) hard currency debt is issued by sovereign (or quasi-sovereign) entities in currencies other than their local currency, usually in the US dollar. The largest issuers in this market are currently Mexico, Russia, Indonesia, Venezuela and Turkey. Returns for hard currency debt are driven essentially by credit spreads and US Treasury movements. In turn, they tend to correlate positively with Treasuries.
We expect US Treasury yields to gradually move higher towards neutrality of around 4% over the next few years, which should weigh slightly on EM hard currency debt returns. But with the tapering of asset purchases already priced in and given low inflationary pressures, the Fed can remain dovish on its guidance in the near term. As such, Treasury performance in 2014 should improve compared with negative returns in 2013, which was one of the headwinds that weighed on EM investment grade last year.
EM local currency debt is issued by governments in their local currencies. The largest issuers in this market are currently Brazil, Mexico, Poland, South Africa, Malaysia and Russia. Returns for local currency government debt tend to be driven by global yield, country-specific factors such as inflation and monetary policy expectations, risk premia and currency movements. A basic overview of the different emerging market indices is shown in chart 2.
While the transmission channels tend to be always the same, the degree of positive or negative impact of a depreciating currency differs depending on a variety of factors. These are essentially the openness of the economy (through trade, services and the capital account), as well as the currency regime. Unlike prior crises, as in pre-2001 when most of the EM investable markets had fixed or intermediate regimes such as currency pegs, nowadays, 58% of the hard currency benchmark and 78% of the local currency benchmark comprise countries that have floating currency regimes as classified by the International Monetary Fund (IMF). A floating currency arrangement acts as an economic buffer in an environment of less abundant capital. It minimises drawdowns on foreign exchange reserves and it can help adjust the current account if an adjustment is needed due to changes in terms of trade or if a country needs to regain competitiveness. This is important as adequate levels of reserve coverage are a necessary condition for the servicing of hard currency debt. There is vast literature analysing past crisis episodes under fixed, intermediate and floating currency regimes; however, the findings generally suggest flexible regimes are the least vulnerable as the currency acts as a shock absorber. A recent study1 that looked at the relationship between exchange rate regimes and crises came to the conclusions summarised in chart 3. The study uses two different currency regime classifications: the IMF and the Ilbetzk, Reinhart and Rogoff (IRR) classifications.
Under the IMF classification, the study showed that pegged currency regime countries go through banking, currency or debt crises the most often, while when using the IRR classification, intermediate currencies are the most at risk. Under both classifications, countries with floating exchange rate currencies have historically suffered the fewest crisis episodes.
Since markets began to anticipate Fed tapering in the middle of last year, most emerging currencies have depreciated in nominal and real terms in either an orderly process with minimal reserve loss (including free floaters such as South Africa, Mexico or Colombia) or in an abrupt process (including the dirty pegs or managed currencies in countries such as Argentina, Kazakhstan and Ukraine). A simple gauge of determining whether a currency is fundamentally undervalued or overvalued is the real effective exchange rate. This measure seeks to assess the value of a currency against a basket of currencies based on nominal exchange rates and the changes of relative prices. The fundamental notion is that large deviations signal over or undervaluation, ceteris paribus (ie no fundamental changes such as terms of trade, productivity levels or other structural changes in an economy) (see chart 4).
It is worth highlighting that currency depreciation does not necessarily equate to a currency crisis. A depreciation may not be negative for a credit if there are little or no currency mismatches on the balance sheet of the public and corporate sector, if the country enjoys credibility regarding its inflation targeting regime and remains vigilant of inflation expectations, and if the fiscal impact is not large. It can even be positive if the country has sectors that can benefit from increased competitiveness or if the impact on its fiscal accounts is positive, for instance in the case of oil exporters. The recent 18% devaluation of the Kazak tenge is an example. Despite the devaluation, Kazakhstan spreads did not widen. We are comfortable investing in hard currency debt of such countries where depreciation does not represent a currency crisis. The currency impact for investors can be significant so it is important to get the asset allocation and security selection calls right. For example, in South Africa the local benchmark fell 5.4% between 15 September and 31 December 2013, while the hard currency benchmark rose 2.3% (in US dollar terms). The South African central bank did not intervene through the period and the country’s net international reserves remained stable. This differs materially from 10 years earlier, when the country’s net reserves were negative due to its short US dollar exposure through forward sales. Fair value is difficult to determine with precision. There are various approaches for doing so. The IMF, for example, provides three approaches, which often lead to conflicting results. (The relevant methodology can be seen here).
Purchasing power parity (PPP) metrics, on the other hand, are simple to construct, but fail to take into consideration several elements that affect valuations, such as structural changes in an economy, terms of trade and productivity changes. However, they can usually highlight large deviations. Some countries have already started seeing a rebalancing and reduction of their current account deficits (eg India, Indonesia), which has in turn helped to support their currencies and local bond markets. Other currencies appear theoretically cheap (South African rand, Turkish lira), but this has not yet been reflected in the narrowing of their current account deficits. In terms of positioning, we favour currencies with low imbalances such as the Mexican peso and Philippine peso, or high carry currencies that have already started rebalancing like the Indonesian rupiah and Indian rupee.
1Crises and exchange rate regimes: Time to break down the bipolar view? Combes, Minea, Sow, October 2012
Various EM central banks, including in Brazil, Indonesia and South Africa, have had to tighten monetary policy pre-emptively in order to anchor inflation expectations or reactively respond to currency pressures, particularly in countries like Turkey where large current account deficits require higher interest rates to attract financing. On average, nominal interest rates stand at 7% and real rates around 3%. We believe that, like US Treasury yields, medium- to long-term real yields on local currency debt still need to rise, but part of the adjustment has already been achieved (see chart 5). Weaker currencies and higher interest rates will tend to reduce growth, particularly in countries that do not stand to benefit from improved competitiveness or gains on non-commodity exports. The IMF has maintained its growth projections for emerging economies unchanged in its January report (5.1% for 2014 and 5.4% for 2015), but we expect downward revisions at its upcoming April report as some key economies (Russia, China) are facing additional headwinds. A combination of higher interest rates and lower growth will require a (potentially pro-cyclical) fiscal adjustment in a few countries that need to stabilise their debt dynamics.
Capital flows
The World Bank has recently warned of a potential material decline in capital flows to emerging markets in a scenario where developed market long-term rates increase by 2%. However, based on recent trends (flows have already been declining), its baseline modelled scenario expects flows to decline slightly from current levels. This is also corroborated by forecasts from the Institute of International Finance (IIF), which sees flows declining in 2014 but then rebounding in 2015 (see chart to the left). In terms of the bond market, most countries have been able to borrow in the international capital markets since the fear of tapering began and EM dedicated funds started seeing steady outflows. In fact, the pace of issuance is back to past years’ trends, having recovered from the slowdown during mid-2013. Should the event of a sudden-stop emerge, however one factor that can help smooth out capital flows is the presence of official lenders such as the IMF. While there are few countries that for ideological or political reasons would be unlikely to agree to a funded programme, there are some that would be inclined to do so as a last resort. Countries with strong policy framework have access to facilities such as the Flexible Credit Line (FCL) or Precautionary and Liquidity Line (PLL), enabling them to borrow at short notice if needed. Currently, the IMF has $415 billion in forward commitment capacity (FCC), its main measurement of lending capacity, which is the equivalent of 75% of the non-FDI portfolio flows that was estimated to have gone into emerging markets in 2013. Countries that require an adjustment but offer no response or sub-optimal responses will underperform and will be particularly vulnerable in a sudden-stop scenario. Sub-optimal responses include insufficient fiscal or monetary tightening (if required), restrictions on capital outflows, multiple exchange rate regimes, price controls, foreign exchange reserve depletion and/or maintenance of overvalued exchange rates. Countries that we have concerns about on this front include Venezuela, Ghana, Mongolia and Nigeria, as well as a few additional countries in the Caribbean and Sub-Saharan Africa.
One of the toughest parts of rebalancing will be fiscal adjustments for countries that are running large budget deficits or where an additional tightening is needed to anchor inflation or debt dynamics. Brazil, Argentina, Venezuela, Serbia, Ukraine and Ghana are cases in point. This is likely to be one of the last phases of the adjustment, as it entails political costs and governments often do it on a reactive mode. Examples would include being under pressure from the markets (wider spreads and reduced access to capital markets), rating agencies (as the credit is downgraded) and/or from performance criteria or prior actions as required by an IMF programme, if the country is subject to one. The pressure normally builds up in this order. The fact that governments lack room to make large fiscal adjustments ahead of elections, and with so many elections due this year, means this adjustment will be postponed. Back to top
Wider spreads
We believe the credit quality in EM bonds has peaked as some of the factors that helped improve creditworthiness – namely reserve accumulation, easy global and domestic monetary conditions – have deteriorated in recent months. For example, headwinds to EM include a declining rate of trend growth in critical countries such as China and a deterioration in the terms of trade that many EM countries currently enjoy. However, the widening of sovereign hard currency spreads on an absolute basis is already pricing in a one notch downgrade on average.
For these reasons, we expect downgrades in Brazil, the Bahamas, Bermuda, Bahrain and Mongolia and upgrades in the Philippines, Colombia, Paraguay and Angola. On a relative basis, EM bonds have underperformed high yield, investment grade and peripheral European sovereigns, so the market is already pricing in some credit deterioration (see chart 6).
China is the most critical rebalancing act due to the sheer size of its economy and impact on global markets. We believe that a structural reduction in trend growth is inevitable, the main question being whether it will occur in an orderly or disorderly manner.
Political risk
In addition to economic risks, political and policy risks in emerging markets will shape asset prices in many countries. There are elections in 15 key countries (see chart 8), including countries such as India, Indonesia, Turkey, South Africa, Brazil and Ukraine. Popular discontent and political confrontation in Venezuela and Thailand are also being watched closely. Political risk is a very subjective element. While there are dozens of indices that rank countries based on their institutions, corruption, security, rule of law, etc, assessing how much that is worth in terms of spreads or currency valuations is never an easy task. Expectation of political or policy change often increases demand for safe assets and capital flight, both from locals and foreigners. That usually starts with currency weakening, but can also spill over into spreads in countries where the currency is more heavily managed or when it is accompanied by reserve loss. Countries with stronger institutions and low probability of policy change, such as Chile, see little to no volatility, while for others, like Ukraine, future prospects of economic policy and future alliances will be materially changed. We see upside risks (too much political risk priced in) in Indonesia, balanced risks in India, Brazil and South Africa, and downside risks in Ukraine.
While we believe the authorities are aware of the challenges, they are facing various delicate policy choices:
allowing investment growth to decline gradually, but without producing a hasty crash in its economy or in sectors such as the property market
steering the financial sector into greater foreign exchange and interest rate flexibility
reducing the pace of credit creation
allowing market forces to determine credit risk and reducing moral hazard
addressing corruption and fending off vested interests in state-owned enterprises
increasing transparency in financing operations of shadow-finance entities and local governments
reducing income inequality and managing social pressures as the economy slows
Some of these challenges are starting to be addressed (some currency and interest rate flexibility, increasing exceptions to the one child policy as demographics worsen), but clearly much more remains to be accomplished. Supportive factors include China’s large net international asset position, as well as its high domestic savings. We believe the markets are too fixated on the pace of growth in China. Instead, we would rather see lower, but higher quality, sustainable growth, than a particular headline number (see chart 7).
We remain vigilant of the potential negative spill-over from China on emerging markets and are managing these risks by carefully selecting our direct China exposure, as well as screening non-Chinese exposure to credits or currencies that can be negatively affected by a decline in commodity prices (particularly industrial metals). The latter includes weaker credits with large current account and/or fiscal deficits which will be under pressure given a material decline in terms of trade (for example, Mongolia, Zambia and the Chilean peso).
The continued adjustment of emerging market sovereigns towards an environment of higher rates and lower capital flows presents investment opportunities in the asset class. Valuations have improved in all three areas (currencies, local rates and spreads) on an absolute and relative basis. However, asset allocation between sovereigns (hard currency and local currency) and corporates and careful country and security selection remains key. Our preference is for sovereigns that are resilient to lower capital flows, have manageable debt burdens, stable foreign exchange reserves and/or resilient banking sectors. Among more vulnerable countries, we may favour those that have started taking policy steps in the right direction. We also prefer quasi-sovereigns/corporates that benefit from currency weakening, such as exporters, or that are exposed to countries we deem to be resilient. We have selectively taken profits on certain long US dollar positions in high carry countries where rebalancing is already under way. Back to top
A view of the year ahead in the bond markets
With many expecting a ‘great rotation’ out of fixed interest assets in 2013, bond investors will, in the main, have experienced a better year than some had predicted 12 months ago. It might not always have felt like it at the time – indeed, over the summer when markets were sent into a spin by the prospect of the US Federal Reserve (the Fed) cutting its supply of liquidity earlier than expected, it almost certainly did not. But riskier assets, notably high yield corporate bonds, have continued to perform strongly, while investment grade corporate bonds are on track to deliver another year of positive returns, in spite of the volatility.
Meanwhile, the macroeconomic backdrop has generally improved over the past year, with the economic recovery gaining significant momentum in the US and, more recently, the UK. However, the picture in Europe remains mixed, while our concerns over the emerging markets are mounting. However, despite their disparate prospects, all countries – and all bond markets – are united by at least one common dependency: the Fed.
The great taper debate
While investors might have started 2013 unfamiliar with the concept of ‘tapering’, the same is certainly not the case going into 2014. Since its introduction into the financial lexicon in May, markets have been in thrall to the ‘will-they-won’t-they’ nature of the great taper debate. As chart 1 shows, every new data release has only served to increase speculation and financial markets’ favourite soap opera is delicately poised as we enter 2014.
Although the exact timing of the taper is uncertain, one thing is clear. In our outlook for 2013, we set out our positive view of US growth prospects, driven by encouraging developments in the country’s housing market. One year on, and the reasons that led us to be optimistic about US economic growth – including an improving current account balance and steadily falling unemployment rate, as well as the rebounding housing market – remain in place.
Janet Yellen
Currently the Federal Reserve’s Vice Chair, Janet Yellen is the US labour market economist on course to become the world’s most important central banker. She has a reputation for ‘dovishness’ – a greater focus on unemployment than inflation – something we do not expect to change significantly.
Yellen has been a vehement advocate of accommodative monetary policy, although she concedes that QE cannot continue indefinitely. Given her background, we expect specific labour indicators to be central to her decision-making process.
It will be interesting to see the framework that a Yellen-led Fed will adopt to determine policy during her five-year term as Fed Chair. Specifically, Yellen has espoused ‘optimal control’ techniques in many of her major speeches. Under this approach, the central bank would use a model to calculate the optimal path of short-term interest rates in order to achieve its dual objective of price stability (2% inflation) and full employment (an unemployment rate of 6%). In a November 2012 speech, Yellen showed that monetary policy as determined by ‘optimal policy’ suggested a Fed Funds rate close to zero until 2016. The optimal control strategy suggests that the Fed would take a more aggressive stance towards fighting above-target unemployment, implying lower short-term rates for longer.
Judging by some of her recent speeches, we would not expect monetary policy accommodation to be fully removed until there is notable momentum in the following:
Pace of payroll employment growth
Gross job flows
Spending and growth in the economy
We therefore expect Yellen to continue with the Fed’s policy of ultra-easy monetary policy. However, while it is easy to label central bankers as ‘hawks’ or ‘doves’, we think this masks the fact that the true driver of monetary policy is data. If we see solid signs of growth momentum, we would not discount the possibility that a Yellen-led Fed will taper sooner than the consensus expects to prove her inflation-fighting credibility.
We are bullish on the US dollar in 2014. Having previously favoured the dollar against emerging market currencies and commodity currencies, after its weakness in the third quarter of 2013, we like it against all other major currencies too. The other long-term positive forces that have driven our excitement (and an increasing number of others) over the dollar, such as compelling valuations following a decade-long slump and the rapid move towards energy independence, will be equally valid in 2014 too. In a world where the UK is running a large current account deficit, Europe is considering sub-zero deposit rates and Japan is following through on a policy to weaken the yen, the US dollar faces the fewest technical and fundamental headwinds.
With the stage now set for the main event in 2014, current consensus has March as a likely contender for tapering to begin. However, there are various considerations that might come into play. One such is growth data: estimates for the drag that the recent US government shutdown will have had on fourth-quarter gross domestic product (GDP) numbers are wide-ranging, and the Fed will want to see that the economy remains on track before withdrawing some of its support. Plus, with only a short-term solution to the debt ceiling question found in October, the US must go through the same rigmarole again in the new year.
In the labour market, meanwhile, it is estimated that payroll growth of 175,000-200,000 per month is sufficient to put significant downward pressure on the unemployment rate, especially if the participation rate remains at its current very low level. We are not expecting a strong increase in the participation rate, due to demographic trends. The country’s aging population is putting the brakes on the participation rate rising, as the participation rate for older workers is lower and many are approaching retirement.
Even if tapering does begin in March, we must not forget that it means purely a reduction in, and not an end to, stimulus. The Fed wants to make it absolutely clear both to those in the real economy and financial market participants that interest rate rises themselves are likely to be much further off.
As we have seen in recent months from the reaction of bond yields around the world to taper speculation, no country is immune from the Fed’s decisions. We would, however, caution against expecting a large bear market for government bonds. Inflation is currently benign and central banks globally will be very gradual in any moves to remove monetary stimulus. Interest rate hikes are still likely to be years away, limiting the potential for a big bear market in bonds.
Even so, volatility in US Treasury markets and a rising US dollar could have a big impact on emerging market bonds. We have been cautious on the asset class for a couple of years. To summarise: we are concerned that the bubble that has developed in emerging markets, driven by surging portfolio inflows, is under threat due to historically tight valuations and the better prospects for the dollar. Equally, we are watching what we see as deteriorating emerging market fundamentals with concern. All of this, in our view, is leading to the possible creation of a perfect storm for the asset class, whereby any move by the Fed to start tapering could lead to huge outflows, the very real risk of currency and/or banking crises, and widespread contagion.
One topic has been baffling central bankers, bond investors and economists since the financial crisis: inflation, or the lack thereof. According to conventional wisdom, inflation is always and everywhere a monetary phenomenon, therefore causing fear that the extraordinary monetary policy of recent years would trigger rampant inflation across the US, Europe and the UK. We heard how governments and central banks were devaluing their currencies in order to become more competitive. The only way out of the western world’s debt problems would be through a mix of financial repression and a healthy dose of inflation.
More than five years have passed since the global economy was plunged into crisis. Developed world inflation appears remarkably under control, despite record levels of stimulus and money printing. While we have seen ‘sticky’ inflation numbers in the UK, partly due to regulated price increases for utilities, inflation in the US and Europe is well below central bank targets. Arguably, the harsh fiscal austerity implemented by many governments has contributed to the decline in inflation. In fact, central bankers’ current concerns centre on inflation being too low – something that is likely to remain the case in 2014.
We see one simple explanation why the massive increase in money supply has not fed through to higher inflation: it has not entered the real economy. Commercial banks are flush with cash but are not making many new loans (as chart 2 shows). Fortunately, it appears that banks may now be starting to relax their lending standards, although it is still hard to find creditworthy borrowers, particularly in countries such as Spain, Greece, Cyprus and Ireland. The recovery in lending will be a slow process. Worryingly for central bankers, those countries with negative or weak loan growth also appear most susceptible to deflation.
If we do start to see a pick-up in loan growth, this will likely indicate a strengthening in the quality of economic growth and improved prospects for business and consumer confidence. However, bond investors should not take such developments as a signal for complacency. Central bankers’ greatest fear is that banks’ reserves could flood into the economy, resulting in higher prices and unanchored inflation expectations. It is at times like these that investors must be at their most vigilant.
In 2013, we launched the M&G YouGov Inflation Expectations Survey, a quarterly survey gauging the public’s perception of inflation trends across the UK, Europe and Asia. Whilst inflation has been described as “the dog that didn’t bark” by the International Monetary Fund, we seriously doubt that the dog has been muzzled indefinitely. And, increasingly, the evolution of monetary policy away from inflation targeting towards forward guidance means that both policymakers and markets are monitoring inflation expectations. The first sign that inflation is becoming a problem will show itself through inflation expectation surveys such as ours, which makes vigilance imperative. The report is available at http://www.mandg.co.uk/inflationsurvey.
Should inflation re-emerge, central bankers will face a huge policy dilemma. At M&G, we have frequently mooted ‘central bank regime change’ – this shift away from targeting inflation towards boosting economic growth (and which therefore assists in eroding large debt burdens) – as a reason to own assets such as inflation-linked corporate bonds and floating rate notes. The risks of a monetary policy error have never been greater.
The answer to reflating an economy may lie in Japan, where the ‘three arrows’ of Abenomics – aggressive monetary easing, flexible fiscal policy and structural reforms – are a great experiment in modern economics. The three arrows are the best chance yet that Japan has had to escape from deflation. The theory is simple: aggressive easing, flexible fiscal policy and a strategy of higher inflation will lower real interest rates and result in increased consumption, greater investment and improved export competitiveness through the weaker yen.
We see encouraging signs that Abe’s policies are working. The yen has fallen by 15.3% in 2013 against the US dollar. Japanese equity markets are up 53% over the year to date. The economy has grown a solid 2.5% over nine months. Confidence is picking up and, importantly, inflation expectations are rising (see chart 3). This is not to say that there will not be challenges and risks ahead. Japan’s high public debt levels are largely sustained by capturing domestic funding, and the greatest risk is that a collapsing yen and negative real interest rates could result in a surge in outflows from domestic savers, bringing the government’s solvency into question.
It will be important to monitor Japan in 2014, as its experience could give central bankers and politicians in Europe in particular a game plan for jumpstarting their own economies.
Government bonds: a benign environment, despite tapering
As we approach 2014, financial markets are clearly in better shape than a year ago. Most equity indices are up for 2013, southern European sovereign bond yields are down sharply, and US Treasuries have rallied after the Fed’s surprise non-taper decision in September. But this positive outcome is not due to strong data or a long-term resolution of the European debt crisis. Growth is either below or close to trend levels in most economies, while asset prices have largely been supported by unprecedented levels of quantitative easing.
The Taylor rule
Ever since interest rates in the major developed economies hit the zero interest rate band, we have been interested in assessing what a Taylor rule for monetary policy would suggest for central bank rates across the US, UK and Europe. A Taylor rule is simply a monetary policy rule that suggests how a central bank should adjust interest rates in response to changes in inflation and macroeconomic activity.
The Taylor rule can be used to explain how policy has been set in the past, and whether the current monetary policy stance is appropriate for an economy. It can also serve as a guide for economists in determining the possible future policy path of interest rates. It appeals because it is relatively simple, and only requires knowledge of the direction of the current inflation rate relative to the target rate, and the output gap.
For the Fed, the rule rather nicely encompasses its dual mandate of maximising employment in the context of price stability. Although there are many versions of the rule, Yellen has shown a preference for the 1999 version, which, interestingly, has implied a zero or negative Fed Funds rate since late 2009.
The story is not dissimilar for the UK and Europe. Both regions surprised markets recently with lower than expected inflation (October CPI rates of 2.2% and 0.7% respectively). The Taylor rule would suggest that with inflation so far from the European Central Bank’s target of 2%, the bank should aggressively ease monetary policy, perhaps beyond November’s cut to 0.25% and even into negative territory.
The Taylor rule can be a useful rule-of-thumb for investors, enabling them to judge how short-term rates are likely to respond to changing economic conditions. Given that inflation has been falling recently, the Taylor rule implies that interest rates will remain low for longer (chart 6) – welcome news for us as bond fund managers.
Most regions still face very significant challenges in 2014, including very high levels of public and private debt. But with inflation expected to be muted and central bank rates likely to remain ultra-low, the environment for government bonds will remain relatively benign, despite higher yields and tapering-driven volatility. Whilst we acknowledge that there will be pressure on longer dated government bond yields to increase, we would caution against getting too bearish on the asset class, given that the short end of the curve will likely remain well anchored at current levels. Policy will remain highly accommodative, despite a slowly improving growth outlook.
Corporate bonds: recalibrate expectations
Corporate bond investors have experienced some excellent returns in recent years. The asset class has also benefitted from low volatility and broad-based inflows. With spreads heading back towards long-term averages (chart 4), some have questioned whether corporate bonds can continue to outperform, particularly in an environment of improved confidence and investor sentiment.
We believe the fundamental outlook for corporate bonds remains positive. With growth in the developed world recovering, defaults are likely to stay low. And, as already discussed, inflation is not a near-term issue. These two factors suggest that corporate bonds should remain a solid asset class for investors seeking good risk-adjusted returns.
After returning 5.2%, 10.8% and 0.3% in 2011, 2012 and 2013 (to end-November), investors must recalibrate their expectations for investment grade corporate bonds. The impending withdrawal of central bank support could create volatility in risk markets. In this sense, the tapering debate of 2013 gives us a guide to what to expect in 2014. However, with spreads starting the new year both tighter than in 2013 and close to historical averages, excess returns are likely to be lower. We believe most parts of the credit market will struggle to deliver much more than their coupon, but credit remains in favour versus other, even lower yielding, fixed income assets.
Investors in global high yield markets have enjoyed fantastic returns over the past couple of years, with total cumulative returns since 2012 of over 26%. This has resulted in a collapse in yields to close to record lows – from 7.7% in 2011 to 5.7% today. For us, high yield can be an attractive area of the fixed income market to generate returns in an environment of improving economic growth and low defaults.
But this should not mean that investors can rest on their laurels. The current benign environment for credit has led to a deterioration in the quality of issuance (as measured by credit rating and leverage), weaker structural protections like legal covenants, the return of pay-in-kind (PIK) bonds, and lower coupons on new issuance, which has resulted in lower future expected returns. We believe in some cases, particularly for lower quality high yield such as CCC rated bonds, credit spreads are not adequately compensating investors for the possibility that defaults could rise at some point in the future.
In such an environment, relative performance will be increasingly driven by single-name credit calls, and sector positioning will also be more significant than in recent years. It is more important than ever for bond investors and their credit analyst teams to do their homework, especially if the European credit market follows the US (as shown in chart 5) into an era of corporate re-leveraging and increased leveraged buyout risk.
Emerging market bonds: exercise caution
The potential re-pricing of US monetary policy is clearly the most serious risk facing global emerging markets in 2014. Outside this, we expect developments in China to dominate emerging markets. While the problems facing the Chinese economy are well documented, we think some investors may still be underestimating the risk of a slowdown. This could prove a costly mistake. China’s economy remains imbalanced: almost 50% of GDP comes from gross fixed-capital formation, up from a third in 1997. Massive excess capacity, high and rising corporate debt and an increasingly marginalised private sector are other symptoms of deeply rooted mismatches in the country’s economy.
It’s a knockout
Many have been quick to criticise the evolution in the Bank of England’s approach to monetary policy as advocated by its new Governor, Mark Carney. ‘Forward guidance’ – essentially making a promise about future interest rates – is now the foundation of central bank policy in the UK. The problem is the market has largely ignored the Bank of England’s promise that it will keep the base rate at 0.5% until unemployment hits 7%. As gilt yields and sterling have risen in anticipation of an earlier rate hike, financial conditions have become more restrictive. This could make economic growth harder to achieve – the very thing that the Bank of England is trying to avoid through its use of forward guidance.
The Bank itself recently told the market that it sees a 50% chance that unemployment will fall to 7% by the end of 2014, 18 months earlier than it had estimated in August. But unemployment is only one factor. The Bank has nominated three ‘knockouts’ which, if breached, would bring an end to forward guidance. These are based on inflation forecasts, inflation expectations and financial stability.
Of these, it is the 7% unemployment rate threshold that will likely pose the greatest challenge to continued forward guidance in 2014, given the recovery in the UK economy. If unemployment fell to this level, it would not necessarily trigger a rate hike, but it would bring about a re-assessment of monetary policy in the short term. Provided the other ‘knockouts’ remain relatively in line, we would not rule out a reduction in the forward guidance unemployment rate threshold to 6.5% or below.
We believe the knockouts all seem rather easily knocked out, which is a problem for the Bank of England. The market agrees and thinks that the Bank will end forward guidance early, despite Carney’s protestations. The tightening in financial conditions currently under way will likely result – with a lag – in a slowdown in the UK’s recent growth spurt.
We can see that Chinese policymakers understand the economy’s precarious position and are working to gradually defuse it. But we think that regardless of which reform path Beijing takes, more corporate defaults, rising non-performing loans, and some degree of a credit crunch are unavoidable over the next three years. Taking the experiences of, among others, the Soviet Union in the 1960s-70s, Japan in the 1970s-80s and southeast Asia in the 1980s-90s, a rebalancing of China’s economy away from investments and exports towards consumption will likely result in weaker GDP growth rates. China will still grow, it will still be a large number, but this number will be closer to 5%-6% than 10%.
Any slowdown in China would likely lead to a drop in emerging Asian currencies. We believe capital outflows and trade concerns could provoke up to 10% depreciation in local currencies. Implementing capital controls to stem outflows could arrest the slide, but we believe this is unlikely, given the long-term damage this would do to investor confidence.
If the Fed tapers in 2014, as expected, this will remove a key technical support from the emerging markets. Rising bond yields – even if range bound – and expectations of reduced asset purchases would likely drive the US dollar higher, hurting emerging equity markets and in turn driving credit spreads wider. Borrowers who need dollars could be doubly affected by this development. Meanwhile, any large-scale wobble in global investor sentiment could see the massive inflows of recent years reverse, with considerable consequences for investors as well as issuers.
As we mentioned earlier, no country – and this applies especially to the emerging markets – is entirely impervious to the Fed and its decisions. In the end, all roads lead back to the US.
Get Bond Vigilantes updates straight to your inbox
Sign up to the Bond Vigilantes mailing list to ensure you never miss a great article from our expert Bloggers. We will email all new articles to your inbox, meaning you can stay on top of the world of Bonds.
I confirm that I would like to receive information about Bond Vigilantes and products and services from M&G Securities Limited.
We will use the email address and personal data you have shared with us to send you this information. For existing customers, submitting your contact details and requesting to receive this information from us, will replace any earlier choices you have made in respect of marketing information.
You can unsubscribe from marketing at any time, at which point we will not send any further marketing information to you, by selecting the unsubscribe link in all communications.