What is the probability of a U.S. recession in the next 12 months?
Knowing how poor the central banks have been at forecasting economic indicators, and having analysed the IMF’s wild forecasts, we think that it makes sense to take consensus views with a large grain of salt. However, there is a substantial body of empirical evidence that has emerged since the 1980s that suggests that the bond market is a pretty good predictor of real economic activity.
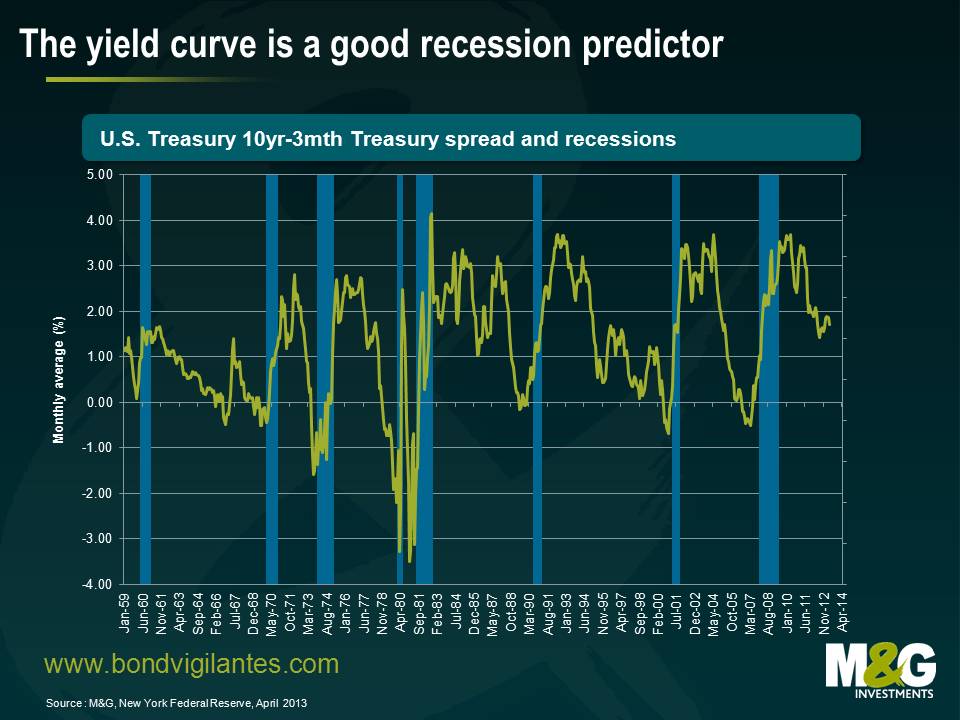
It has been proven that the slope of the yield curve has had a consistent negative relationship with economic activity in the U.S., with a lead time of around 1-1.5 years. By analysing the difference between 10-year and 3-month Treasury rates (also known as the treasury yield-curve spread), it is possible to calculate the probability of a recession in the U.S. in the coming 12 months. The theory goes that a monetary tightening will increase short-term rates, resulting in a flat (or inverted) yield curve as the economy slows and demand for credit falls. Additionally, inflation expectations may also fall at this time.
Research has shown that the yield curve has predicted essentially every U.S. recession since 1950 with only one “false” signal, which preceded the credit crunch and slowdown in production in 1967. This is shown in the chart below. There is also evidence that the predictive relationships exist in other countries, such as Germany and the United Kingdom.
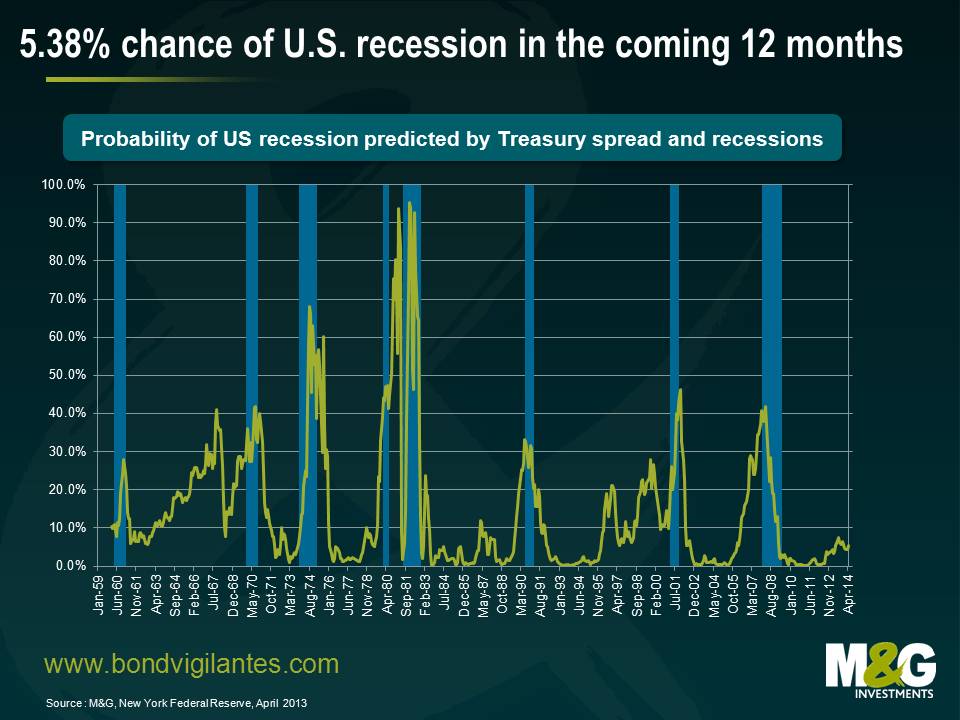
Having established the predictive power of the yield curve, economists naturally wanted to assess what the yield curve was telling us about the probability of recession going forward. In 1996, economists from the Federal Reserve Bank of New York estimated the likelihood of recession based on the yield-curve spread.
Helpfully, the Federal Reserve Bank of New York updates its research on a regular basis. So what probability of recession in the next 12 months is the bond market currently pricing in? The answer is 5.38% to be precise (this is probably lower than it should be due to the Fed embarking on a record amount of quantitative easing).
Some economists swear by the predictive power of the yield curve. Others argue the yield curve has lost some of it predictive power due to other factors that are driving the longer end of the yield curve; such as quantitative easing, currency pegs to the U.S. dollar, and regulations. However, the simple rule of thumb that the difference between ten-year and three-month Treasury rates turns negative in advance of recessions is still reliable, with negative values observed before the 1990-1991, 2001 and 2008 recessions. Perhaps Alan Greenspan’s “conundrum” of low long-term interest rates wasn’t due to what Ben Bernanke termed as a “global savings glut”. Rather, the yield curve was telling us that the chances of recession were rising, and this is reflected in the increase in the probability of recession from 4.5% in January 2006 to 38% in January 2008.
The yield curve remains a great tool for investors. Its power to predict recessions cannot be ignored, so beware if it inverts again.
The value of investments will fluctuate, which will cause prices to fall as well as rise and you may not get back the original amount you invested. Past performance is not a guide to future performance.


18 years of comment
Discover historical blogs from our extensive archive with our Blast from the past feature. View the most popular blogs posted this month - 5, 10 or 15 years ago!


Bond Vigilantes
Get Bond Vigilantes updates straight to your inbox


