The Emerging Markets Rebalancing Act
Over the past year, investors’ perception towards emerging market bonds changed from viewing the glass as being half full to half empty. The pricing-in of US ‘tapering’ and higher US Treasury yields largely drove this shift in sentiment due to concerns over sudden stops of capital flows and currency volatility. For sure, emerging market economies will need to adjust to lower capital flows, with this adjustment taking place on various fronts over several years. In this issue of our Panoramic Outlook series, we examine the main channels of transmission, policy responses and asset price movements, as well as highlight the risks and opportunities we see in the asset class. Our focus in this analysis is on hard currency and local currency sovereign debt.
Some emerging market countries are more advanced than others in the rebalancing process, while others may not need it at all. Also relevantly, the amount of rebalancing required should be assessed on a case-by-case basis, as the economic and political costs must be weighed against the potential benefits.
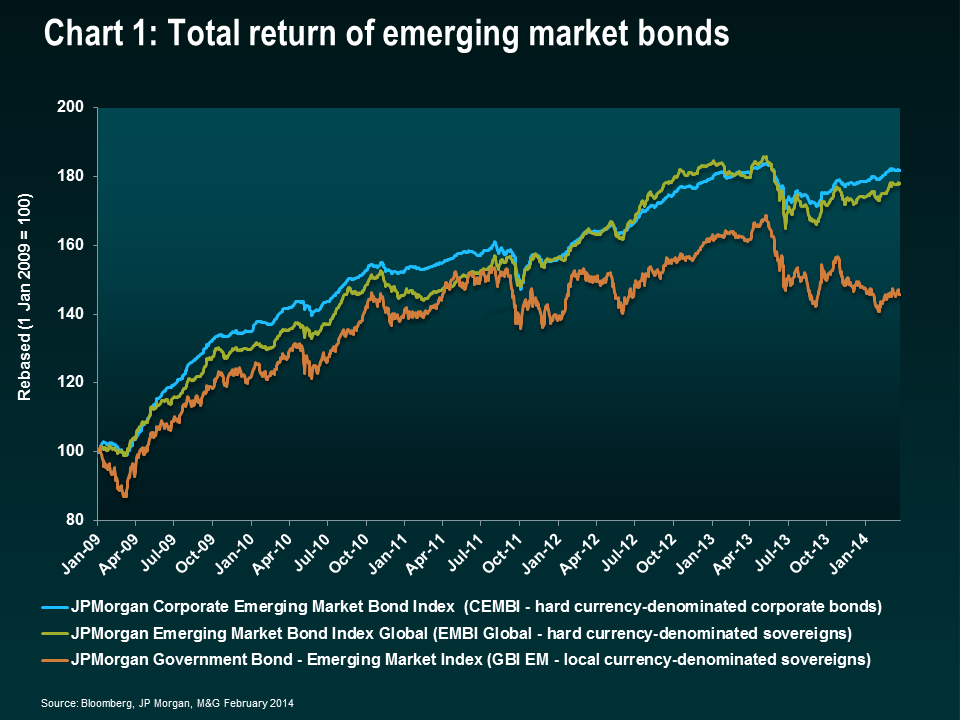
Generally, the necessary actions include reducing external vulnerabilities such as large current account deficits (especially those financed by volatile capital flows), addressing hefty fiscal deficits and banking sector fragilities, or balancing the real economy between investment and credit and consumption. It is worth noting that not all countries have vulnerabilities. And those that do not are the ones that should be bought in sell-offs like the ones we saw in June and August 2013, as well as early 2014 (see chart 1).
EM hard currency debt – higher Treasury yields
Emerging market (EM) hard currency debt is issued by sovereign (or quasi-sovereign) entities in currencies other than their local currency, usually in the US dollar. The largest issuers in this market are currently Mexico, Russia, Indonesia, Venezuela and Turkey. Returns for hard currency debt are driven essentially by credit spreads and US Treasury movements. In turn, they tend to correlate positively with Treasuries.
We expect US Treasury yields to gradually move higher towards neutrality of around 4% over the next few years, which should weigh slightly on EM hard currency debt returns. But with the tapering of asset purchases already priced in and given low inflationary pressures, the Fed can remain dovish on its guidance in the near term. As such, Treasury performance in 2014 should improve compared with negative returns in 2013, which was one of the headwinds that weighed on EM investment grade last year.
EM local currency debt – weaker currencies
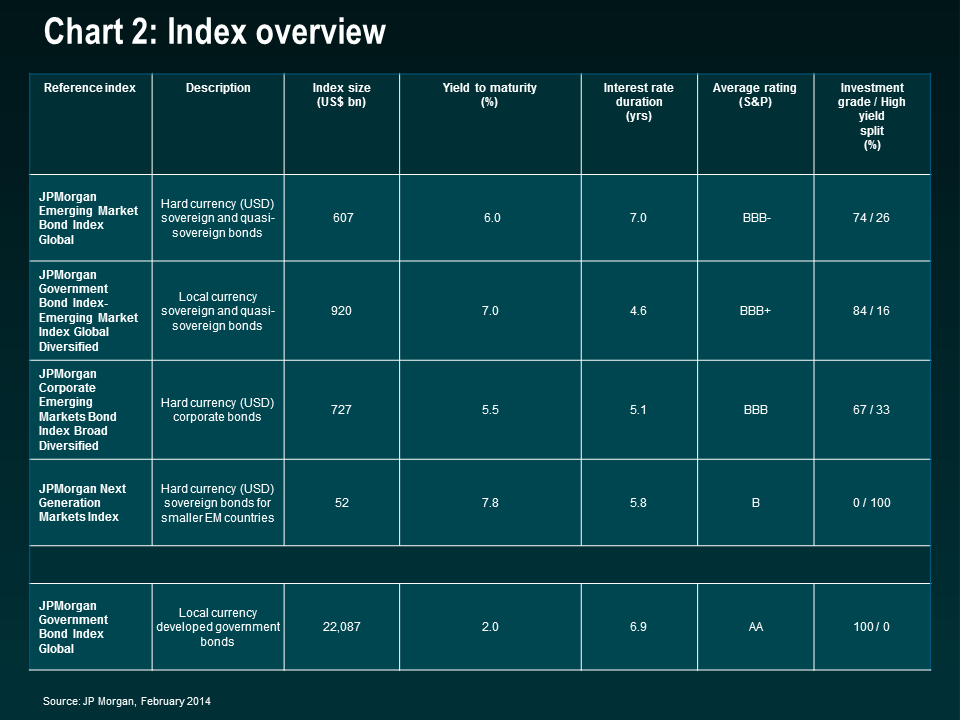
EM local currency debt is issued by governments in their local currencies. The largest issuers in this market are currently Brazil, Mexico, Poland, South Africa, Malaysia and Russia. Returns for local currency government debt tend to be driven by global yield, country-specific factors such as inflation and monetary policy expectations, risk premia and currency movements. A basic overview of the different emerging market indices is shown in chart 2.
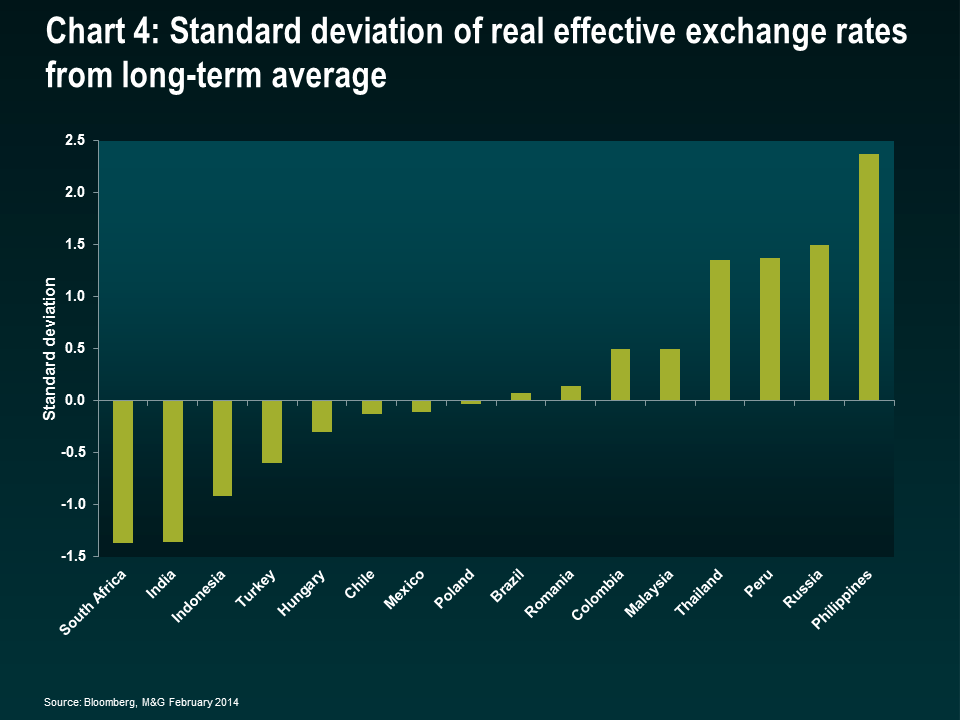
Since markets began to anticipate Fed tapering in the middle of last year, most emerging currencies have depreciated in nominal and real terms in either an orderly process with minimal reserve loss (including free floaters such as South Africa, Mexico or Colombia) or in an abrupt process (including the dirty pegs or managed currencies in countries such as Argentina, Kazakhstan and Ukraine). A simple gauge of determining whether a currency is fundamentally undervalued or overvalued is the real effective exchange rate. This measure seeks to assess the value of a currency against a basket of currencies based on nominal exchange rates and the changes of relative prices. The fundamental notion is that large deviations signal over or undervaluation, ceteris paribus (ie no fundamental changes such as terms of trade, productivity levels or other structural changes in an economy) (see chart 4).
It is worth highlighting that currency depreciation does not necessarily equate to a currency crisis. A depreciation may not be negative for a credit if there are little or no currency mismatches on the balance sheet of the public and corporate sector, if the country enjoys credibility regarding its inflation targeting regime and remains vigilant of inflation expectations, and if the fiscal impact is not large. It can even be positive if the country has sectors that can benefit from increased competitiveness or if the impact on its fiscal accounts is positive, for instance in the case of oil exporters. The recent 18% devaluation of the Kazak tenge is an example. Despite the devaluation, Kazakhstan spreads did not widen. We are comfortable investing in hard currency debt of such countries where depreciation does not represent a currency crisis. The currency impact for investors can be significant so it is important to get the asset allocation and security selection calls right. For example, in South Africa the local benchmark fell 5.4% between 15 September and 31 December 2013, while the hard currency benchmark rose 2.3% (in US dollar terms). The South African central bank did not intervene through the period and the country’s net international reserves remained stable. This differs materially from 10 years earlier, when the country’s net reserves were negative due to its short US dollar exposure through forward sales. Fair value is difficult to determine with precision. There are various approaches for doing so. The IMF, for example, provides three approaches, which often lead to conflicting results.
Purchasing power parity (PPP) metrics, on the other hand, are simple to construct, but fail to take into consideration several elements that affect valuations, such as structural changes in an economy, terms of trade and productivity changes. However, they can usually highlight large deviations. Some countries have already started seeing a rebalancing and reduction of their current account deficits (eg India, Indonesia), which has in turn helped to support their currencies and local bond markets. Other currencies appear theoretically cheap (South African rand, Turkish lira), but this has not yet been reflected in the narrowing of their current account deficits. In terms of positioning, we favour currencies with low imbalances such as the Mexican peso and Philippine peso, or high carry currencies that have already started rebalancing like the Indonesian rupiah and Indian rupee.
Higher interest rates
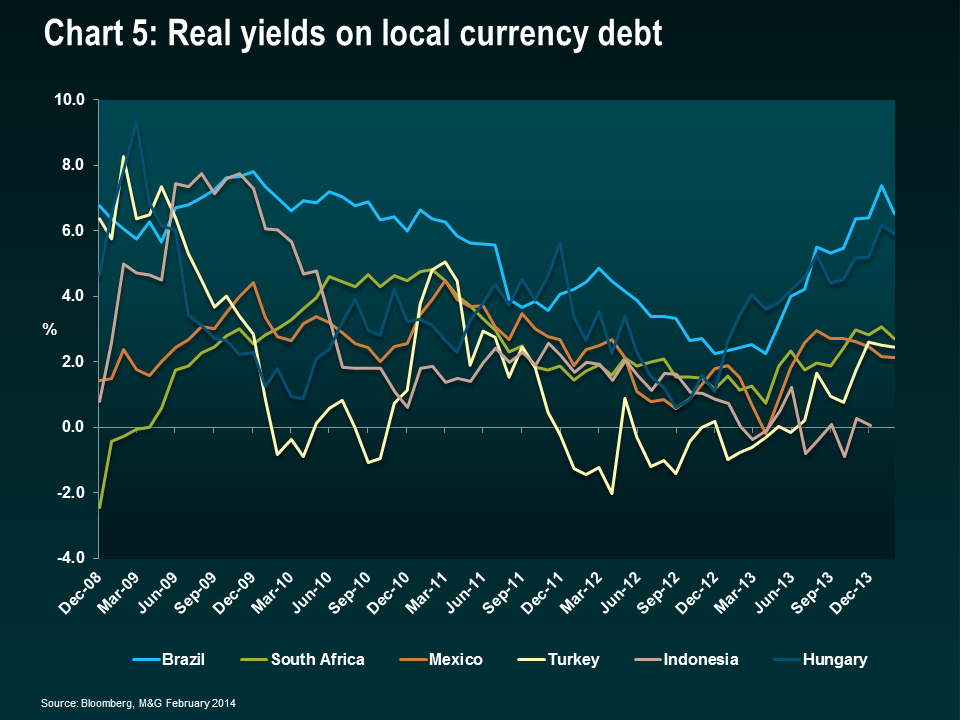
Various EM central banks, including in Brazil, Indonesia and South Africa, have had to tighten monetary policy pre-emptively in order to anchor inflation expectations or reactively respond to currency pressures, particularly in countries like Turkey where large current account deficits require higher interest rates to attract financing. On average, nominal interest rates stand at 7% and real rates around 3%. We believe that, like US Treasury yields, medium- to long-term real yields on local currency debt still need to rise, but part of the adjustment has already been achieved (see chart 5). Weaker currencies and higher interest rates will tend to reduce growth, particularly in countries that do not stand to benefit from improved competitiveness or gains on non-commodity exports. The IMF has maintained its growth projections for emerging economies unchanged in its January report (5.1% for 2014 and 5.4% for 2015), but we expect downward revisions at its upcoming April report as some key economies (Russia, China) are facing additional headwinds. A combination of higher interest rates and lower growth will require a (potentially pro-cyclical) fiscal adjustment in a few countries that need to stabilise their debt dynamics.
Capital flows
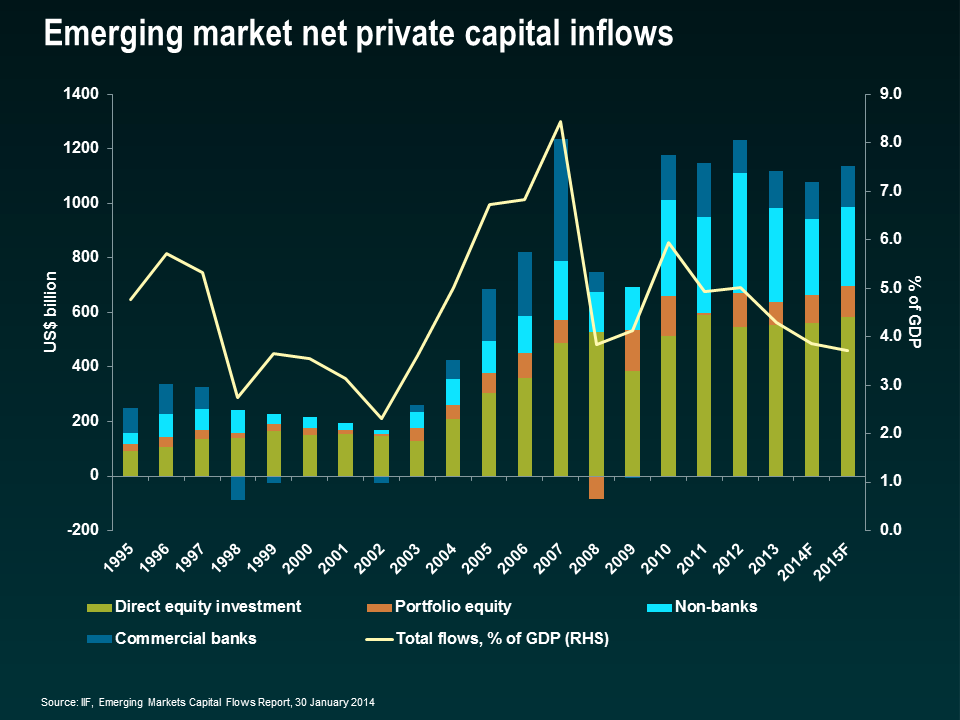
The World Bank has recently warned of a potential material decline in capital flows to emerging markets in a scenario where developed market long-term rates increase by 2%. However, based on recent trends (flows have already been declining), its baseline modelled scenario expects flows to decline slightly from current levels. This is also corroborated by forecasts from the Institute of International Finance (IIF), which sees flows declining in 2014 but then rebounding in 2015 (see chart to the left). In terms of the bond market, most countries have been able to borrow in the international capital markets since the fear of tapering began and EM dedicated funds started seeing steady outflows. In fact, the pace of issuance is back to past years’ trends, having recovered from the slowdown during mid-2013. Should the event of a sudden-stop emerge, however one factor that can help smooth out capital flows is the presence of official lenders such as the IMF. While there are few countries that for ideological or political reasons would be unlikely to agree to a funded programme, there are some that would be inclined to do so as a last resort. Countries with strong policy framework have access to facilities such as the Flexible Credit Line (FCL) or Precautionary and Liquidity Line (PLL), enabling them to borrow at short notice if needed. Currently, the IMF has $415 billion in forward commitment capacity (FCC), its main measurement of lending capacity, which is the equivalent of 75% of the non-FDI portfolio flows that was estimated to have gone into emerging markets in 2013. Countries that require an adjustment but offer no response or sub-optimal responses will underperform and will be particularly vulnerable in a sudden-stop scenario. Sub-optimal responses include insufficient fiscal or monetary tightening (if required), restrictions on capital outflows, multiple exchange rate regimes, price controls, foreign exchange reserve depletion and/or maintenance of overvalued exchange rates. Countries that we have concerns about on this front include Venezuela, Ghana, Mongolia and Nigeria, as well as a few additional countries in the Caribbean and Sub-Saharan Africa.
Fiscal adjustments
One of the toughest parts of rebalancing will be fiscal adjustments for countries that are running large budget deficits or where an additional tightening is needed to anchor inflation or debt dynamics. Brazil, Argentina, Venezuela, Serbia, Ukraine and Ghana are cases in point. This is likely to be one of the last phases of the adjustment, as it entails political costs and governments often do it on a reactive mode. Examples would include being under pressure from the markets (wider spreads and reduced access to capital markets), rating agencies (as the credit is downgraded) and/or from performance criteria or prior actions as required by an IMF programme, if the country is subject to one. The pressure normally builds up in this order. The fact that governments lack room to make large fiscal adjustments ahead of elections, and with so many elections due this year, means this adjustment will be postponed.
Wider spreads
We believe the credit quality in EM bonds has peaked as some of the factors that helped improve creditworthiness – namely reserve accumulation, easy global and domestic monetary conditions – have deteriorated in recent months. For example, headwinds to EM include a declining rate of trend growth in critical countries such as China and a deterioration in the terms of trade that many EM countries currently enjoy. However, the widening of sovereign hard currency spreads on an absolute basis is already pricing in a one notch downgrade on average.
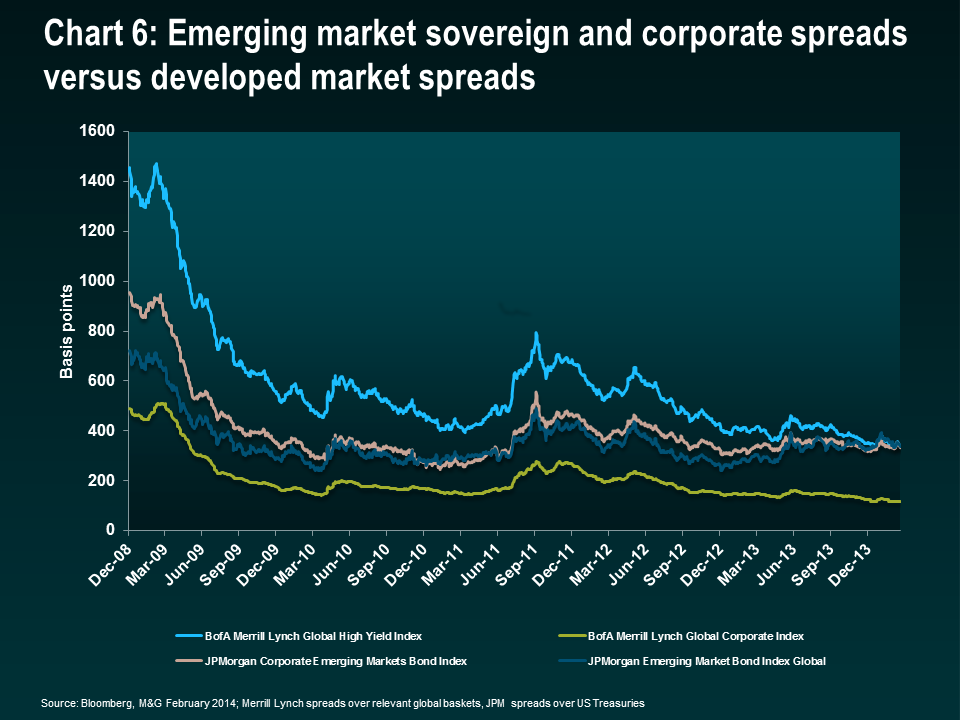
For these reasons, we expect downgrades in Brazil, the Bahamas, Bermuda, Bahrain and Mongolia and upgrades in the Philippines, Colombia, Paraguay and Angola. On a relative basis, EM bonds have underperformed high yield, investment grade and peripheral European sovereigns, so the market is already pricing in some credit deterioration (see chart 6).
Rebalancing China
China is the most critical rebalancing act due to the sheer size of its economy and impact on global markets. We believe that a structural reduction in trend growth is inevitable, the main question being whether it will occur in an orderly or disorderly manner.
Political risk
In addition to economic risks, political and policy risks in emerging markets will shape asset prices in many countries. There are elections in 15 key countries (see chart 8), including countries such as India, Indonesia, Turkey, South Africa, Brazil and Ukraine. Popular discontent and political confrontation in Venezuela and Thailand are also being watched closely. Political risk is a very subjective element. While there are dozens of indices that rank countries based on their institutions, corruption, security, rule of law, etc, assessing how much that is worth in terms of spreads or currency valuations is never an easy task. Expectation of political or policy change often increases demand for safe assets and capital flight, both from locals and foreigners. That usually starts with currency weakening, but can also spill over into spreads in countries where the currency is more heavily managed or when it is accompanied by reserve loss. Countries with stronger institutions and low probability of policy change, such as Chile, see little to no volatility, while for others, like Ukraine, future prospects of economic policy and future alliances will be materially changed. We see upside risks (too much political risk priced in) in Indonesia, balanced risks in India, Brazil and South Africa, and downside risks in Ukraine.
While we believe the authorities are aware of the challenges, they are facing various delicate policy choices:
- allowing investment growth to decline gradually, but without producing a hasty crash in its economy or in sectors such as the property market
- steering the financial sector into greater foreign exchange and interest rate flexibility
- reducing the pace of credit creation
- allowing market forces to determine credit risk and reducing moral hazard
- addressing corruption and fending off vested interests in state-owned enterprises
- increasing transparency in financing operations of shadow-finance entities and local governments
- reducing income inequality and managing social pressures as the economy slows
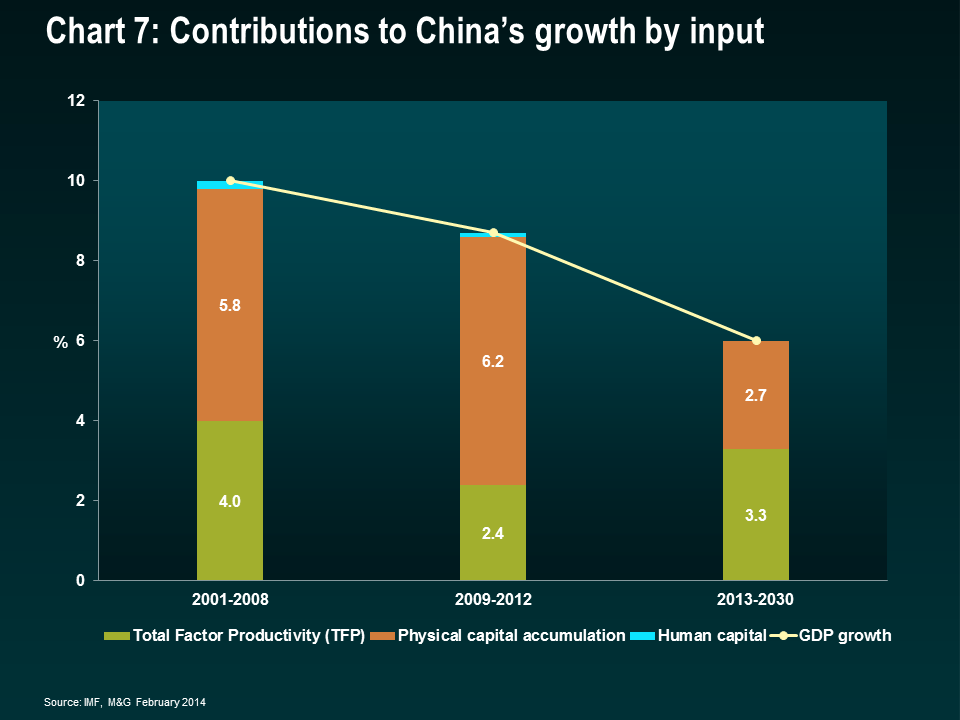
Some of these challenges are starting to be addressed (some currency and interest rate flexibility, increasing exceptions to the one child policy as demographics worsen), but clearly much more remains to be accomplished. Supportive factors include China’s large net international asset position, as well as its high domestic savings. We believe the markets are too fixated on the pace of growth in China. Instead, we would rather see lower, but higher quality, sustainable growth, than a particular headline number (see chart 7).
We remain vigilant of the potential negative spill-over from China on emerging markets and are managing these risks by carefully selecting our direct China exposure, as well as screening non-Chinese exposure to credits or currencies that can be negatively affected by a decline in commodity prices (particularly industrial metals). The latter includes weaker credits with large current account and/or fiscal deficits which will be under pressure given a material decline in terms of trade (for example, Mongolia, Zambia and the Chilean peso).
Opportunities
The continued adjustment of emerging market sovereigns towards an environment of higher rates and lower capital flows presents investment opportunities in the asset class. Valuations have improved in all three areas (currencies, local rates and spreads) on an absolute and relative basis. However, asset allocation between sovereigns (hard currency and local currency) and corporates and careful country and security selection remains key. Our preference is for sovereigns that are resilient to lower capital flows, have manageable debt burdens, stable foreign exchange reserves and/or resilient banking sectors. Among more vulnerable countries, we may favour those that have started taking policy steps in the right direction. We also prefer quasi-sovereigns/corporates that benefit from currency weakening, such as exporters, or that are exposed to countries we deem to be resilient. We have selectively taken profits on certain long US dollar positions in high carry countries where rebalancing is already under way.
The value of investments will fluctuate, which will cause prices to fall as well as rise and you may not get back the original amount you invested. Past performance is not a guide to future performance.


18 years of comment
Discover historical blogs from our extensive archive with our Blast from the past feature. View the most popular blogs posted this month - 5, 10 or 15 years ago!


Bond Vigilantes
Get Bond Vigilantes updates straight to your inbox


