


The Best Relative Value Trade We Have Ever Seen

Distortions in the index-linked market have created the most compelling relative-value opportunity we have ever seen. The 10–15-year sector sits at the heart of this opportunity.
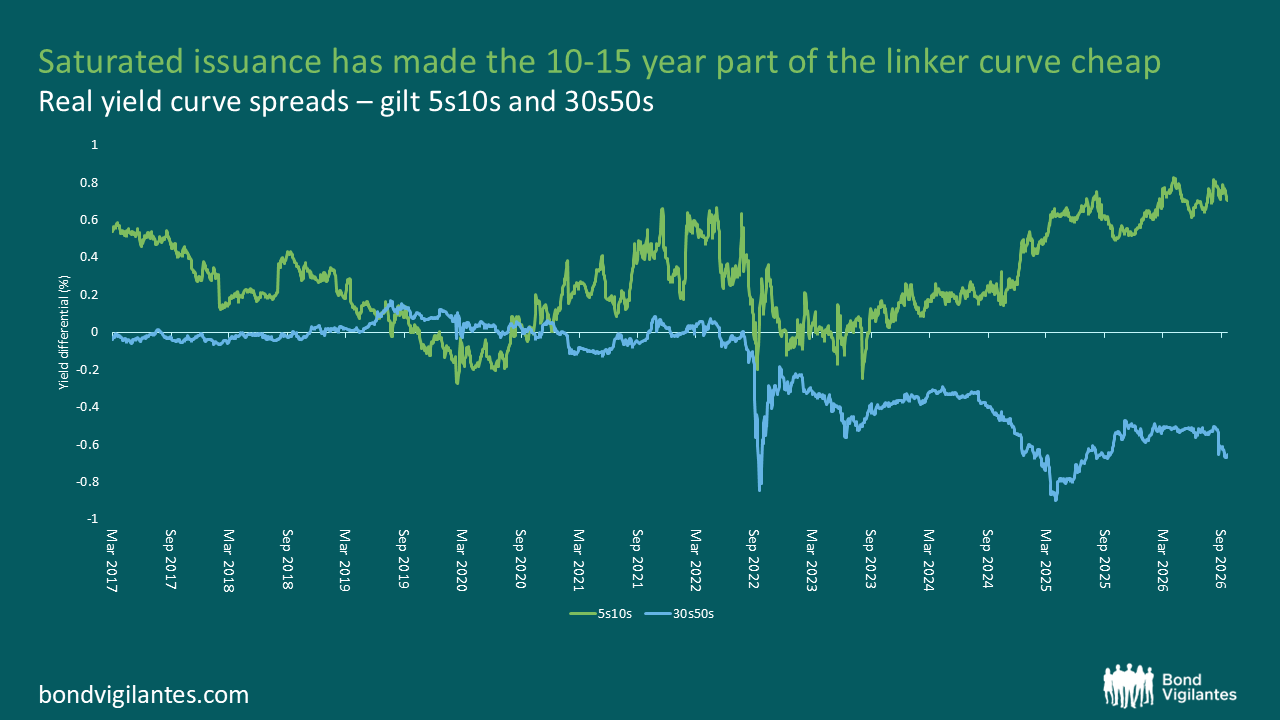
The Debt Management Office (DMO) has moved rapidly to shorten the maturity of gilt issuance over the past 18 months. This has been true for all types of gilts, but in the index linked market, where issuance events are less frequent, this has caused some big distortions. The last three index linked syndications have all been in the 10–15-year maturity area. This part of the yield curve has become saturated and now trades the cheapest it has ever been relative to maturities on either side.
The chart below shows how the spread between 5- and 10-year index linked has moved ever higher, i.e. the yield curve is steep. However, at the long end of the market 50-year linkers yield less than 30 year linkers, i.e. the curve is inverted and has got more room to invert further. The chart below highlights a striking divergence in the shape of the index-linked gilt curve. The spread between 5- and 10-year linkers has steadily widened, reflecting an increasingly steep curve. At the long end, however, the opposite is true: 50-year linkers yield less than 30-year linkers, leaving this part of the curve inverted.
Source: Bloomberg (15 October 2026)
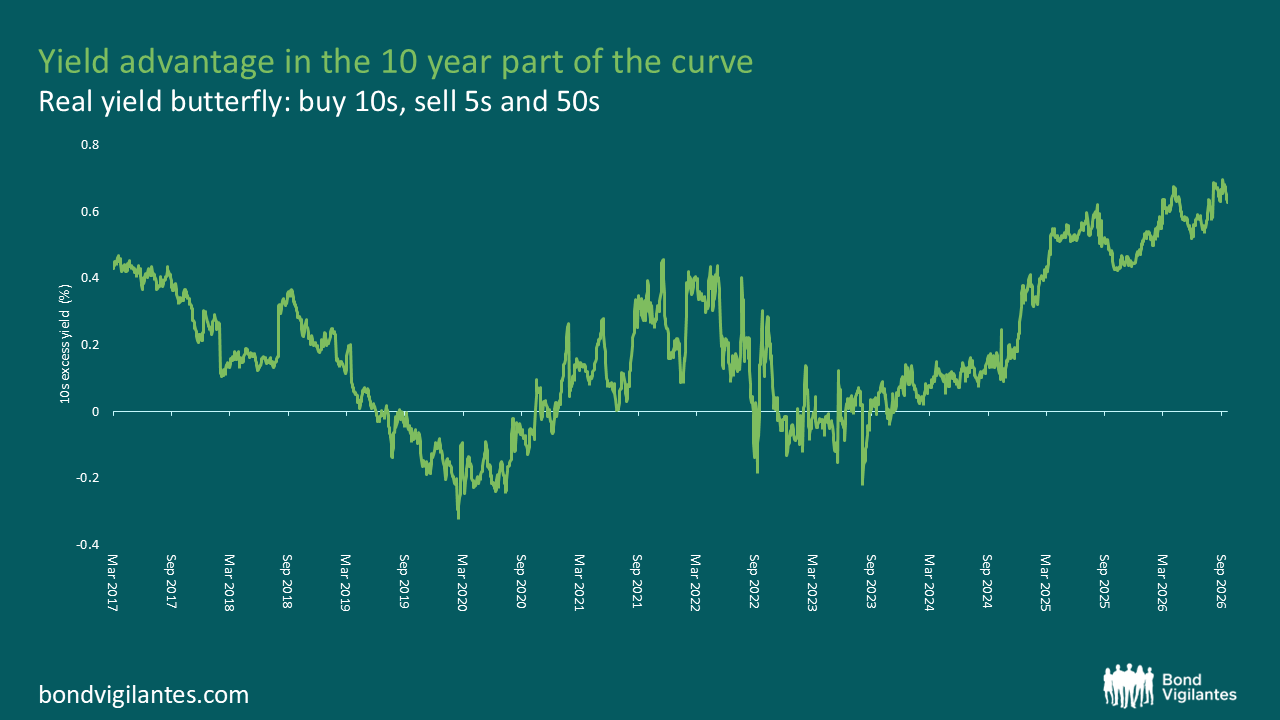
This means that if you sell a combination of short and long dated bonds and use the proceeds to buy the 10 year (on a duration neutral basis) there is a substantial yield pickup on offer. The chart below shows the yield advantage of owning the 10 years has evolved through time. The chart below shows how the yield advantage from owning 10-year linkers has changed through time.
It is now at record levels. A positive number means that 10 years offer a higher yield than a combination of 5 years and 50 years. Where the chart goes negative, the 10 year yield less than a combination of the 5 years and 50 years (the wings).
Source: Bloomberg (15 October 2026)
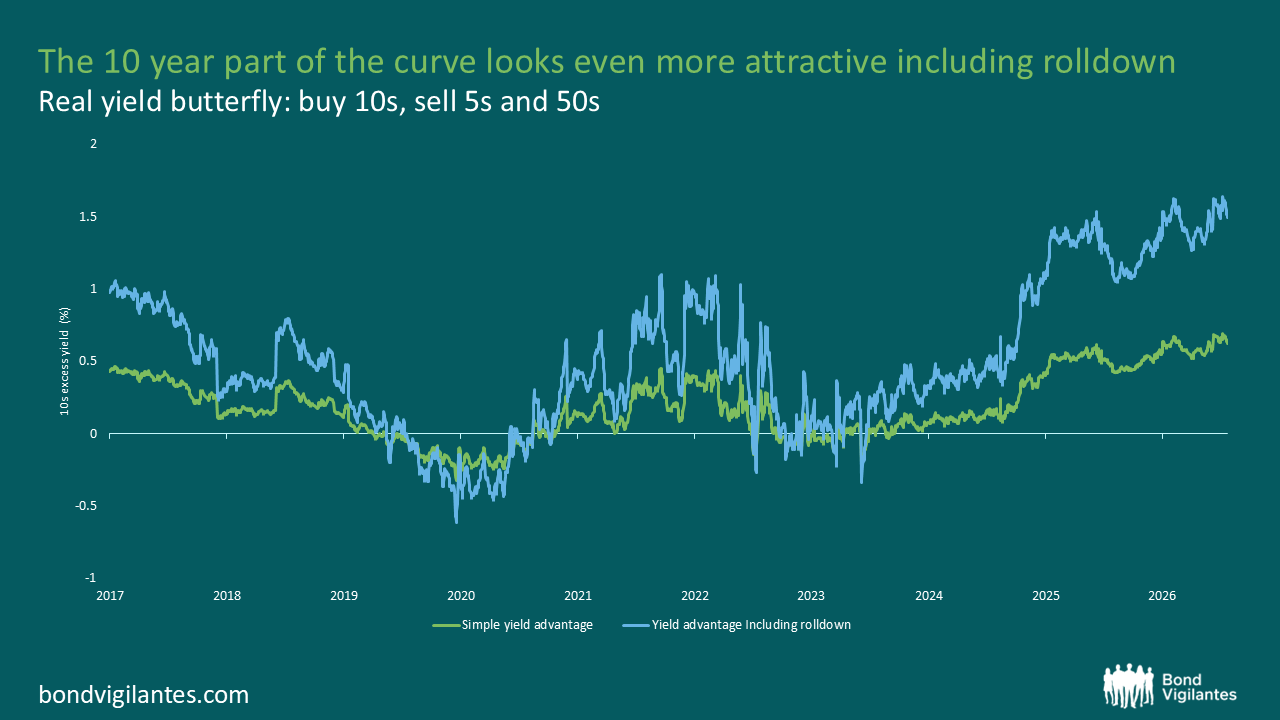
However, the yield advantage is likely to be far greater than this through time. If the market structure remains as it is, as time passes the 10 year bond will roll down the curve towards becoming a 5 year bond, and hence trade with a lower yield, as its term premium erodes. This will produce capital gains in addition to the carrying income. This concept is known as roll down, and is one of the bond investor’s best friends. Meanwhile conversely the long-dated bonds may see their yield rise (and price fall) as they become more like 30-year bonds. Incorporating the roll down into our calculations, we can compare the simple yield advantage with an expectation for what the all in excess return may be.
Source: Bloomberg (15 October 2026)
As can be seen from the chart, the total excess return from owing 10 year bonds relative to a combination of 5 years and 50 years could be around 1.5% per annum, something like 7.5% over a 5-year holding period. If nothing changes, i.e. 10 years simply remain as cheap as they are now, it will take the full 5 years to realise the 7.5% relative gain, but it will highly likely be realised in the end, some each year for 5 years. If the current distortion corrects then the large excess return will be realised in the year in which it happens. We suspect the latter is more likely, but either way investors will benefit from the excess return.
The value of investments will fluctuate, which will cause prices to fall as well as rise and you may not get back the original amount you invested. Past performance is not a guide to future performance.