US housing crash now worse than during the Great Depression
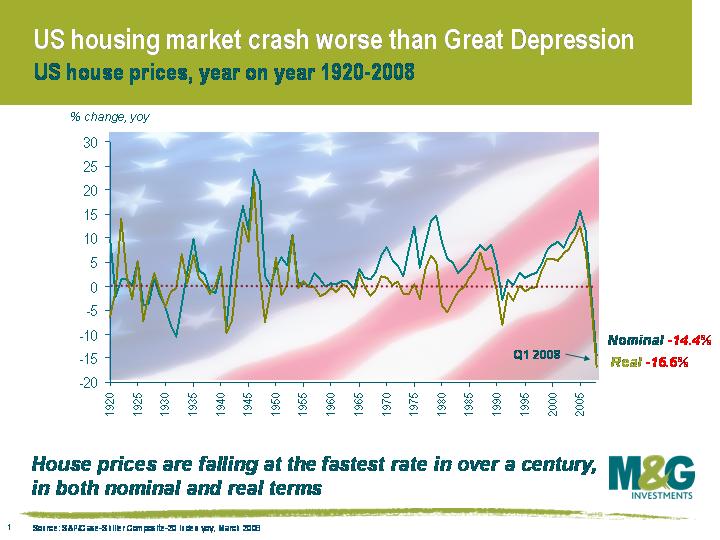
US data released last week showed that US house prices fell by 14.4% in the year to the end of March (this is the S&P/Case-Shiller Composite-20 Index, which the market tends to focus more on – the S&P/Case-Shiller Composite-10 Index was down 15.3%). The track record of these indices is not very long though – the composite-20 index goes back to 2000, while the composite-10 index began in 1987. So Robert Shiller, who is the cofounder of the index, has calculated the change in both nominal and real US house prices going back to 1890. As shown on our chart below and reported in this week’s Economist, US house prices are now falling faster than the -10.5% rate witnessed in 1932. Given the month-on-month declines of more than 2% that we’re currently seeing, it should only be a few more months until the year-on-year record of -16.1% is broken, which dates back to 1901.
US nominal house price falls are bad enough, but the picture is even worse in real terms (ie adjusted for inflation). Real US house prices are currently falling by 16.6%, which is easily the worst figure on record. In 1932 for example, the US economy was experiencing deflation of 10.1%, so real house prices were only falling by 0.4%. The US housing market doesn’t appear to be anywhere nearer reaching the bottom either – the supply of houses on the market is very close to all time records, and house prices will have to continue falling until this is cleared.
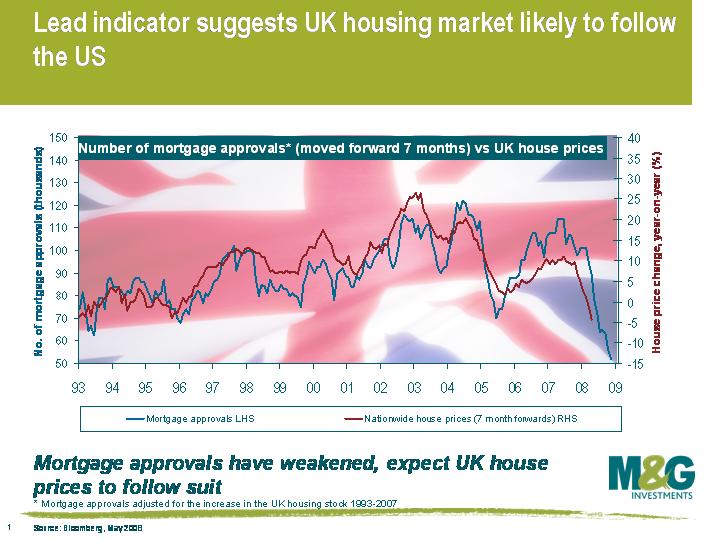
The UK housing market looks like it is rapidly following the path set by the US. Nationwide have UK house prices falling by 4.4% in the year to the end of May, while HBOS today reported that house prices are down 3.8% over the same period. Taking the last three months of the Nationwide index and annualising it shows that UK house prices are dropping at an annual rate of 17.0%. HBOS’s index has registered monthly falls of -2.5% in March, -1.5% in April and -2.4% in May, which equates to an annualised rate of -25.1%. And unfortunately, UK house prices are set to fall a lot further. We’ve charted the progress of mortgage approvals over the past 18 months (see here for Richard’s comment at the end of April), and as you can see from our updated chart, our adjusted mortgage approvals number is predicting a year on year house price decline of 15% by the end of 2008.
The central banks’ inflationary concerns are preventing interest rates from coming down as fast as they otherwise would do. This, combined with banks’ unwillingness to lend, means that demand for houses continues to wane, and a rebound in house prices is exceptionally unlikely in the foreseeable future. A collapsing housing market will inevitably have a severe knock on effect for the wider economy.
The value of investments will fluctuate, which will cause prices to fall as well as rise and you may not get back the original amount you invested. Past performance is not a guide to future performance.


18 years of comment
Discover historical blogs from our extensive archive with our Blast from the past feature. View the most popular blogs posted this month - 5, 10 or 15 years ago!


Bond Vigilantes
Get Bond Vigilantes updates straight to your inbox


