


The best and worst performing fixed income asset classes of 2015
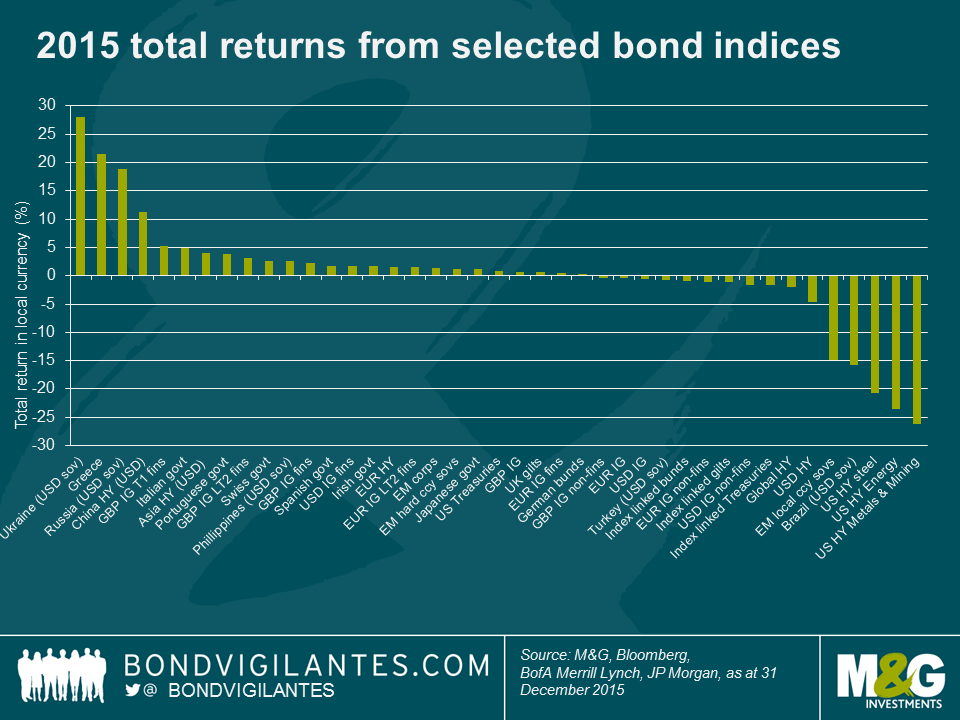
Looking back over the past year it’s evident that decent returns were much more difficult to achieve than in 2014. Within my sample of 85 different Bank of America Merrill Lynch bond indices (and as you can see from the smaller sample in the chart below) most indices fell within the -5% to 5% total return range for 2015, whereas most fell within the 5% to 15% range in 2014.
In 2014 though, most fixed income asset classes were well supported by a relentless rally in government bond yields that saw 10y Treasury and gilt yields fall from 3% to 2.2% and 1.8% respectively, and 10y bund yields drop from 1.9% to a record low at the time of 0.5%. That supportive backdrop wasn’t really there in 2015, but it was actually far from a nasty bear market in core government bonds. Low inflation, bouts of risk aversion and still plentiful central bank liquidity gave government bonds a lifeline, as the Fed waited until the last possible moment to raise interest rates and the ECB announced large scale government bond buying. That didn’t prevent volatility though, and arguably added to it, as 10y bund yields reached an intra-day low of just 0.05% a month or so after the ECB began its public sector purchase programme in March, but then rose to 0.98% less than eight weeks later, leaving investors that bought at the lows in yield nursing some nasty losses.
By year end, 10y government bond yields were around 10bps higher in the US and Germany at 2.27% and 0.63% respectively and 20bps higher in the UK at 1.96%. In contrast, 10y JGB yields finished the year 6bps lower at just 0.26%.
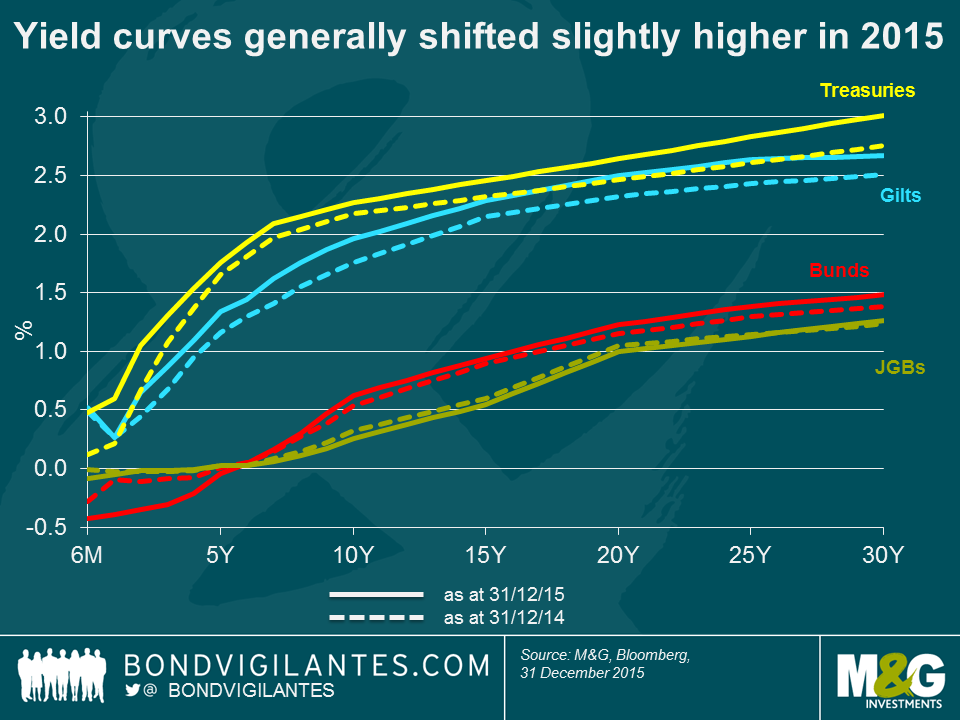
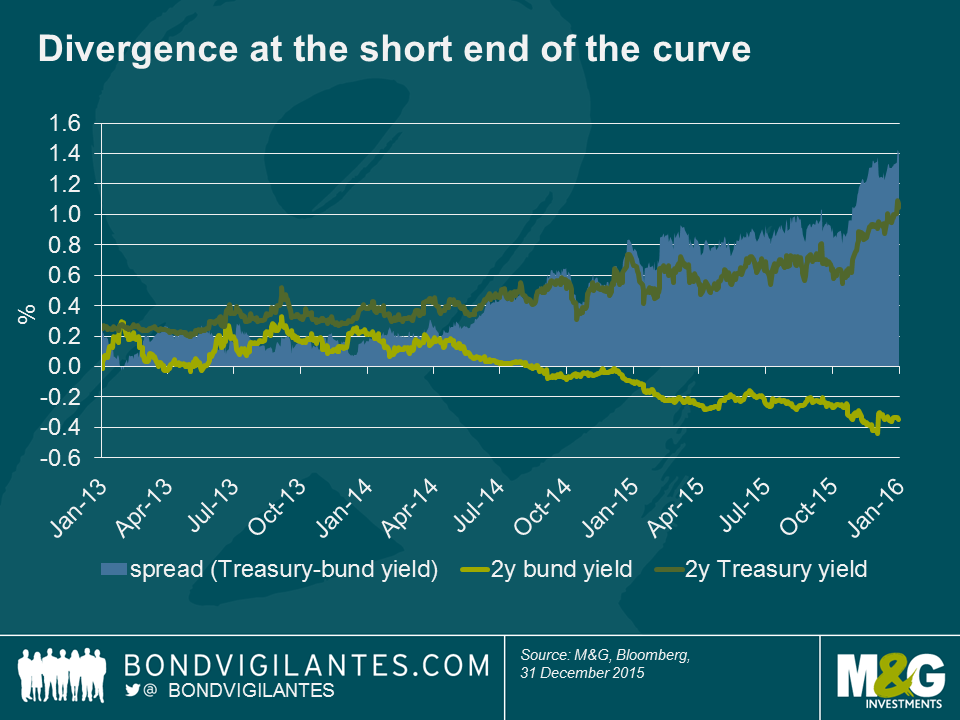
Whilst core government bond yields generally shifted higher across the curve as seen in the chart above, divergence in the monetary policy outlooks of the US and Eurozone led to some stark differences at the short end. For example, 2y yields in the US had been trending higher since the ‘taper tantrum’ in 2013 and this accelerated in 2015 as the likelihood of a hike in US short rates became greater. Two year bund yields were already negative at the start of 2015, but as the market priced in further easing and more was announced, yields continued to fall further into negative territory. This meant the spread between 2y bunds and 2y Treasuries widened to around 140bps by the end of the year, which was the widest since the middle of 2006.
These relatively small moves higher in most government bond yields translated into positive total returns as modest price falls were more than compensated for by interest income. The bund market as whole returned +0.3%, gilts gained +0.6%, Treasuries +0.8% and JGBs returned a very respectable (compared to many other asset classes) +1.2%.
Staying within the developed market government bond space, we saw further spread compression of peripheral European government bond yields vs bunds. For example 10y Italian government bond yields tightened by around 40bps vs 10y bunds, ending the year 30bps lower at 1.6%, securing BTPs a place near the top of the 2015 rankings with a total return of 4.8%. Portuguese government bonds were not too far behind with a 3.9% return. Spanish and Irish governments also posted better than average returns of 1.7% each. Of the peripheral European government bond markets, Greece was far and away the best performer and one of the best performing of all fixed income markets in 2015 with returns of 21.5%, although it was a bumpy ride with the average price of Greek debt falling from 58 at the start of the year, to the 30s in the summer, before rallying to 67 by year end.
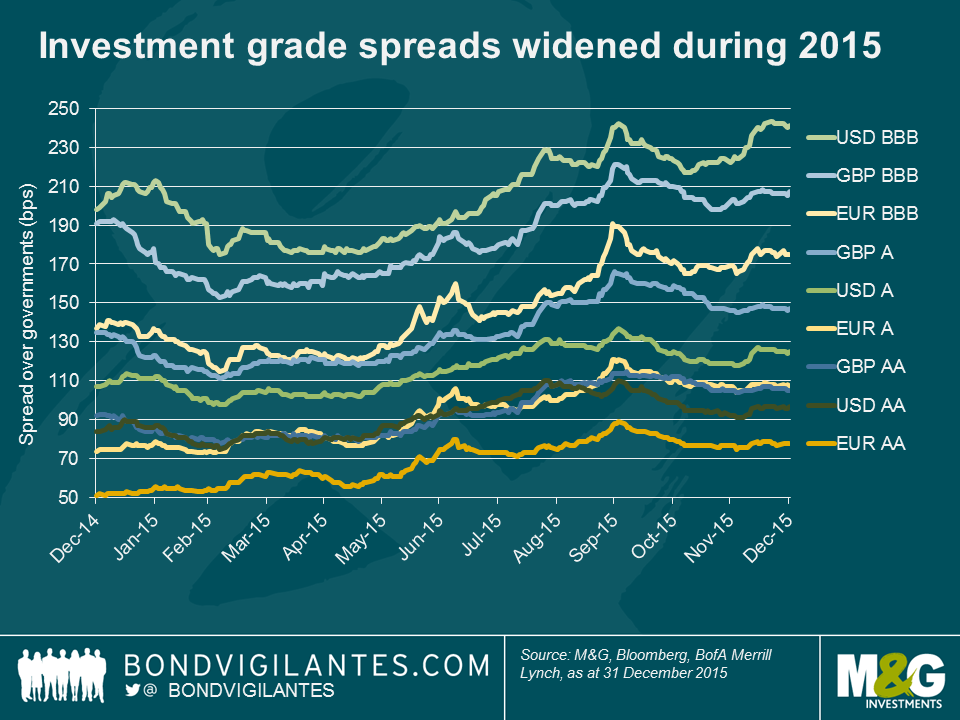
2015 saw credit spread widening across most markets despite European assets getting support from the ECB and despite a backdrop of a reasonably healthy domestic economy for US assets. The moves wider were fairly modest in the investment grade space over the year as a whole, but spreads finished some way off their tights reached in the first quarter – USD BBB spreads for example widened 43bps from 198 to 241, but reached a low of 175bps in March. Record issuance volumes in the US as a result of M&A activity and companies trying to get ahead of the Fed and lock in low rates were no doubt responsible for some of the widening. Investment grade bonds as a whole therefore produced pretty disappointing returns with EUR and USD markets making losses for the year of -0.4% and -0.6% respectively, and GBP investment grade faring relatively better at +0.6%. Within this, financials outperformed corporates and subordinated financials outperformed senior debt. Lower Tier 2 IG bonds for example returned 3.1% in the GBP market and 1.6% for EUR bonds. Going further down the capital structure, GBP investment grade Tier 1 banks ranked highly within our sample, returning 5.2%, although it should be noted that the sector is very small, containing only 10 bonds.
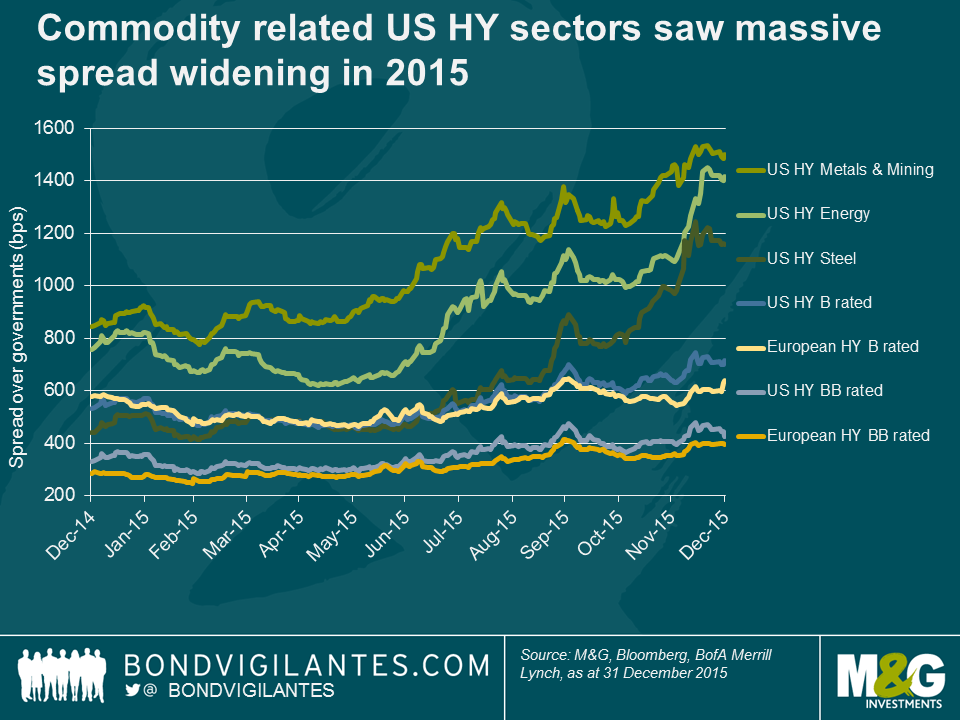
It was in the high yield markets that the full effect of the continued decline in oil and other commodity prices was felt. This had the greatest impact in the US due to the relatively large exposure of the index to energy and metals and mining credits of close to 20% (according to Bank of America Merrill Lynch indices) at the start of 2015. The USD high yield index as a whole was one of the worst performing asset classes, returning -4.6%. Clearly the index level return was dragged down by the steel, energy and metals and mining sectors, which had awful years, returning -20.7%, -23.6%, and -26.2% respectively, and with it earning the dubious honour of being the worst performing fixed income assets of 2015.
Finally, and just as they did last year, EM government bonds occupied the top spot and also came near the bottom of our rankings for 2015. This highlights the idiosyncratic risk in the asset class and that ‘EM’ cannot be lumped together as one entity as so often seems to be the case. For an in depth review of returns across EM fixed income in 2015 and an outlook for 2016, make sure you keep an eye out for Claudia’s blog, which we will publish soon.
The value of investments will fluctuate, which will cause prices to fall as well as rise and you may not get back the original amount you invested. Past performance is not a guide to future performance.
19 years of comment
Discover historical blogs from our extensive archive with our Blast from the past feature. View the most popular blogs posted this month - 5, 10 or 15 years ago!


Bond Vigilantes
Get Bond Vigilantes updates straight to your inbox