


Do carbon emissions matter for green bond valuations?

One of the most powerful tools Public Fixed Income investors have at their disposal to support the transition to a low-carbon economy is project financing via Use-of-Proceed instruments such as green or sustainability bonds. We have written in the past about the stellar growth of the ESG themed bond market over the past few years and we don’t expect this to change considering green funding plans around the world. The US plans to deploy $369bn in tax credits and direct subsidies to catalyse private investments in clean energy, transport and manufacturing on US soil as part of the Inflation Reduction Act, while the EU Commission has drafted its direct response to the US green funding plans via the proposed Green Deal Industrial Plan for Net-Zero age. This comes on top of the EU’s ambitious push towards a more independent and sustainable energy system.
Measured by issuance volume, Green bonds are by far the most popular ESG financing solutions in public debt markets. Green bonds are instruments that channel investors’ capital towards environmentally friendly projects. With real world impact in mind, supporting green bonds of otherwise heavy carbon-emitting issuers will accelerate the decarbonisation process and provide investors with the biggest bang for buck all else equal. In this blog, we take a look at how much bond investors have to pay up (the “Greenium”) for choosing green bonds, and the difference in the Greeniums of heavy emitters vs low emitters.
Calculating the Greenium
In calculating the Greenium, first of all we want to ensure we only look at green bonds that exhibit sufficiently high quality standards. We therefore only consider green bonds that are aligned with the standards of the Climate Bond Initiative or certified as such. This leaves us with slightly north of 300 green bond corporate issuers in the global Investment Grade space. For the purpose of this exercise, we create two tiers based on carbon intensity data to allow for comparison between companies of different sizes. On the one hand we have the high carbon intensive tier of green bond issuers, which features prominently sectors like utilities and automobile manufacturers, while, on the other hand, we find Banks and Technology companies well represented in the low carbon tier bucket.
Next, we analyse whether those selected corporate green bonds trade at a credit spread discount or premium: the Greenium. When trying to evaluate the Greenium, it is important to identify comparable green and non-green bond pairs. We consider matching bond pairs issued by the same issuer in the same currency. Further we screen for bonds with a minimum $300 million equivalent amount outstanding to reduce spread anomalies caused by smaller issues due to illiquidity. In addition, bond characteristics need to match coupon type, payment rank, credit rating and, last but not least, duration differences between the green and non-green bond pair needs to be within one year. Not all green bonds in our sample have a matching non-green pair that complies with our set requirements and we are left with 161 bond pairs in the high carbon emitting tier and 126 bond pairs in the low carbon emission tier.
Greeniums of high vs low carbon emitters
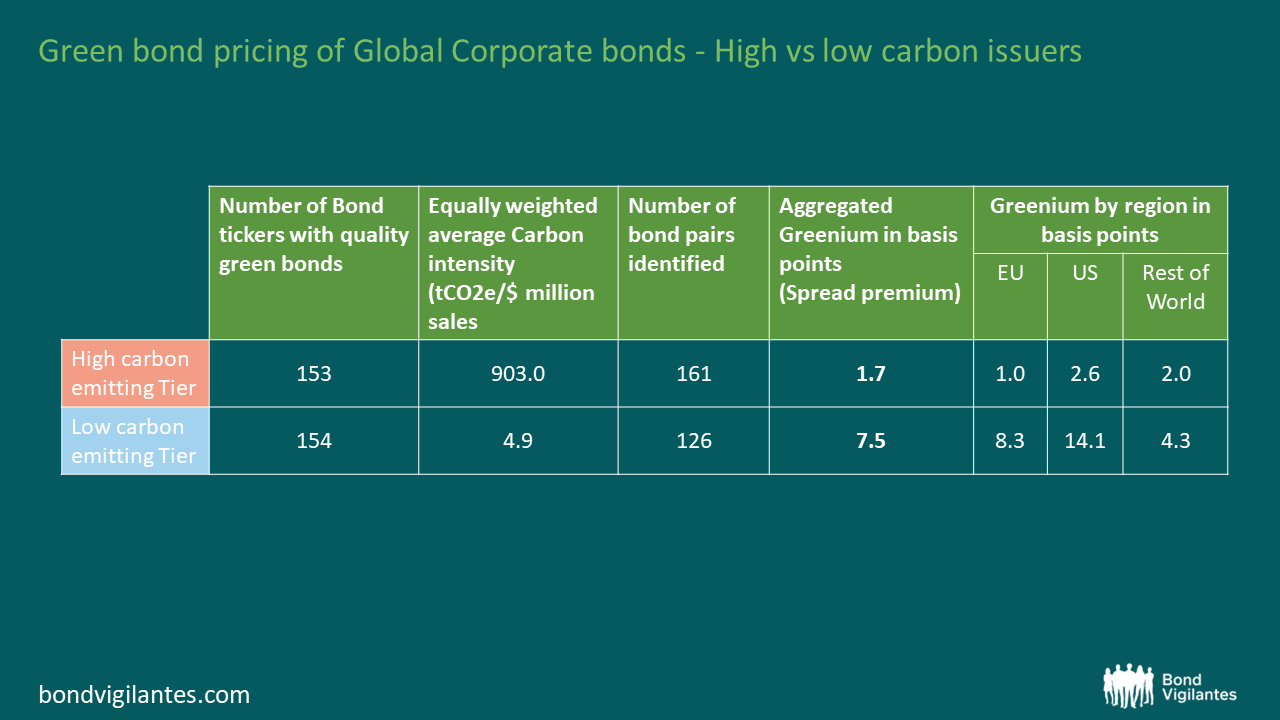
When looking at the aggregated result one might be surprised. Not only is the equally-weighted Greenium of the high emitting tier close to zero with the average credit spread trading only 1.7 basis points richer than the non-green instrument, the Greenium is also lower than the one in the low carbon emission tier at 7.5 basis points. We also observe that the Greenium is slightly more pronounced in the US compared to Europe.
This leads me to two conclusions. Firstly, as I noted in my earlier blog, fixed income markets still struggle to price ESG bond instruments efficiently. Correct pricing of those securities is complicated by the differences in ESG bond framework standards and the required understanding of a company’s wider climate transition credentials. This is shown by the lack of spread premium evidenced for high carbon emitters compared to low carbon issuers, but also by the dispersion of Greenium results on a security level which remains large. Secondly, the result leaves me to believe that currently the Greenium in the space is partially driven by a scarcity premium. We note that Europe is leading the way in terms of ESG bond issuance as % of overall issuance, while other parts of the world offer less green bond choice thereby increasing the willingness of investors to pay up for green deals. The same pattern in regards to scarcity is starting to emerge when looking at a sector or issuer level.

For example, while German utility company ENBW, a regular green bond issuer in the market, sees its green bonds trading at a wider level than comparable General Corporate Purpose bonds, pharmaceutical business Amgen’s only green bond trades at tighter spreads versus its non-green equivalent. While other factors can explain part of the Greenium on an issuer level, such as company specific dynamics or other instrument differences we haven’t adjusted for in our analysis, scarcity of green bond securities seem to play a role. At least it seems to be a bigger factor to explain relative richness or cheapness in credit spreads compared to a company’s carbon footprint – the reduction of which is a key purpose of green bond securities. The silver lining from this analysis is that active bond investors have plenty of opportunities to pick up credible green bond securities from high carbon emitting issuers relatively cheaply as a way of providing capital to companies under the condition that the proceeds are spent only via environmentally friendly projects. In other words, at least for now this allows bond investors to help accelerate the transition to a low-carbon economy at very little extra cost.
The value of investments will fluctuate, which will cause prices to fall as well as rise and you may not get back the original amount you invested. Past performance is not a guide to future performance.

