
The Fed’s easing era

It’s often said that the first cut is the deepest, and that may well be the case for the US Federal Reserve (Fed) delivering a blockbusting 50 basis point (bp) cut. After 918 days, this marks the end of the monetary policy tightening brought in to tame the “transitory” inflation that came to a thunderous crescendo in 2022.
Markets knew a cut was coming; it was just a question of how much. Predictions were evenly split between a 25bp cut and a 50bp cut, with those favouring the latter arguing that weaker data prints needed to be addressed, and that the Fed needed to get ahead of the curve.
There were, of course, those who felt 25bps could be more commensurate with the economic data being rapidly released. The same people also pointed out that a cut of half a percentage point is usually reserved for periods of significant market events or during a recession – neither of which are staring us in the face. In the end, however, there was very little reason to maintain current rates and absolutely no rational argument for an increase.
In this blog, I will highlight what an easing cycle from the Fed might mean for one of the asset classes that stands to benefit the most: emerging market debt (EMD).
The cut to set emerging market debt free
The below is a rather simple, but effective, chart. The grey bars illustrate the gap between the Fed’s first cut and their next hike. The green line tracks the return of the hard currency sovereign index. What we can clearly see is that the Fed’s cutting cycle serves as a strong tailwind for riskier market segments like EMD.
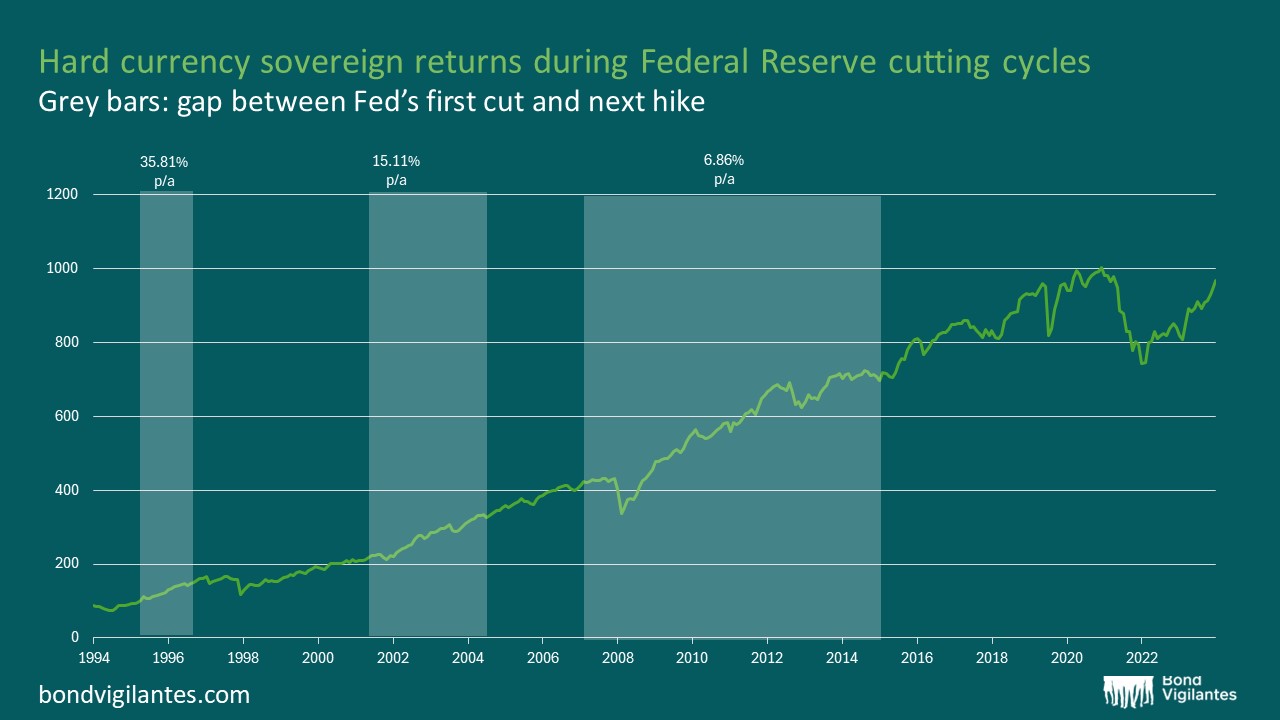
There are, of course, other parts of EMD that aren’t captured in this chart, such as hard currency corporates and local currency sovereigns, as their respective track records aren’t as extensive. However, we do observe the same pattern: US rates falling is good news across the board for EMD.
That isn’t to say that each of these asset classes moves in step with one another. We would expect local currency sovereign bonds to perform the strongest initially in such a scenario, and we’ve already had a taste of this in recent months, where they have been the biggest beneficiaries, in performance terms, of markets becoming more comfortable with the direction of travel from the Fed.
A driver of this is that local currency bond returns benefit from both interest rate and currency movements. When the Fed starts cutting rates, emerging markets often follow suit, and lower US rates usually weaken the dollar against certain emerging market currencies.
There are other factors at play, of course, with bonds very rarely offering an explanation that comes solely at face value. Lower borrowing costs and the lower yields of developed markets that accompany lower policy rates should encourage investors to return to an asset class that has borne the brunt of a higher rate environment.
There are, of course, still potential obstacles to manage. For EMD to rally, and continue on a positive trajectory, we would need a version of the US soft landing that markets have been talking about for the past couple of years. To be bullish on any risky asset class, this scenario would need to play out, and there is plenty of evidence to support this. The loosening of financial conditions will be a material factor in avoiding a more serious downturn.
Muddying the waters is the US election taking place in November, with the potential for a Trump victory set to weigh on sentiment until the result is announced. While polls are steering towards a Democratic victory, we have seen before (2016, anyone?) how materially wrong they can be.
A Harris victory would be, arguably, less inflationary which, of course, supports easing monetary policy. Alongside a Fed now in the throes of engineering a soft landing, this would be even more supportive of the asset class.
What can be expected moving forward?
As already alluded to, EMD tends to ebb and flow in tandem with the health of the US economy and the current environment. With rates now falling, questions arise about what we should expect over the next few years. The below chart suggests that one thing we can certainly count on is uncertainty.
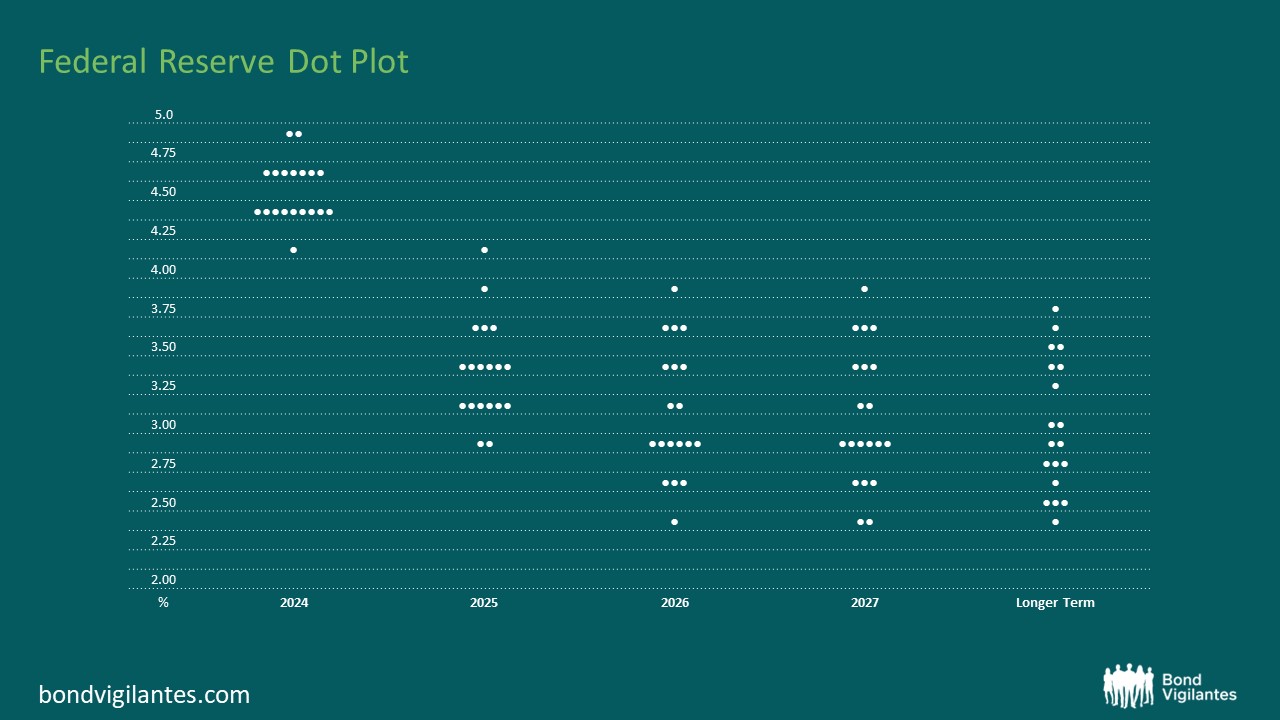
The dot plot itself highlights where 16 Fed officials see policy rates going over the next few years. A very simple but accurate takeaway from the chart above is that the group is certainly mixed. In 2026, one member expects rates to be 2.375%, while another expects 3.875%. Over the “longer-term”, we can see that there are 11 entirely different predictions.
However, despite policymakers and markets more broadly being mixed in their expectations, the direction of travel now seems not open for debate, which only strengthens the argument highlighted here.
The value of investments will fluctuate, which will cause prices to fall as well as rise and you may not get back the original amount you invested. Past performance is not a guide to future performance.

