


Return to Rolldown – what does a short dated crossover strategy look like in practice?

Earlier this year I posted a couple of blogs exploring the mechanics of rolling down yield and credit curves. The conclusion in both blogs was essentially that investing at the short end (generally the steepest part) of the yield curve offers the best risk-adjusted return. Further, in credit the sweet spot looks to be at the lower end of the investment grade universe (BBBs) and the higher quality part of the HY market (BBs). This is all very well in theory, but what about in practice?
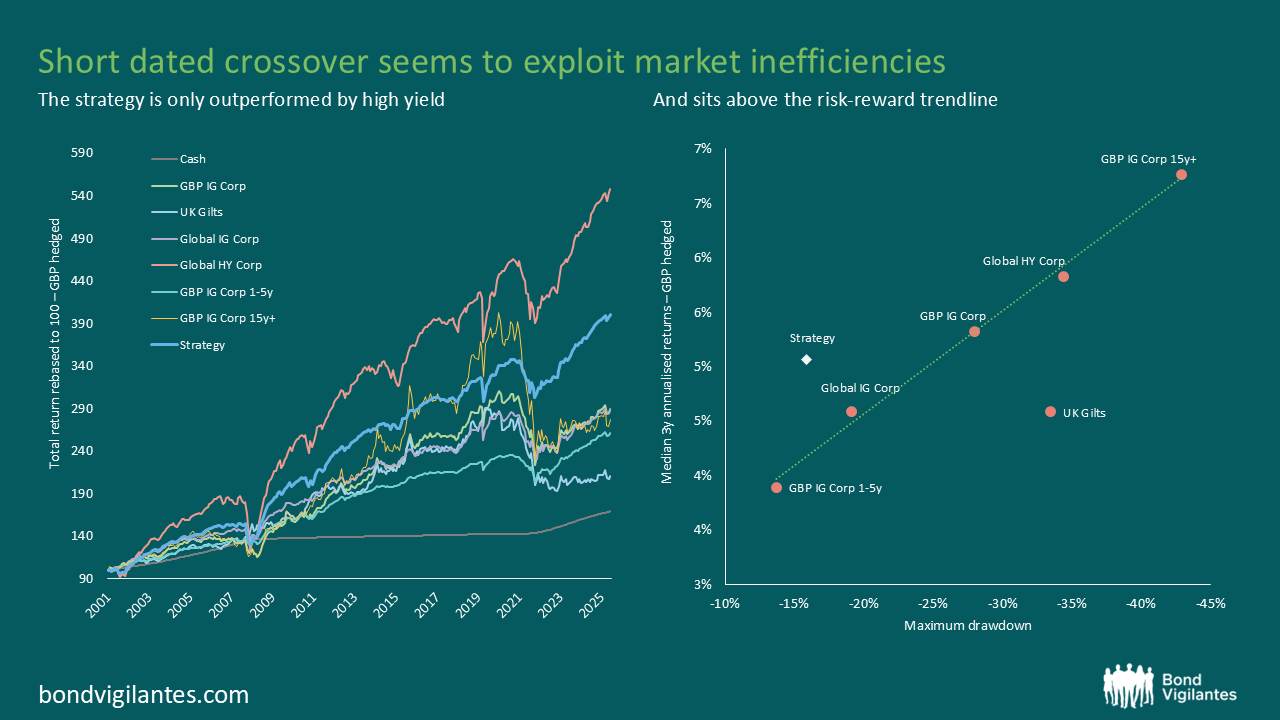
Our back testing suggests that such a strategy would have delivered strong performance, attractive risk adjusted returns, and comparatively lower volatility and drawdowns than other fixed income asset classes. Using 20+ years of index data we created a short dated 50% short dated BBBs/50% BB index and generated these results:
Source: M&G, Bloomberg, 31 May 2026. Index Ref. (G0L0, UR00, UR0V, UR08, LGCPTRGH, H23059GB. Indices are hedged back to GBP).
Strategy illustration constructed from ICE BofA indices (Ref. 16.66% UR4V, 16.67% ER4V, 16.67% CVA4, 25% H0A1, 25% HE10. Indices are hedged back to GBP)
Pretty compelling stuff; I’m sure you’ll agree. This part of the curve offers a decent level of income, whilst benefitting from the rolldown effect that we have discussed previously. Another reason that this strategy seems to perform well is the inefficiencies in the market in the crossover space between BBB and BB. We draw this arbitrary line in fixed income at the IG/HY border, creating two distinct pools of investors. This creates an opportunity for outperformance in the space for a strategy spanning the two asset classes.
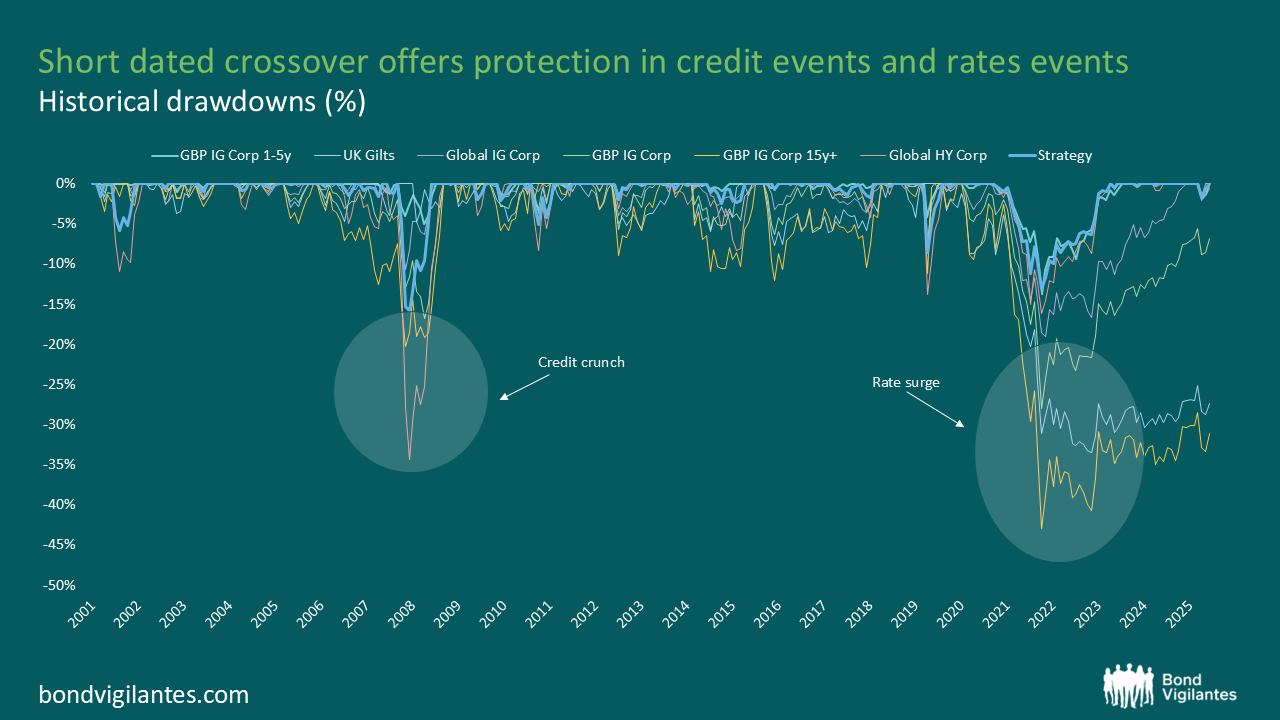
The maximum (17%) drawdown the strategy would have suffered was during the global financial crisis, driven by the huge sell off in credit spreads. Putting that into some context; other than in 2008, the relatively lower drawdowns over time are, I think, another compelling reason to look more closely at this area of the bond market.
Source: M&G, Bloomberg, 31 May 2026. Index Ref. (G0L0, UR00, UR0V, UR08, LGCPTRGH, H23059GB. Indices are hedged back to GBP).
Strategy illustration constructed from ICE BofA indices (Ref. 16.66% UR4V, 16.67% ER4V, 16.67% CVA4, 25% H0A1, 25% HE10. Indices are hedged back to GBP)
How does the crossover strategy achieve this?
Sceptics (including us!) will look for the hidden risks that could explain this outperformance.
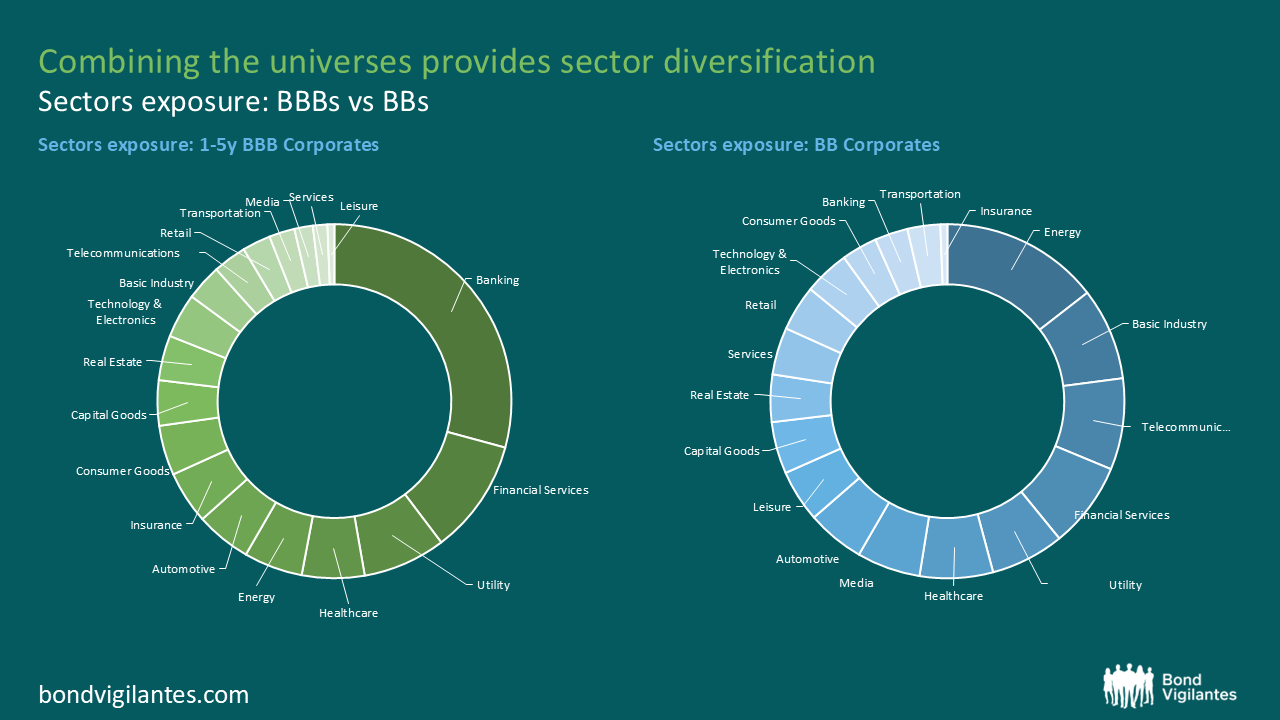
Sector/name concentration risk? No. In fact, combining short dated BBB and BB indices actually broadens the opportunity set and increases diversification. BBB and BB markets tend to have very different sector concentrations. Short dated investment grade has a lot of financials, whereas high yield tends to have a lot of utilities and telecommunications names. Bringing the two together reduces reliance on individual sectors or issuers and creates a more diversified opportunity set.
Source: M&G, Bloomberg, 31 May 2026
Downgrade risk? Unlikely. One might assume that bonds falling out of the IG universe and into HY would cause those bonds to underperform once the credit rating agencies downgrade them. This may be true in the very short term, but there is plenty of research out there showing that over the longer term ‘fallen angels’ outperform both IG & HY.
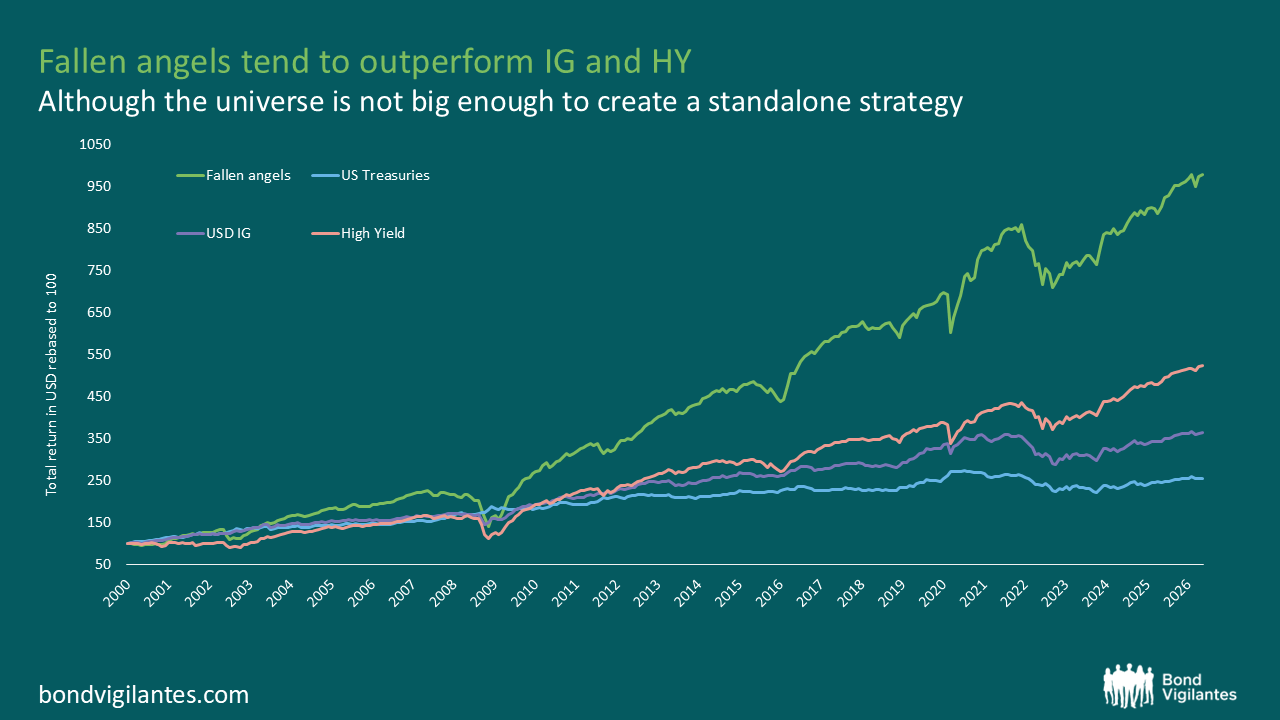
Source: M&G, Bloomberg, 31 May 2026. Index Ref. (H0FA, C0A0, H0A0, G0Q0).
I think the ultimate answer to the outperformance is fairly straightforward; BBB and BB bonds offer an attractive level of income, while avoiding both the longer-duration exposure often associated with traditional IG portfolios and the lower-quality credit risk found deeper in HY. History shows why this matters. As illustrated previously in the drawdown chart, excessive credit risk can be particularly painful in periods such as 2008, while excessive duration risk can materially impair returns when rates rise, as seen in 2022.
Using quantitative techniques to find an area of the bond markets that offers excess returns is pleasing enough. Discovering that those insights are borne out by historic data feels as though we’ve unearthed some buried treasure. It will certainly be an area of the market I’ll be looking at to add some sparkle to my portfolios in future.
The value of investments will fluctuate, which will cause prices to fall as well as rise and you may not get back the original amount you invested. Past performance is not a guide to future performance.