






Repaired, Rerated, Repriced? Two out of three for European banks


For those who follow bank returns for a living, Japan’s push toward low-to-mid-teen RoE/RoTE (return on equity/return on tangible equity) over the medium term is one of the most striking re-ratings in the sector – a genuine regime change against the mid-to-high single digits of the past few decades. The mechanism is familiar: normalising rates lift returns, as European banks have demonstrated since 2022. What lingers is the memory. Our question here is whether the market still charges European banks for the twin scars of the GFC and the Eurozone crisis. Fundamentals have improved across the board, yet pricing has only lately begun to give credit where it is due, and we think there is more to come. In this note we compare the volatility of senior bank spreads with senior non-financial spreads, and find that risk-off episodes, historically far harsher on banks, are starting to reward them with a lower beta.
1. European bank fundamentals – A decade later, a world of difference
The European bank story of the past fifteen years is not simply one of higher returns — it is one of better returns: more of them, more consistently, and with far less dispersion across the sector. Crucially, this was earned while balance sheets were being rebuilt, with more and better quality capital, and reduced legacy non-performing loans. Micro- and macroprudential reform reshaped underwriting standards along the way, which should leave the sector far better placed to absorb the next credit cycle. Directionally, none of this ought to be controversial; the scale of the change, however, can still surprise even seasoned sector watchers.
The four exhibits below trade that arc from four angles – profitability levels, the frequency of downside, the breadth of the turnaround, and finally the rating agencies’ validation of it. Together they describe a sector that has moved from bimodal and fragile to durable and increasingly homogenous.
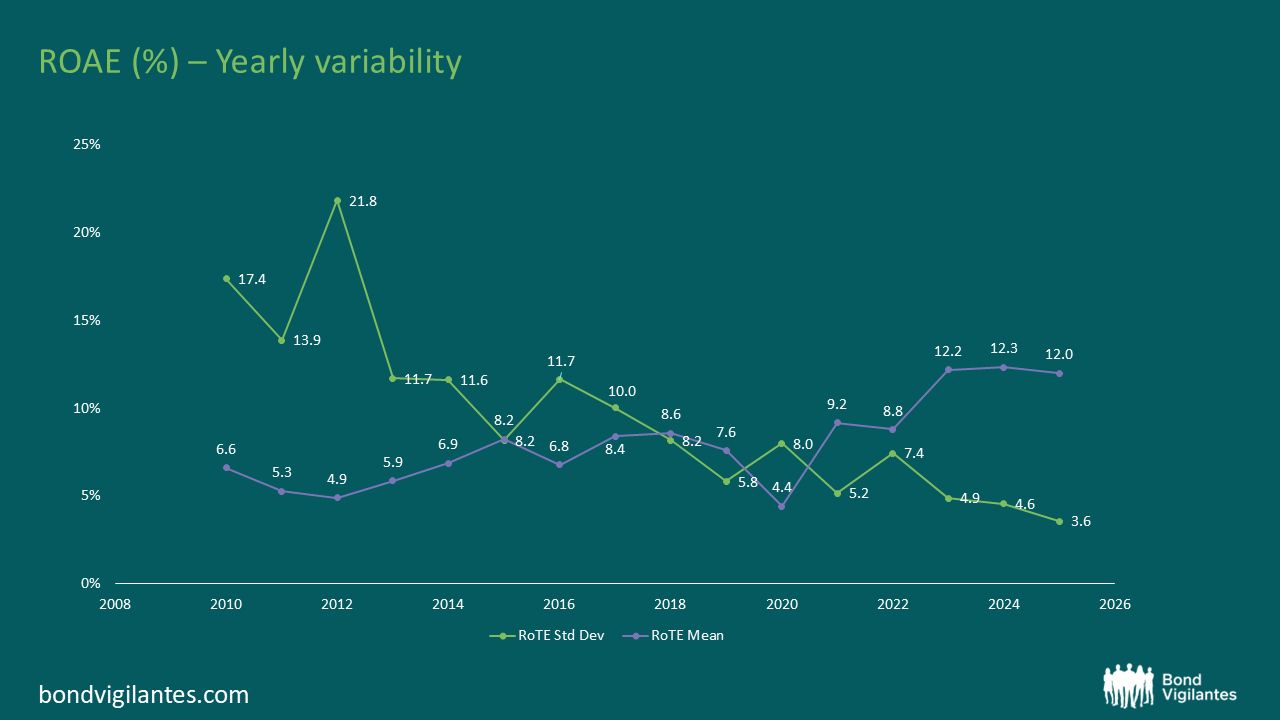
Two things happened to bank profitability at once, and they matter far more together than apart. Exhibit 1 shows mean RoTE for our European bank sample climbing out of the mid-single digits that defined the post-crisis years into a settled low-double-digits. Three years at roughly the same level is what makes this a regime change rather than a rate-driven spike.
The more telling line is the one most readers of the chart skip. The cross-sectional standard deviation of returns, which shows how different the returns are between each bank, has collapsed from a peak of 21.8 in 2012, to just 3.6 in 2025. The sector is no longer being carried by a handful of star performers masking a long tail of strugglers; the distribution itself has tightened around a higher mean. For a credit investor that combination — higher average return, lower dispersion — is worth considerably more than the headline RoTE, because it speaks directly to the resilience of the weakest names in the index.
Exhibit 1: RoTE – Increased returns, with decreasing volatility
Source: S&P Capital IQ
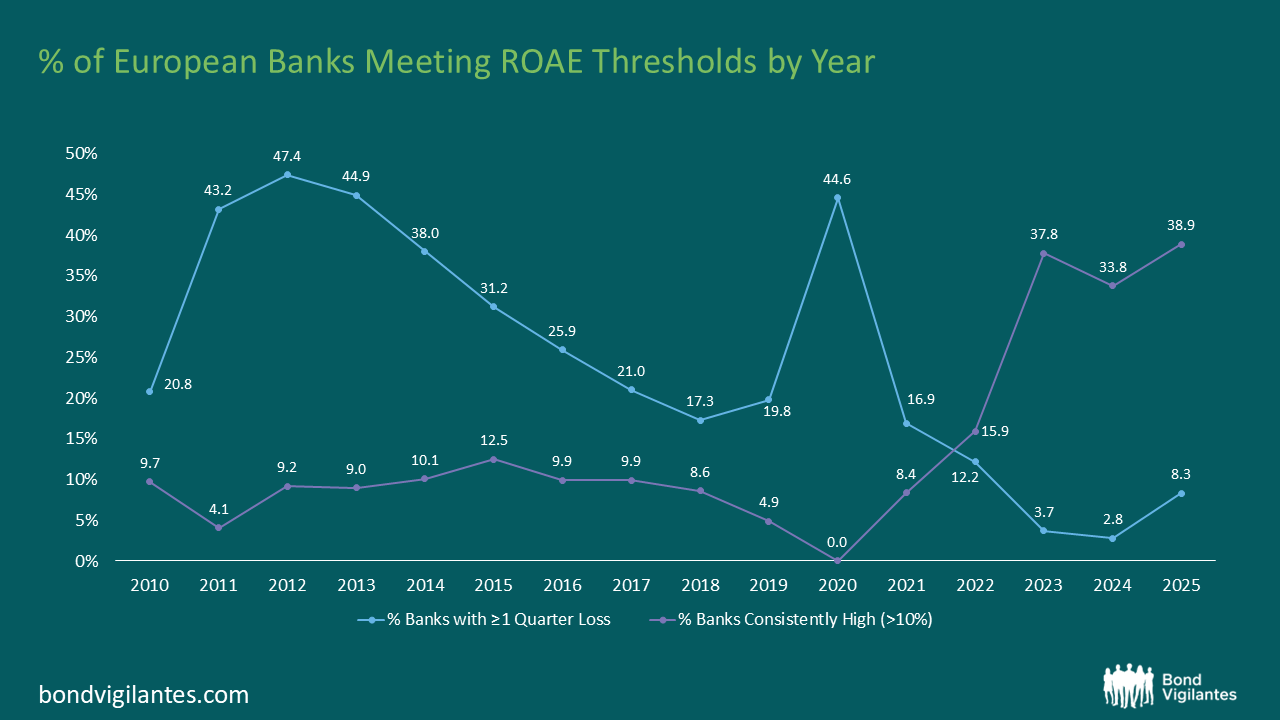
If Exhibit 1 shows the average improving, Exhibit 2 shows the tails doing the heavy lifting. The share of banks posting at least one quarterly loss peaked at 47.4% in 2012, close to a coin toss as to whether any given bank lost money in a given quarter, now levels sit close to 8%. What was once a sector-wide condition is now a rare and largely idiosyncratic event.
The mirror image is just as striking. The proportion of banks consistently earning above a 10% return sat below 10% for most of the last decade before jumping to 38.9% in 2025. Roughly four in ten European banks now clear a double-digit hurdle, against almost none in 2020, and the three-year plateau suggests a level the sector can hold rather than a single good year. Double-digit returns as the new normal is not a rhetorical flourish — it is where the distribution has physically moved.
Exhibit 2: Banks with a loss drastically down; double digit returns almost “the new normal”
Source: S&P Capital IQ
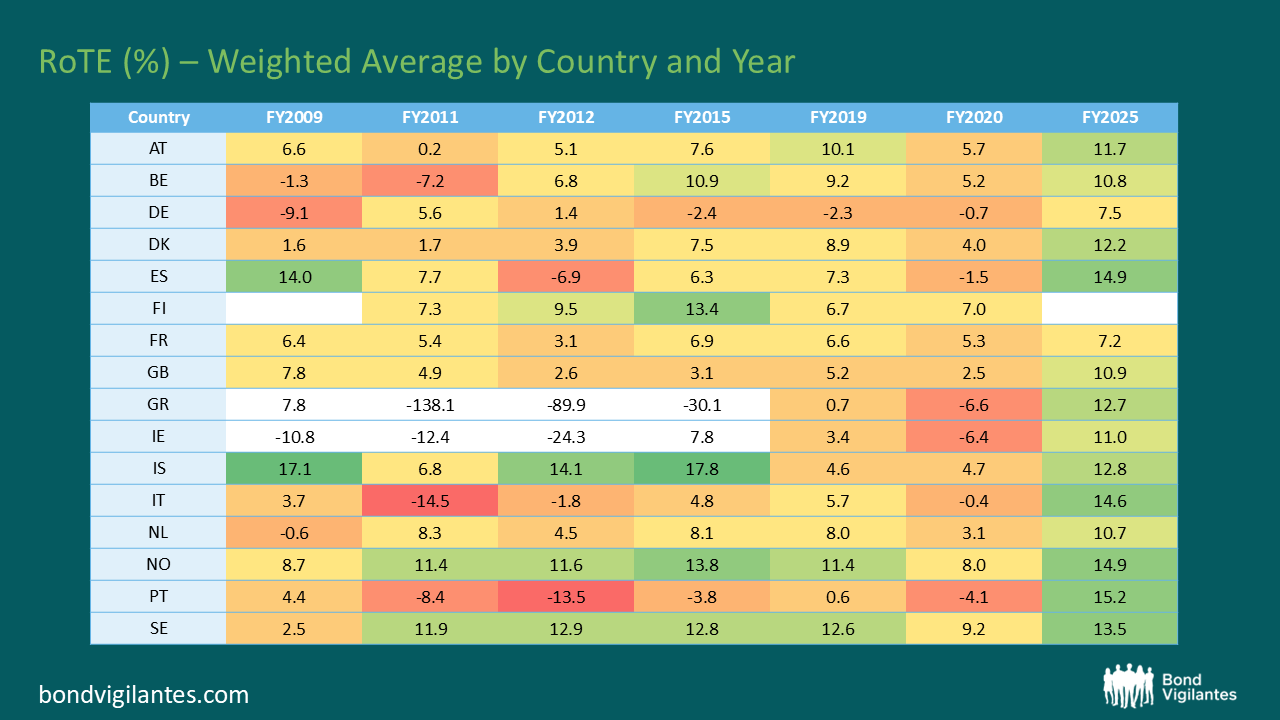
Averages and tails can both improve and still leave the most important question unanswered: is this a genuine sector turnaround, or a handful of national champions flattering the aggregate? Exhibit 3 settles it. The profitability recovery shows up across the great majority of individual countries, not merely at the sector level — the improvement is broad-based rather than concentrated. That distinction carries the argument that follows. A recovery driven by a few large issuers would leave plenty of reason to keep charging banks a premium; one visible across national banking systems is precisely the kind of improvement that should, in time, compress the risk premium attached to bank credit.
Exhibit 3: Consistent turnaround in profitability across European banks
Source: S&P Capital IQ
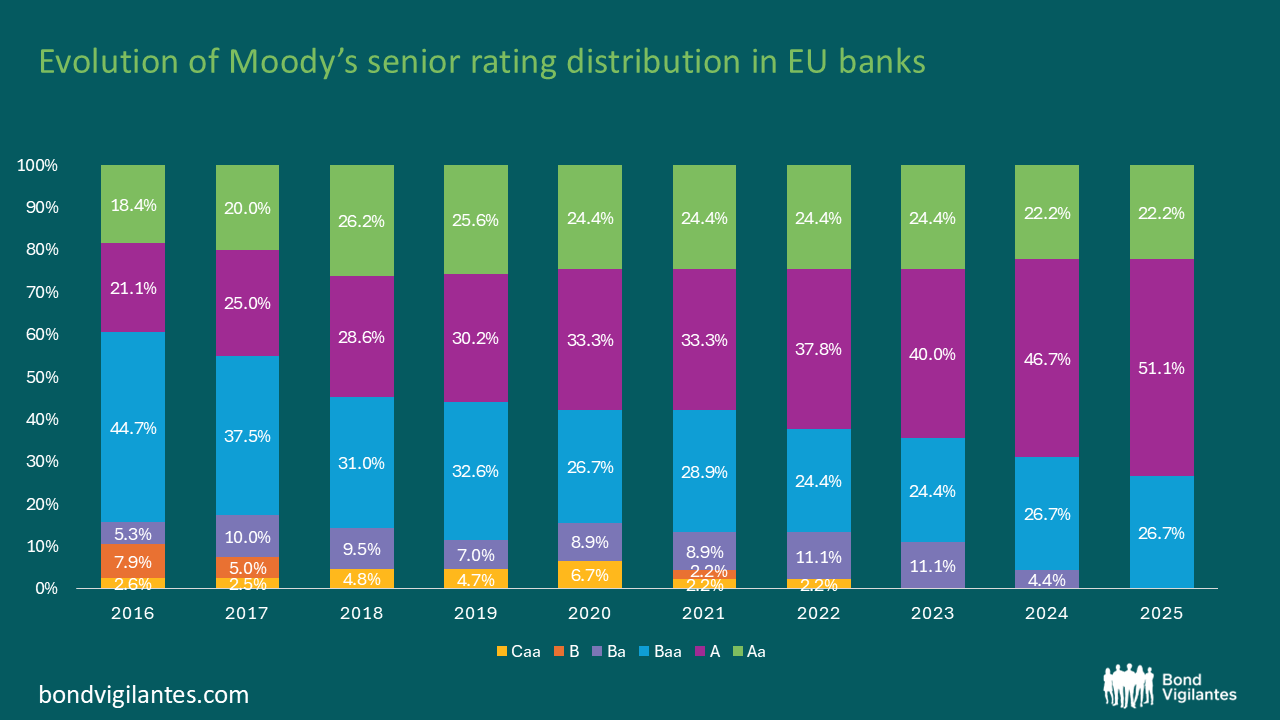
The rating agencies have now ratified what the fundamentals had already established. Across European bank senior debt, ratings have been steadily improving. Most have now migrated out of the lower rated buckets into A categories, with the ratings converging across the board.
Exhibit 4: Moody’s ratings: Positive rating migration reflects improving fundamentals (EU Banks’ senior ratings)
Source: Moody’s
Four lenses, one conclusion: European banks earn more, lose less, do so far more uniformly, and now carry the ratings to prove it. Which leaves the question that matters for a bond investor — whether the price of bank credit has kept pace with the quality of it. That is where we turn next.
2. Bank bond pricing still reflects a risk premium vs non-financials, though this is declining
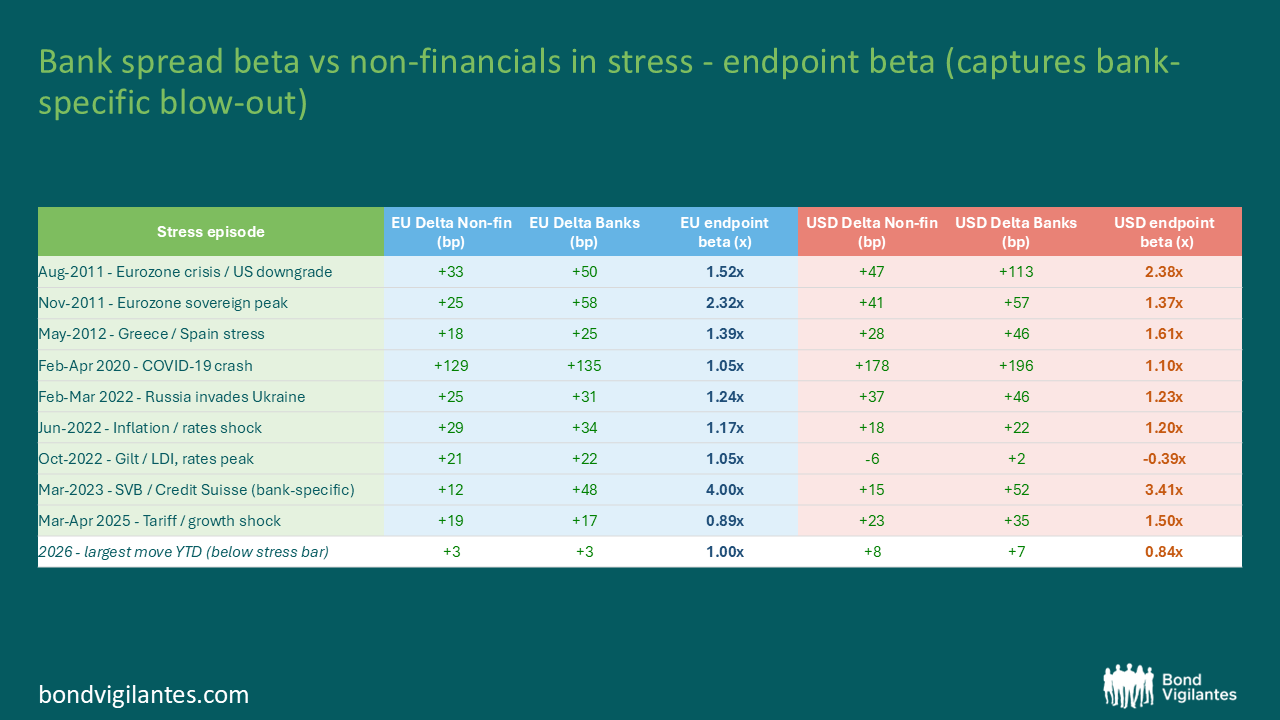
Fundamentals are only part of the trade; the other part is what you pay for them. Had the market fully re-rated European banks in line with their improved fundamentals, bank spreads would behave much like those of comparably rated non-financials — and nowhere more visibly than in stress, when risk premia are laid bare. They do not, quite. But the gap is closing, and that is the more interesting finding. To measure it, we compare how far bank spreads move against non-financial spreads across historical risk-off episodes, effectively using an endpoint beta that deliberately captures the full bank-specific blow-out at its widest point.
Source: iBoxx and Bloomberg
The table sets out, for each major risk-off episode since 2011, the peak move in bank spreads divided by the peak move in non-financial spreads — an endpoint beta. A reading of 1.0x would say bank credit is no more volatile than corporate credit under stress; anything above that is the premium the market still demands for owning banks. The headline result is that banks amplify, consistently. In EUR the beta sits above 1x in every meaningful episode, peaking in the March 2023 Credit Suisse shock, and USD betas are higher still.
The trajectory is where the argument is won. The largest betas cluster in the bank-centric crises — the 2011–12 Eurozone sovereign episode and Credit Suisse in 2023 — while the most recent, non-bank-driven shocks compress back toward 1x, including the 2025 tariff and growth scare and the malaise of 2026. Put plainly: banks still gap wider than non-financials when the market believes the sector is at the epicentre of the stress, but away from bank-specific events that excess sensitivity is fading. This is the declining risk premium, expressed in beta rather than in level — and beta is the harder test, because it strips out the direction of the market and asks only how much extra the market charges banks when it turns.
The picture is of a market coming round in stages: fundamentals repaired years ago, ratings caught up more recently, and spread behaviour only now beginning to normalise. Each step has lagged the one before it, and the last is the least complete. If beta continues to drift toward 1x outside genuine bank crises, the residual premium is an opportunity rather than a warning — compensation for a risk the sector has already largely engineered away. We think there is more to come.
The value of investments will fluctuate, which will cause prices to fall as well as rise and you may not get back the original amount you invested. Past performance is not a guide to future performance.