
The Rise of Emerging Market Corporate Bonds
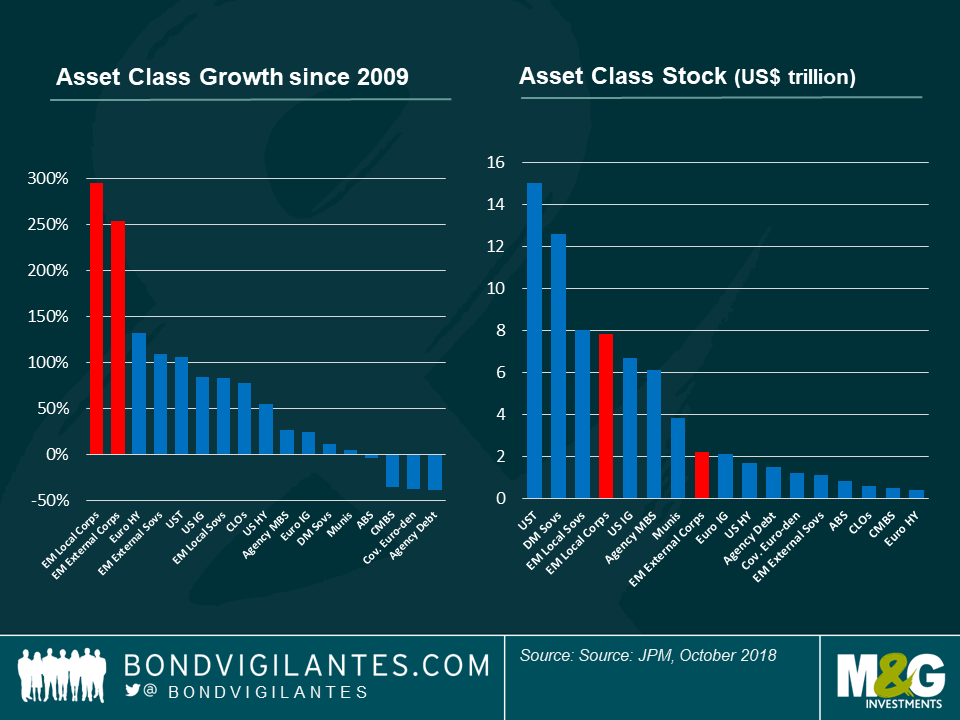
Few investors would have bet on emerging market (“EM”) corporate bonds fifteen years ago. In 2004 the EM external (also known as hard-currency) corporate bond universe was relatively small at approximately US$ 270bn. By 2009 the asset class had more than doubled to US$ 600bn driven by strong economic expansion across developing economies notably the BRIC countries. Since the global financial crisis, emerging market corporate bonds have experienced the strongest growth across fixed income markets (Figure 1.) with the size of the external EM corporate bond universe increasing to US$ 2.2 trillion by the end of last year.
The rise of EM corporate bonds has resulted in it becoming a standalone asset class (Figure 2.) and therefore a new area of focus for global credit investors. For instance, EM high-yield bonds now account for 23% of global high yield investment opportunities compared to just 8% in 2009; I’m confident that the share of EM in global indices is going to continue to increase over the medium term. The much larger EM corporate bond universe in local currency has also posted impressive growth (+300% since 2009) and is approaching US$ 8 trillion in size, comparable to the EM local sovereign bonds and larger than the US investment grade market. Yet, the “investable” part of this market remains small for global investors.
This outlook explores the three segments that are worth watching over the next few years: the mature EM external corporate bond universe, its fast-growing high yield segment, and the enormous but illiquid EM local corporate bond market.
Figure 1 (left). Figure 2 (right).
Emerging Market External Corporate Bonds: The Established Market.
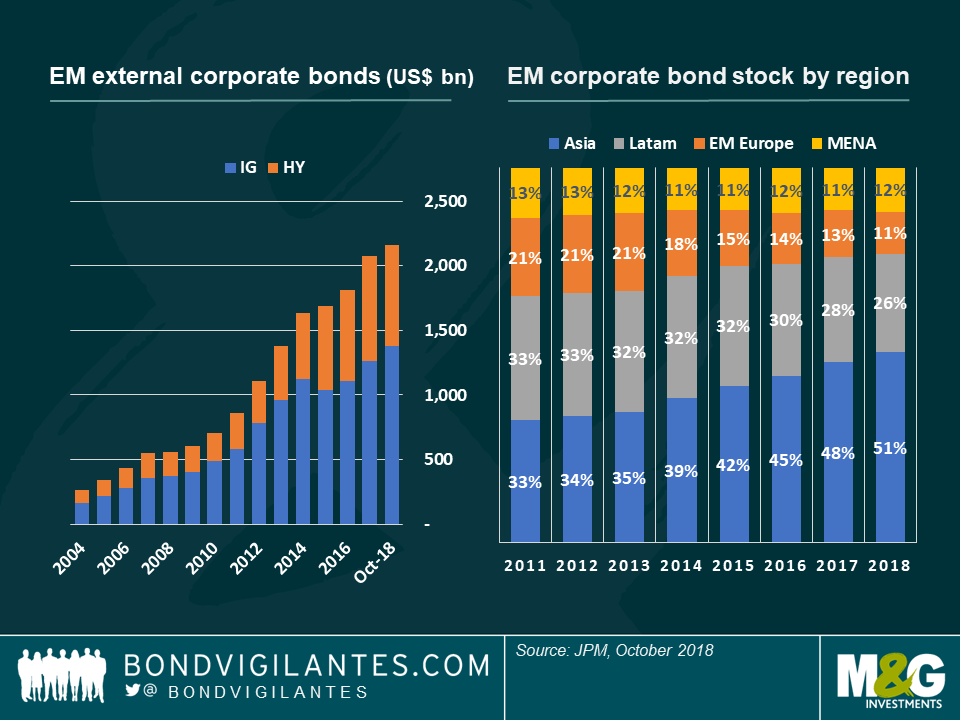
The impressive growth of US dollar denominated EM corporate bonds in the past decade (Figure 3.) has been a long time coming, especially given the small size of EM fixed income markets compared to their contribution to world GDP (over 50%). Issuance in US dollar, and other hard currencies, was the result of three distinct factors. Firstly, some EM issuers operate in “dollarized” sectors (e.g. commodities) or countries with pegged currencies, like UAE, hence naturally preferring to borrow in a currency that doesn’t create an FX mismatch on their balance sheet. Secondly, funding needs for investment increased in line with EM economic expansion but local debt markets (bank loans and bond market in local currency) lacked depth. Long-term and sizeable debt financing for large corporates – such as utilities – in general were not available locally. EM issuers therefore started to look at international bond markets. Thirdly, market technicals improved as demand from global bond investors emerged, in addition to dedicated EMD managers, due to diversification benefits after the global financial crisis hit many portfolios.
Figure 3. (left) / Figure 4. (right)
From a credit standpoint, bond stock growth has been driven by investment grade (IG) and high yield (HY) issuances equally. Nevertheless, the split still favours IG credits. As of January 2019 HY credit represented 36% of the bond stock (43% for JP Morgan’s CEMBI BD index). Quasi-sovereign issuers account for approximately half of the universe and are now worth just above US$ 1 trillion – a similar size to EM sovereign bonds in hard currency. For more information on Quasi-Sovereign bonds you can read this blog: https://bondvigilantes.com/blog/panoramic-outlook/quasi-sovereigns-in-emerging-markets/
One remarkable trend in the asset class has been the material increase in Asian bonds as a share of the universe (Figure 4.) driven by enormous issuance from China in the past 10 years. Excluding Asia the asset class shows more modest growth since 2011 (+83%) and is only marginally up from 2014 (+6%). Asia external corporate, including quasi, bonds were worth US$ 1.1 trillion at year-end 2018 – which is bigger than the whole EM external sovereign bond universe – and 51% of the total EM external corporate bond asset class. This is in strong contrast with Asia being only a small share of EM external sovereign bond stock. With its US$ 650 billion external corporate bond market China represents 30% of the asset class (although capped at 8.1% in the CEMBI BD index) and is the largest economy among the 50 countries in the EM index. Mexico (8.8% of total bond stock), Brazil, Korea, Russia, Hong Kong, UAE and India are also large country contributors. Thanks to these diverse geographies only net negative supply from China would alter the size of the asset class.
In terms of sectors, as measured by the CEMBI BD index – Figure 5., the impressive growth of Asia has had little impact on the diversity of the asset class. Financials remain one-third of the index and unlike developed market financials are less exposed to contagion risk (e.g. Colombian banks are unlikely to be impacted by a banking crisis in Indonesia) although China’s financial institutions are systemically important for Asia. Commodities account for about 20% (Oil & Gas 14%, Metals & Mining 7%), usually smaller than what most investors would expect from an EM debtor. TMT and Utilities are also large sectors and in line with the economic expansion, the Consumer sector (9%) has been growing at a faster pace than Industrial sectors.
Figure 5. (left) Sectors / Figure 6. (right) Returns vs Vol
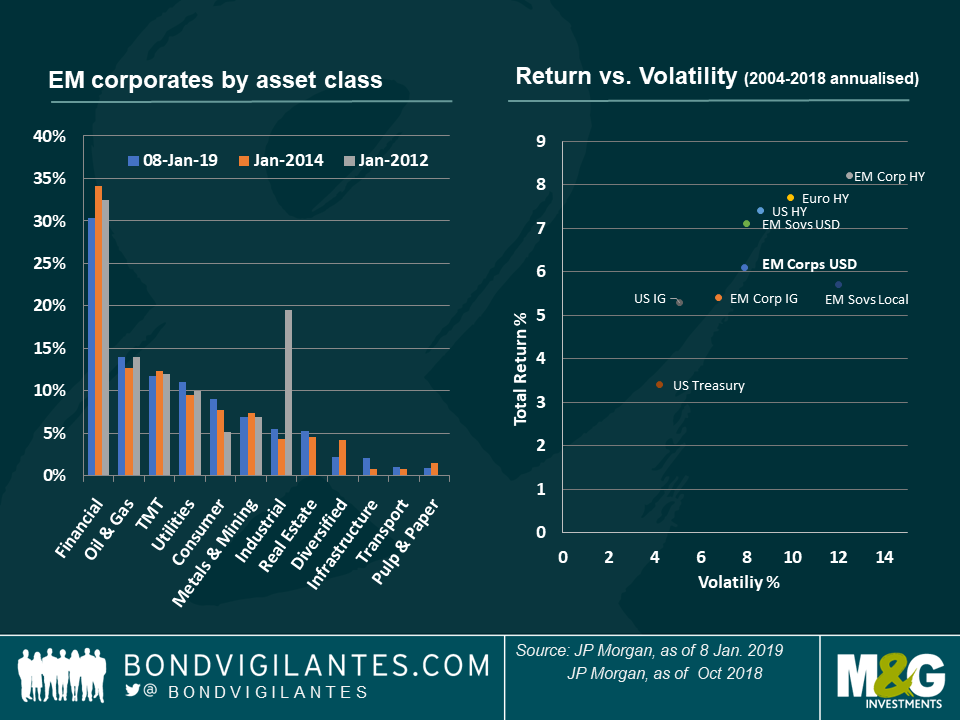
Looking at performance (Figure 6.), EM external corporate bonds have generated decent returns in their relatively short history. Since 2004, last year’s total return of -1.65% (JP Morgan CEMBI BD index) was only the third year with negative returns (after 2008: -16.8% and 2013: -1.3%) whilst the cumulative return during the period (2004 to Oct 2018) was 145%. The index’ annualised total return was 6.1% whilst annualised volatility stood at 7.9%. For an asset class that has an average credit rating of BBB-, returns look higher than developed-market counterparts but so does volatility. The asset class’s Sharpe Ratio of 0.6 appears average, if not better, compared to other asset classes during the same period (2004 to October 2018) but lower than EM sovereign external debt (0.7), US HY (0.7) or US IG (0.7).
Emerging Market High Yield Bonds: Size Matters.
The substantial increase in EM external corporate bonds has had implications for other asset classes, notably Global High Yield. Historically, emerging market corporates have been a small allocation in global high yield investment mandates where many primarily focus on the US market followed by the European high yield bond market. In 2009 investors justified the smaller allocation to EM by the 8% weight in the index (Figure 7.). In 2015 EM HY surpassed in size European HY in the index due to two main reasons. Firstly, EM high yield issuance increased significantly between 2009 and 2015, in line with the rest of the EM external bond market. Secondly, a lot of existing EM bonds were downgraded to high yield after many sovereign issuers lost their investment grade status (e.g. Brazil, Russia) in the aftermath of the Taper Tantrum. As such, new issuers, like Brazil’s national oil company Petrobras or Turkish banks, appeared in the global high yield index.
Figure 7 (left) / Figure 8 (right)
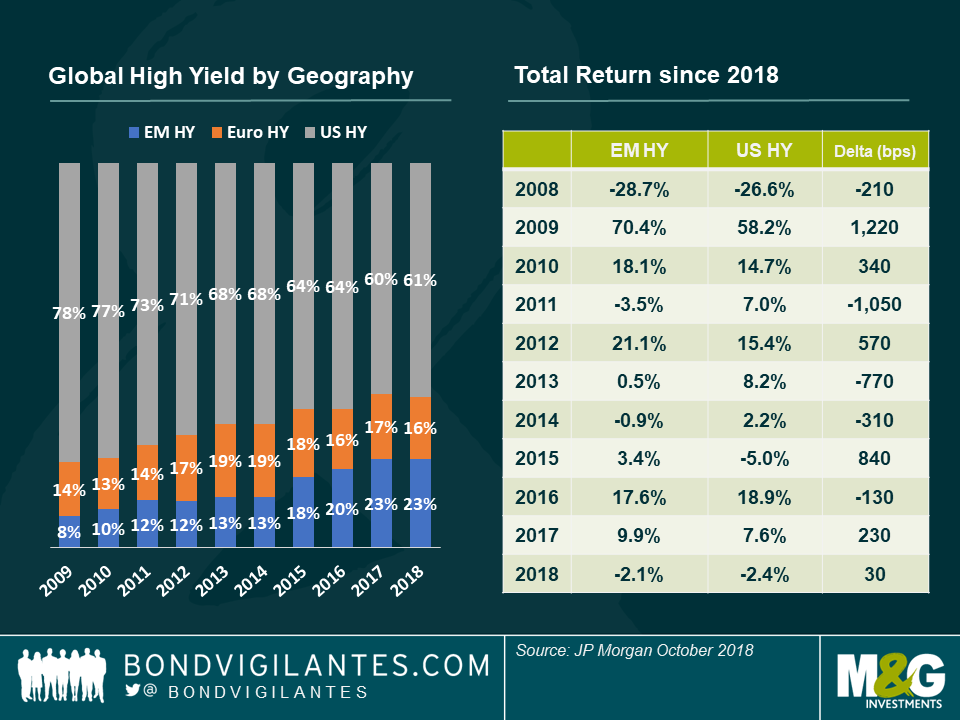
Today, EM HY bonds represent 23% of the BofAML’s Global High Yield index and the outlook points to an increasing share of EM going forward. Another interesting element is the index composition which demonstrates that emerging markets are not small weights in the index. Emerging market issuers account for 20% of the market value of the top 150 issuers (representing 47% of the global high yield index) Furthermore, Petrobras and Israel-based pharmaceutical company Teva are respectively the first (2.1%) and fifth (1.2%) largest issuers in the index.
Surprisingly, US investors nevertheless still avoid EM with an estimated holding of 2.2% of EM HY bonds in US high yield portfolios. But this does not seem to be driven by valuations, since the range of EM HY holding has fluctuated between just 2% and 4% since 2011. The underweight stance is rather explained by geographic and sector bias of US and European high yield managers. This tends to be confirmed by significant holdings either in countries that are geographically close to the country of origin (e.g. Mexico) or in sectors that have global reach (e.g. commodities, TMT) and for which non-EM high yield analysts and portfolio managers feel more comfortable. The perceived lower credit quality and additional top-down approach required to analyse EM corporate bonds are also factors that could explain why the asset class remains under-represented.
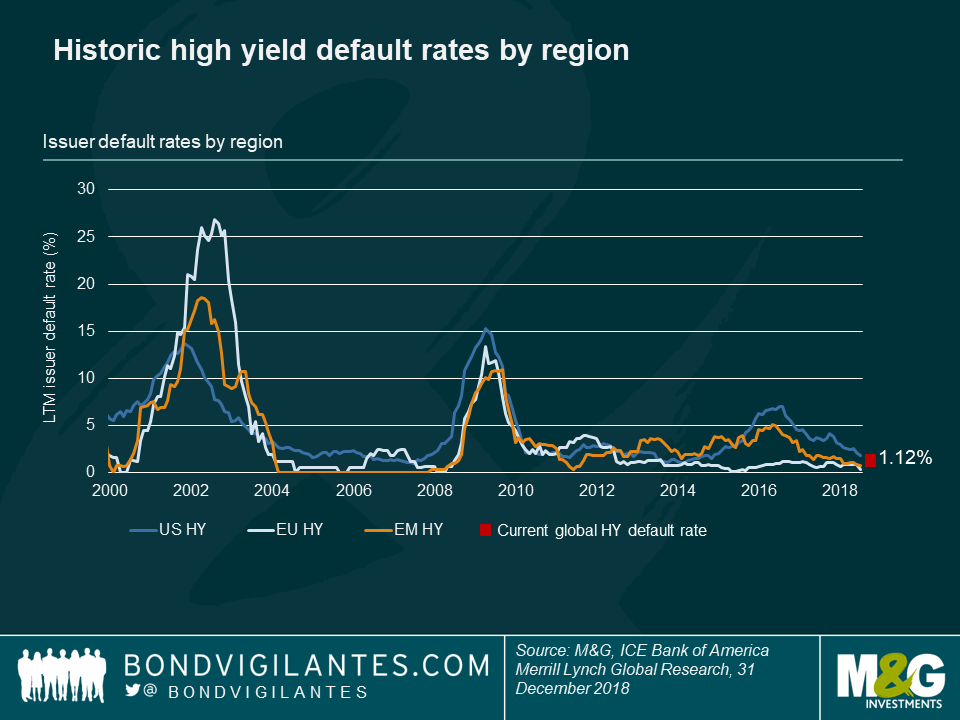
Yet, EM HY default risk (Figure 9.) and recovery values look no worse than their US and European counterparts. You can read more here: https://bondvigilantes.com/blog/panoramic-outlook/emerging-market-corporate-bonds/ On the returns front, the trend since 2008 suggest that US and EM HY returns can be very diverse (Figure 8.). As the size of EM HY continues its march higher, asset allocation within global high yield bond funds is likely to become a much more important driver of future performance.
Figure 9.
Emerging Market Corporate Bonds in Local Currency: the niche market.
It may be surprising to developed market investors but the size of the emerging market local currency bond universe (sovereigns + corporates) is almost 5 times larger than the external bond market (Figure 10.). But as ever in emerging markets, don’t be fooled by appearances. The fastest-growing market has been the local-currency corporate bond market which now totals approximately US$ 7.8 trillion equivalent – that compares with US$ 2.2 trillion of EM external corporate bonds. Yet, local corporate markets remain niche because of two main drivers: currency risk and thin liquidity.
There are two types of EM local-currency corporate bonds: local and global local bonds.
Local local corporate bonds are bonds issued locally subject to local taxation and regulatory rules, which require domestic custodian accounts. They account for more than 90% of the EM local corporate bond universe with half being onshore Chinese debt. Local bonds appeal most to domestic investors because they don’t have to take the currency risk. The bonds in general also tend to offer a yield pick-up over local sovereign bonds and knowledgeable local participants (brokers, traders, investors, analysts) help navigate the market. Foreign investors conversely may find it difficult to invest because of taxation, currency risk, thin liquidity and limited availability of information outside of the country.
Figure 10.

Global local corporate bonds are local bonds that settle through Euroclear where investors don’t require local accounts and in general are tax-free bonds. They account for less than 10% of the local corporate bonds. This market also includes dual-currency bonds which are local bonds that settle in a different currency (often US dollar). They are often coined with peculiar names, e.g. masala bonds in India or komodo bonds in Indonesia. Foreign credit investors usually favour this market because it removes the tax burden. Liquidity nevertheless remains a big hurdle. Roughly half of euro-clearable bonds are not index eligible mainly because of the lack of liquidity (no active pricing or bond size filter). Taking BofAML’s LCCD index as a proxy for the most liquid names, the “investable” global local bond universe stood at just US$ 245 billion. This is only a fraction of the optically huge US$ 7,800 billion local EM corporate bond stock and arguably most index bonds will see some liquidity only in small size (i.e. below $1 million equivalent) in sharp contrast to much better liquidity elsewhere in EM debt. Foreign investors also remain exposed to currency risk. Analysis of the index shows that the volatility of the asset class is nearest to EM local-currency sovereign bonds and furthest to EM external corporate bonds. This means that the currency risk – as opposed to corporate credit risk – is one of the primary drivers of volatility whilst liquidity is poorer than the very liquid EM local-currency sovereign bond universe. Furthermore, the lack of country, and currency, diversification may not be suitable to all portfolios. China, Mexico, South Africa, Russia, Malaysia, India, Colombia and Singapore accounted for 85% of BofAML’s LCCD index as of 15 January 2019. As a final point of note, the lack of index research and coverage by rating agencies (28% of the index is not rated) may be additional barriers for foreign investors who may favour the more diversified and liquid external corporate bond market.
The value of investments will fluctuate, which will cause prices to fall as well as rise and you may not get back the original amount you invested. Past performance is not a guide to future performance.
19 years of comment
Discover historical blogs from our extensive archive with our Blast from the past feature. View the most popular blogs posted this month - 5, 10 or 15 years ago!


Bond Vigilantes
Get Bond Vigilantes updates straight to your inbox